***Last / Change / Volume data in this table is the closing quote data***
Symbol/Exchange
Company Name
Industry Group |
PRICE |
CHANGE
(%Change) |
Day High |
Volume
(% DAV)
(% 50 day avg vol) |
52 Wk Hi
% From Hi |
Featured
Date |
Price
Featured |
Pivot Featured |
|
Max Buy |
 SIVB
-
NASDAQ
SIVB
-
NASDAQ
S V B Financial Group
BANKING - Regional - Pacific Banks
|
$590.95
|
-3.37
-0.57% |
$601.35
|
534,379
128.77% of 50 DAV
50 DAV is 415,000
|
$608.84
-2.94%
|
8/6/2021
|
$589.70
|
PP = $608.94
|
|
MB = $639.39
|
Most Recent Note - 8/10/2021 12:44:10 PM
Y - Pulling back after challenging prior highs, consolidating near its 50 DMA line ($566.16). Color code was changed to yellow with new pivot point cited based on its 6/08/21 high plus 10 cents. Subsequent gains above the pivot point backed by at least +40% above average volume may trigger a new technical buy signal. Reported Jun '21 quarterly earnings +106% on +69% sales revenues versus the year ago period, continuing its strong earnings track record. Prior lows in the $531-529 area define important near-term support to watch.
>>> FEATURED STOCK ARTICLE : Consolidating Near Prior Highs Facing Little Resistance - 8/9/2021 |
View all notes |
Set NEW NOTE alert |
Company Profile |
SEC
News |
Chart |
Request a new note
C
A
S
I |
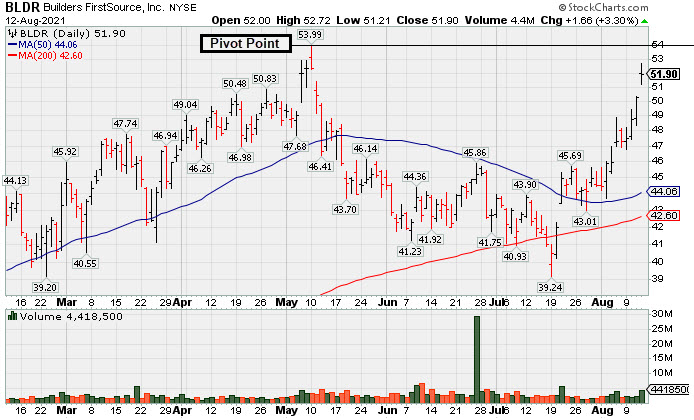
BLDR
-
NYSE
Builders Firstsource Inc
Bldg-Constr Prds/Misc
|
$51.90
|
+1.66
3.30% |
$52.72
|
4,437,299
131.63% of 50 DAV
50 DAV is 3,371,000
|
$53.99
-3.87%
|
8/12/2021
|
$52.38
|
PP = $54.09
|
|
MB = $56.79
|
 Most Recent Note - 8/12/2021 5:01:20 PM
Y - Posted a 4th consecutive gain today with ever-increasing volume for its third-best ever close. Highlighted in yellow with pivot point cited based on its 5/10/21 high plus 10 cents in the earlier mid-day report. Subsequent gains above the pivot point backed by at least +40% above average volume may trigger a technical buy signal. Found support near its 200 DMA line. Reported very strong Dec '20, Mar and Jun '21 quarterly results versus the year ago periods. Sequential quarterly comparisons show impressive acceleration in its sales revenues growth rate as earnings also improved. Annual earning growth has been strong and steady A criteria). See the latest FSU analysis for more details and a new annotated graph.
>>> FEATURED STOCK ARTICLE : Rebounding Near Prior High After Another Strong Quarter - 8/12/2021 |
View all notes |
Set NEW NOTE alert |
Company Profile |
SEC
News |
Chart |
Request a new note
C
A
S
I |
CROX
-
NASDAQ
Crocs Inc
CONSUMER NON-DURABLES - Textile - Apparel Footwear
|
$144.08
|
+1.88
1.32% |
$144.82
|
882,893
74.88% of 50 DAV
50 DAV is 1,179,000
|
$145.60
-1.04%
|
6/14/2021
|
$112.64
|
PP = $110.01
|
|
MB = $115.51
|
Most Recent Note - 8/11/2021 3:59:18 PM
G - Perched at its all-time high, extended from any sound base. Near-term support to watch is at its 50 DMA line ($119).
>>> FEATURED STOCK ARTICLE : Quietly Consolidating Below "Max Buy" Level - 7/7/2021 |
View all notes |
Set NEW NOTE alert |
Company Profile |
SEC
News |
Chart |
Request a new note
C
A
S
I |
CRL
-
NYSE
Charles River Labs Intl
DRUGS - Biotechnology
|
$407.78
|
+8.52
2.13% |
$408.28
|
171,680
52.99% of 50 DAV
50 DAV is 324,000
|
$420.25
-2.97%
|
6/9/2021
|
$345.91
|
PP = $349.23
|
|
MB = $366.69
|
Most Recent Note - 8/9/2021 5:40:17 PM
G - Extended from any sound base and stubbornly holding its ground perched near its all-time high. Recent volume totals have been lackluster while wedging into record high territory. Its 50 DMA line ($373) defines near-term support to watch on pullbacks. Two of the past 3 quarterly comparisons through Mar '21 have been above the +25% minimum earnings guideline (C criteria).
>>> FEATURED STOCK ARTICLE : Volume Totals Cooling While Perched at High - 7/13/2021 |
View all notes |
Set NEW NOTE alert |
Company Profile |
SEC
News |
Chart |
Request a new note
C
A
S
I |
GNRC
-
NYSE
Generac Hldgs Inc
Electrical-Power/Equipmt
|
$423.32
|
+6.10
1.46% |
$423.80
|
671,692
83.34% of 50 DAV
50 DAV is 806,000
|
$457.00
-7.37%
|
6/8/2021
|
$348.46
|
PP = $342.38
|
|
MB = $359.50
|
Most Recent Note - 8/12/2021 5:15:54 PM
G - Recently finding support while consolidating above its 50 DMA line ($405). Reported Jun '21 quarterly earnings +71% on +68% sales revenues versus the year ago period. Fundamentals remain strong.
>>> FEATURED STOCK ARTICLE : Gain for New High Leaves GNRC Very Extended From Prior Base - 7/12/2021 |
View all notes |
Set NEW NOTE alert |
Company Profile |
SEC
News |
Chart |
Request a new note
C
A
S
I |
Symbol/Exchange
Company Name
Industry Group |
PRICE |
CHANGE
(%Change) |
Day High |
Volume
(% DAV)
(% 50 day avg vol) |
52 Wk Hi
% From Hi |
Featured
Date |
Price
Featured |
Pivot Featured |
|
Max Buy |
CAMT
-
NASDAQ
Camtek Ltd
ELECTRONICS - Scientific and Technical Instrum
|
$38.06
|
+0.60
1.60% |
$38.14
|
143,687
65.91% of 50 DAV
50 DAV is 218,000
|
$40.47
-5.96%
|
8/4/2021
|
$39.67
|
PP = $40.57
|
|
MB = $42.60
|
Most Recent Note - 8/12/2021 5:02:36 PM
Y - Still hovering near its all-time high. Bullish action came after it reported Jun '21 quarterly earnings +138% on +82% sales revenues versus the year-ago period, continuing its strong earnings track record. A new pivot point was cited based on its 6/09/21 high plus 10 cents. Subsequent gains and a close above the pivot point backed by at least +40% above average volume may trigger a new (or add-on) technical buy signal. The 50 DMA line ($36.57) defines important near-term support to watch on pullbacks.
>>> FEATURED STOCK ARTICLE : Loss With Light Volume Undercut 50-Day Moving Average - 7/8/2021 |
View all notes |
Set NEW NOTE alert |
Company Profile |
SEC
News |
Chart |
Request a new note
C
A
S
I |
PKI
-
NYSE
Perkinelmer Inc
ELECTRONICS - Scientific and Technical Instrum
|
$182.29
|
+3.06
1.71% |
$182.41
|
665,991
89.51% of 50 DAV
50 DAV is 744,000
|
$188.40
-3.24%
|
7/26/2021
|
$168.06
|
PP = $162.80
|
|
MB = $170.94
|
Most Recent Note - 8/11/2021 4:53:09 PM
G - Pulled back today for a 2nd consecutive loss after getting extended from any sound base. Prior high ($162) defines initial support to watch above its 50 DMA line ($159). Reported earnings +80% on +51% sales revenues for the Jun '21 quarter versus the year ago period.
>>> FEATURED STOCK ARTICLE : Powerful Volume-Driven Breakout After Earnings Report - 7/26/2021 |
View all notes |
Set NEW NOTE alert |
Company Profile |
SEC
News |
Chart |
Request a new note
C
A
S
I |
TRMB
-
NASDAQ
Trimble Inc
ELECTRONICS - Scientific and Technical Instrum
|
$88.61
|
-0.48
-0.54% |
$89.19
|
863,335
90.31% of 50 DAV
50 DAV is 956,000
|
$90.25
-1.82%
|
8/5/2021
|
$88.83
|
PP = $84.97
|
|
MB = $89.22
|
Most Recent Note - 8/12/2021 5:04:47 PM
Y - Stubbornly holding its ground near its all-time high since highlighted in yellow with pivot point cited based on its 4/06/21 high plus 10 cents in the 8/05/21 mid-day report. The big gain above the pivot point was backed by +72% above average volume to clinch a proper technical buy signal. Found support at its 50 DMA line ($82.24). Reported earnings +38% on +29% sales revenues for the Jun '21 quarter versus the year ago period. Three of the past 4 quarterly comparisons were above the +25% minimum earnings guideline (C criteria). Annual earnings (A criteria) growth has been strong and steady.
>>> FEATURED STOCK ARTICLE : Finished Strong With Gain for New High Backed by Volume - 8/5/2021 |
View all notes |
Set NEW NOTE alert |
Company Profile |
SEC
News |
Chart |
Request a new note
C
A
S
I |
UMC
-
NYSE
United Microelectrnc Adr
ELECTRONICS - Semiconductor - Integrated Cir
|
$10.93
|
+0.09
0.83% |
$10.94
|
3,324,441
52.37% of 50 DAV
50 DAV is 6,348,000
|
$11.71
-6.66%
|
8/5/2021
|
$11.62
|
PP = $11.38
|
|
MB = $11.95
|
Most Recent Note - 8/10/2021 11:16:17 AM
Y - Pulling back today for a 3rd consecutive loss since reaching a new 52-week high. Recent highs and its 50 DMA line define near term support to watch in the high $9 area.
>>> FEATURED STOCK ARTICLE : Taiwan-Based Semiconductor Firm's Breakout Highlighted This Week - 8/6/2021 |
View all notes |
Set NEW NOTE alert |
Company Profile |
SEC
News |
Chart |
Request a new note
C
A
S
I |
ASML
-
NASDAQ
A S M L Holding N.V. NY
ELECTRONICS - Semiconductor Equipment and Mate
|
$781.07
|
-8.15
-1.03% |
$788.70
|
764,395
114.77% of 50 DAV
50 DAV is 666,000
|
$805.64
-3.05%
|
5/25/2021
|
$669.59
|
PP = $675.75
|
|
MB = $709.54
|
Most Recent Note - 8/12/2021 12:40:09 PM
G - Extended from any sound base and hovering near its all-time high, stubbornly holding its ground with volume totals cooling. Its 50 DMA line ($717) defines important near-term support to watch on pullbacks. See the latest FSU analysis for more details and an annotated graph.
>>> FEATURED STOCK ARTICLE : Semi Equipment Firm Extended From Any Sound Base - 8/11/2021 |
View all notes |
Set NEW NOTE alert |
Company Profile |
SEC
News |
Chart |
Request a new note
C
A
S
I |
Symbol/Exchange
Company Name
Industry Group |
PRICE |
CHANGE
(%Change) |
Day High |
Volume
(% DAV)
(% 50 day avg vol) |
52 Wk Hi
% From Hi |
Featured
Date |
Price
Featured |
Pivot Featured |
|
Max Buy |
ENTG
-
NASDAQ
Entegris Inc
ELECTRONICS - Semiconductor Equipment and Mate
|
$113.41
|
-2.83
-2.43% |
$115.46
|
952,678
138.47% of 50 DAV
50 DAV is 688,000
|
$126.41
-10.28%
|
8/4/2021
|
$125.33
|
PP = $126.51
|
|
MB = $132.84
|
Most Recent Note - 8/12/2021 5:10:22 PM
G - Slumped further below its 50 DMA line ($118.28) with heavier volume behind today's loss raising greater concerns. A rebound and subsequent gains and a close above the pivot point backed by at least +40% above average volume may trigger a proper technical buy signal. Fundamentals remain strong as it reported Jun '21 quarterly earnings +42% on +27% sales revenues. Its Relative Strength Rating has slumped to 78, below the 80+ minimum guideline for buy candidates.
>>> FEATURED STOCK ARTICLE : Perched Near High After 6th Consecutive Gain - 8/4/2021 |
View all notes |
Set NEW NOTE alert |
Company Profile |
SEC
News |
Chart |
Request a new note
C
A
S
I |
LUNA
-
NASDAQ
Luna Innovations Inc
Medical-Research Eqp/Svc
|
$11.15
|
+0.15
1.36% |
$11.25
|
151,823
92.91% of 50 DAV
50 DAV is 163,400
|
$13.05
-14.56%
|
7/26/2021
|
$12.46
|
PP = $13.15
|
|
MB = $13.81
|
Most Recent Note - 8/10/2021 12:39:10 PM
G - Gapped down today and its color code was changed to green. Weakness came after reporting Jun '21 quarterly earnings +0% on +50% sales revenues versus the year ago period, below the +25% minimum earnings guideline (C criteria), raising fundamental concerns. Disciplined investors note that since featured on 7/26/21 it did not trigger a proper technical buy signal.
>>> FEATURED STOCK ARTICLE : Pulled Back After Streak of Gains Challenging 52-Week High - 7/27/2021 |
View all notes |
Set NEW NOTE alert |
Company Profile |
SEC
News |
Chart |
Request a new note
C
A
S
I |
CLFD
-
NASDAQ
Clearfield Inc
TELECOMMUNICATIONS - Cables / Satalite Equipment
|
$42.23
|
+0.15
0.36% |
$42.28
|
31,326
24.67% of 50 DAV
50 DAV is 127,000
|
$45.36
-6.90%
|
7/23/2021
|
$40.23
|
PP = $43.74
|
|
MB = $45.93
|
Most Recent Note - 8/11/2021 3:58:11 PM
Y - Still holding its ground stubbornly near its high with volume totals cooling after recent volume-driven gains. Fundamentals remain strong. Bullish action came after it reported Jun '21 quarterly earnings +100% on +49% sales revenues.
>>> FEATURED STOCK ARTICLE : Big Volume-Driven Gain Challenging Prior High After Earnings - 7/23/2021 |
View all notes |
Set NEW NOTE alert |
Company Profile |
SEC
News |
Chart |
Request a new note
C
A
S
I |
POOL
-
NASDAQ
Pool Corp
WHOLESALE - Basic Materials Wholesale
|
$484.73
|
+1.56
0.32% |
$486.88
|
174,635
70.13% of 50 DAV
50 DAV is 249,000
|
$495.22
-2.12%
|
6/21/2021
|
$455.09
|
PP = $449.54
|
|
MB = $472.02
|
Most Recent Note - 8/6/2021 5:20:01 PM
G - Volume totals are cooling while perched at its all-time high, extended from any sound base. Its 50 DMA line ($456) defines important near-term support to watch.
>>> FEATURED STOCK ARTICLE : Churned Heavy Volume While Testing 50-Day Moving Average - 7/22/2021 |
View all notes |
Set NEW NOTE alert |
Company Profile |
SEC
News |
Chart |
Request a new note
C
A
S
I |
FSBW
-
NASDAQ
F S Bancorp
Banks-West/Southwest
|
$35.66
|
+0.01
0.03% |
$36.45
|
49,531
176.90% of 50 DAV
50 DAV is 28,000
|
$36.85
-3.23%
|
5/18/2021
|
$35.08
|
PP = $36.85
|
|
MB = $38.69
|
Most Recent Note - 8/11/2021 4:07:14 PM
G - Consolidating above its 50 DMA line and near its 52-week high with today's gain backed by light volume. Recently reported Jun '21 quarterly earnings -16% on -11% sales revenues versus the year ago period raising fundamental concerns. Do not be confused by a 2:1 stock split which impacted share prices as of 7/15/21 (Featured Price, Pivot Point, and Max Buy levels were updated accordingly).
>>> FEATURED STOCK ARTICLE : Latest Earnings Report Broke Streak of Strong Increases - 7/29/2021 |
View all notes |
Set NEW NOTE alert |
Company Profile |
SEC
News |
Chart |
Request a new note
C
A
S
I |
Symbol/Exchange
Company Name
Industry Group |
PRICE |
CHANGE
(%Change) |
Day High |
Volume
(% DAV)
(% 50 day avg vol) |
52 Wk Hi
% From Hi |
Featured
Date |
Price
Featured |
Pivot Featured |
|
Max Buy |
SMPL
-
NASDAQ
Simply Good Foods Co
Food-Confectionery
|
$35.99
|
-0.12
-0.33% |
$36.57
|
268,380
56.38% of 50 DAV
50 DAV is 476,000
|
$38.50
-6.52%
|
12/28/2020
|
$30.40
|
PP = $31.44
|
|
MB = $33.01
|
Most Recent Note - 8/11/2021 4:05:44 PM
G - Consolidating near its 50 DMA line ($36.31) and testing near prior highs in the $35 area. More damaging losses would raise greater concerns. Reported May '21 quarterly earnings +65% on +32% sales revenues versus the year ago period, well above the +25% minimum earnings guideline (C criteria).
>>> FEATURED STOCK ARTICLE : Pulled Back from High With Small Losses on Light Volume - 7/15/2021 |
View all notes |
Set NEW NOTE alert |
Company Profile |
SEC
News |
Chart |
Request a new note
C
A
S
I |
PYPL
-
NASDAQ
"PayPal Holdings, Inc"
Finance-CrdtCard/PmtPr
|
$274.59
|
-1.82
-0.66% |
$276.81
|
4,471,232
71.44% of 50 DAV
50 DAV is 6,258,700
|
$310.16
-11.47%
|
7/27/2021
|
$296.69
|
PP = $307.82
|
|
MB = $323.21
|
Most Recent Note - 8/6/2021 5:21:59 PM
G - Still sputtering after slumping below its 50 DMA line ($284) with damaging volume-driven losses recently raising concerns, technically. Weak action came after it reported Jun '21 quarterly earnings +7% on +19% sales revenues versus the year ago period, below the +25% minimum earnings guideline (C criteria), raising fundamental concerns.
>>> FEATURED STOCK ARTICLE : Paypal Perched at Record High - 7/28/2021 |
View all notes |
Set NEW NOTE alert |
Company Profile |
SEC
News |
Chart |
Request a new note
C
A
S
I |
SQ
-
NYSE
Square Inc Cl A
Finance-CrdtCard/PmtPr
|
$268.59
|
-2.50
-0.92% |
$272.84
|
5,099,724
58.67% of 50 DAV
50 DAV is 8,692,000
|
$289.23
-7.14%
|
8/2/2021
|
$273.78
|
PP = $283.29
|
|
MB = $297.45
|
Most Recent Note - 8/6/2021 5:27:54 PM
Y - Pulled back today with lighter (average) volume. Hit a new all-time high on the prior session with a big volume-driven gain above the pivot point triggering a technical buy signal. It reported Jun '21 quarterly earnings +267% on +143% sales revenues versus the year ago period, its 4th strong comparison well above the +25% minimum guideline (C criteria).
>>> FEATURED STOCK ARTICLE : Pullback Following Big Gain on Strong Earnings and M&A News - 8/3/2021 |
View all notes |
Set NEW NOTE alert |
Company Profile |
SEC
News |
Chart |
Request a new note
C
A
S
I |
SHOP
-
NYSE
Shopify Inc Cl A
Computer Sftwr-Enterprse
|
$1,503.20
|
+17.97
1.21% |
$1,514.00
|
1,083,457
78.63% of 50 DAV
50 DAV is 1,378,000
|
$1,650.00
-8.90%
|
7/2/2021
|
$1,468.00
|
PP = $1,552.23
|
|
MB = $1,629.84
|
Most Recent Note - 8/9/2021 5:38:48 PM
Y - Consolidating near its pivot point after encountering distributional pressure. Its 50 DMA line ($1,442) and recent low define near term support to watch. Reported Jun '21 quarterly earnings +113% on +57% sales revenues versus the year ago period.
>>> FEATURED STOCK ARTICLE : Managed a Positive Reversal After Early Weakness - 7/19/2021 |
View all notes |
Set NEW NOTE alert |
Company Profile |
SEC
News |
Chart |
Request a new note
C
A
S
I |
YETI
-
NYSE
Yeti Holdings Inc
Leisure-Products
|
$102.00
|
-0.25
-0.24% |
$102.34
|
598,000
52.73% of 50 DAV
50 DAV is 1,134,000
|
$105.62
-3.43%
|
5/13/2021
|
$84.20
|
PP = $90.65
|
|
MB = $95.18
|
Most Recent Note - 8/6/2021 5:25:35 PM
G - There was a "negative reversal" today on light volume after hitting new all-time highs with recent gains backed by above average volume. Reported Jun '21 quarterly earnings +66% on +45% sales revenues versus the year ago period, continuing its strong earnings track record. Its 50 DMA line ($92.51) defines near-term support to watch on pullbacks.
>>> FEATURED STOCK ARTICLE : Volume Totals Cooling While Consolidating Near High - 7/9/2021 |
View all notes |
Set NEW NOTE alert |
Company Profile |
SEC
News |
Chart |
Request a new note
C
A
S
I |
Symbol/Exchange
Company Name
Industry Group |
PRICE |
CHANGE
(%Change) |
Day High |
Volume
(% DAV)
(% 50 day avg vol) |
52 Wk Hi
% From Hi |
Featured
Date |
Price
Featured |
Pivot Featured |
|
Max Buy |
DOCU
-
NASDAQ
Docusign Inc
Computer Sftwr-Enterprse
|
$295.54
|
+2.48
0.85% |
$300.09
|
1,061,616
37.22% of 50 DAV
50 DAV is 2,852,000
|
$314.76
-6.11%
|
7/6/2021
|
$288.96
|
PP = $290.33
|
|
MB = $304.85
|
Most Recent Note - 8/11/2021 4:00:41 PM
Y - Pulled back today with below average volume after a "negative reversal" on the prior session at its all-time high. Wedged into new high territory with recent gains lacking great volume conviction. Prior low ($270.41 on 7/15/21) defines initial support above its 50 DMA line ($278).
>>> FEATURED STOCK ARTICLE : Touched New High With Average Volume Behind Today's Gain - 7/6/2021 |
View all notes |
Set NEW NOTE alert |
Company Profile |
SEC
News |
Chart |
Request a new note
C
A
S
I |
XPEL
-
NASDAQ
Xpel Inc
Auto/Truck-Tires andamp; Misc
|
$82.80
|
-3.91
-4.51% |
$86.40
|
238,487
104.60% of 50 DAV
50 DAV is 228,000
|
$103.84
-20.26%
|
7/21/2021
|
$92.25
|
PP = $94.31
|
|
MB = $99.03
|
Most Recent Note - 8/12/2021 5:06:15 PM
G - It remains sputtering below its 50 DMA line ($87.59) after it raised concerns and fell back into the previously noted base. Prior lows in the $78.50 area define the next important support. Fundamentals remain strong after it reported Jun '21 quarterly earnings +164% on +92% sales revenues versus the year ago period.
>>> FEATURED STOCK ARTICLE : New Base Formed May Be "Late Stage" - 7/21/2021 |
View all notes |
Set NEW NOTE alert |
Company Profile |
SEC
News |
Chart |
Request a new note
C
A
S
I |
JEF
-
NYSE
Jefferies Financial Grp
Finance-Invest Bnk/Bkrs
|
$35.67
|
-0.09
-0.25% |
$36.02
|
813,829
40.51% of 50 DAV
50 DAV is 2,009,000
|
$35.78
-0.31%
|
6/28/2021
|
$31.81
|
PP = $34.42
|
|
MB = $36.14
|
Most Recent Note - 8/10/2021 5:32:30 PM
Y - Posted a 4th consecutive gain with light volume, wedging up for new high closes. Found support when recently testing its 50 DMA line ($32.56). More damaging losses would raise concerns and trigger a technical sell signal. As previously noted - "Subsequent gains above the pivot point backed by at least +40% above average volume are necessary to trigger a technical buy signal." See the latest FSU analysis for more details and a new annotated graph.
>>> FEATURED STOCK ARTICLE : Quiet Gains for New High Closes - 8/10/2021 |
View all notes |
Set NEW NOTE alert |
Company Profile |
SEC
News |
Chart |
Request a new note
C
A
S
I |
CLAR
-
NASDAQ
Clarus Corporation
Leisure-Products
|
$28.11
|
-0.96
-3.30% |
$29.15
|
188,668
83.48% of 50 DAV
50 DAV is 226,000
|
$32.36
-13.13%
|
5/12/2021
|
$21.40
|
PP = $19.73
|
|
MB = $20.72
|
Most Recent Note - 8/12/2021 5:08:20 PM
G - Pulled back today with near average volume and ended near the session low. Pulling back from its 52-week high after getting very extended from any sound base. Bullish action came after it reported Jun '21 quarterly earnings +244% on +41% sales revenues versus the year ago period, showing impressive sales revenues and earnings acceleration in sequential quarterly comparisons. Its 50 DMA line ($26.71) defines important near-term support to watch on pullbacks.
>>> FEATURED STOCK ARTICLE : Extended From Prior Base and Hitting Another New High - 7/20/2021 |
View all notes |
Set NEW NOTE alert |
Company Profile |
SEC
News |
Chart |
Request a new note
C
A
S
I |
AVTR
-
NYSE
Avantor Inc
Medical-Research Eqp/Svc
|
$38.54
|
+0.69
1.82% |
$38.58
|
1,914,772
52.29% of 50 DAV
50 DAV is 3,662,000
|
$38.86
-0.82%
|
6/10/2021
|
$32.94
|
PP = $34.09
|
|
MB = $35.79
|
Most Recent Note - 8/12/2021 5:11:46 PM
G - Volume totals have been below average while stubbornly holding its ground perched at its all-time high, extended from any sound base. Reported Jun '21 earnings +84% on +26% sales revenues versus the year ago period. Its 50 DMA line ($35.74) defines support above the prior high in the $34 area.
>>> FEATURED STOCK ARTICLE : Held Ground But Made Little Price Progress Since Featured - 7/14/2021 |
View all notes |
Set NEW NOTE alert |
Company Profile |
SEC
News |
Chart |
Request a new note
C
A
S
I |
Symbol/Exchange
Company Name
Industry Group |
PRICE |
CHANGE
(%Change) |
Day High |
Volume
(% DAV)
(% 50 day avg vol) |
52 Wk Hi
% From Hi |
Featured
Date |
Price
Featured |
Pivot Featured |
|
Max Buy |
MIME
-
NASDAQ
Mimecast Limited
Computer Sftwr-Security
|
$59.16
|
+0.51
0.87% |
$59.70
|
611,484
107.66% of 50 DAV
50 DAV is 568,000
|
$59.96
-1.33%
|
8/2/2021
|
$56.12
|
PP = $59.58
|
|
MB = $62.56
|
Most Recent Note - 8/9/2021 5:44:12 PM
Y - Stubbornly holding its ground with volume totals cooling after a big volume-driven gain on 8/03/21 for a new all-time high. Bullish action came after reporting Jun '21 quarterly earnings +45% on +24% sales revenues versus the year ago period. It was highlighted in yellow in the prior mid-day report with pivot point cited based on its 12/28/20 high plus 10 cents when noted - "Subsequent gains above the pivot point backed by at least +40% above average volume may trigger a technical buy signal."
>>> FEATURED STOCK ARTICLE : Perched Not Far From High With Earnings News Due Pre-Open - 8/2/2021 |
View all notes |
Set NEW NOTE alert |
Company Profile |
SEC
News |
Chart |
Request a new note
C
A
S
I |