***Last / Change / Volume data in this table is the closing quote data***
Symbol/Exchange
Company Name
Industry Group |
PRICE |
CHANGE
(%Change) |
Day High |
Volume
(% DAV)
(% 50 day avg vol) |
52 Wk Hi
% From Hi |
Featured
Date |
Price
Featured |
Pivot Featured |
|
Max Buy |
 ABCB
-
NASDAQ
ABCB
-
NASDAQ
Ameris Bancorp
BANKING - Regional - Mid-Atlantic Banks
|
$48.40
|
-0.48
-0.98% |
$49.19
|
474,193
110.02% of 50 DAV
50 DAV is 431,000
|
$59.85
-19.13%
|
5/21/2021
|
$58.86
|
PP = $57.91
|
|
MB = $60.81
|
 Most Recent Note - 7/7/2021 3:03:20 PM
Slumping further with today's 3rd consecutive loss and it will be dropped from the Featured Stocks list tonight. A rebound above the 50 DMA line (54.28) is needed for its outlook to improve.
>>> FEATURED STOCK ARTICLE : Still Sputtering After Damaging Losses Triggered Sell Signal - 6/29/2021 |
View all notes |
Set NEW NOTE alert |
Company Profile |
SEC
News |
Chart |
Request a new note
C
A
S
I |
SIVB
-
NASDAQ
S V B Financial Group
BANKING - Regional - Pacific Banks
|
$551.64
|
+1.63
0.30% |
$556.46
|
285,098
74.44% of 50 DAV
50 DAV is 383,000
|
$608.84
-9.39%
|
4/23/2021
|
$579.70
|
PP = $577.16
|
|
MB = $606.02
|
Most Recent Note - 7/6/2021 5:56:22 PM
G - With today's volume-driven loss it slumped further below its 50 DMA line ($570) which recently has acted as resistance. A rebound above the 50 DMA line is needed for its outlook to improve. Confirming gains above the pivot point backed by at least +40% above average volume are still needed to help clinch a convincing technical buy signal. Reported earnings +293% on +64% sales revenues for the Mar '21 quarter versus the year ago period, its 3rd strong comparison. Completed a new Public Offering on 3/24/21.
>>> FEATURED STOCK ARTICLE : Consolidating Near 50-Day Average After Distributional Pressure - 6/25/2021 |
View all notes |
Set NEW NOTE alert |
Company Profile |
SEC
News |
Chart |
Request a new note
C
A
S
I |
LOGI
-
NASDAQ
Logitech Intl Sa
COMPUTER HARDWARE - Computer Peripherals
|
$126.83
|
+2.66
2.14% |
$128.42
|
869,958
102.71% of 50 DAV
50 DAV is 847,000
|
$140.17
-9.52%
|
5/26/2021
|
$119.13
|
PP = $120.34
|
|
MB = $126.36
|
Most Recent Note - 7/7/2021 3:15:27 PM
G - Color code is changed to green after rising back above its "max buy" level with today's 3rd consecutive gain. Halted its slide after slumping near prior highs in the $120-117 area which define important support to watch along with its 50 DMA line ($119.56).
>>> FEATURED STOCK ARTICLE : Recent Pullback is Testing Important Technical Support - 7/2/2021 |
View all notes |
Set NEW NOTE alert |
Company Profile |
SEC
News |
Chart |
Request a new note
C
A
S
I |
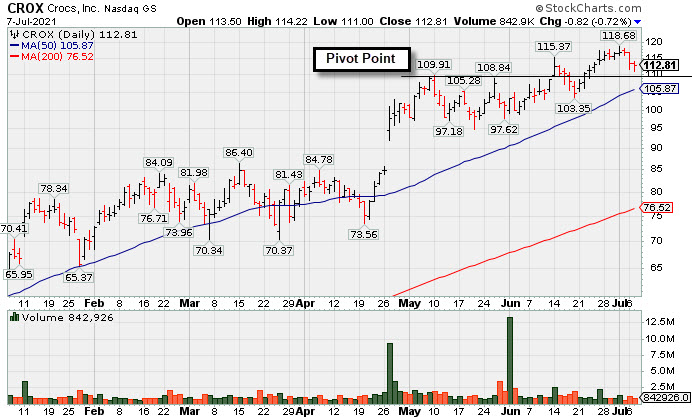
CROX
-
NASDAQ
Crocs Inc
CONSUMER NON-DURABLES - Textile - Apparel Footwear
|
$112.81
|
-0.82
-0.72% |
$114.22
|
842,963
47.17% of 50 DAV
50 DAV is 1,787,000
|
$118.68
-4.95%
|
6/14/2021
|
$112.64
|
PP = $110.01
|
|
MB = $115.51
|
Most Recent Note - 7/7/2021 5:33:05 PM
Y - Color code is changed to yellow as volume totals have been light while it pulled back below its "max buy" level. Its prior highs in the $109 area and its 50 DMA line ($105.87) define support to watch on pullbacks. See the latest FSU analysis for more details and a new annotated graph.
>>> FEATURED STOCK ARTICLE : Quietly Consolidating Below "Max Buy" Level - 7/7/2021 |
View all notes |
Set NEW NOTE alert |
Company Profile |
SEC
News |
Chart |
Request a new note
C
A
S
I |
RCKY
-
NASDAQ
Rocky Brands Inc
CONSUMER NON-DURABLES - Textile - Apparel Footwear
|
$48.15
|
-3.79
-7.30% |
$51.81
|
155,320
176.50% of 50 DAV
50 DAV is 88,000
|
$69.00
-30.22%
|
5/5/2021
|
$61.65
|
PP = $61.55
|
|
MB = $64.63
|
Most Recent Note - 7/7/2021 2:49:56 PM
Suffering a 2nd consecutive big volume-driven loss today violating the prior low ($50.52 on 5/19/21) triggering a more worrisome technical sell signal. It will be dropped from the Featured Stocks list tonight.
>>> FEATURED STOCK ARTICLE : Still Sputtering After Slump Below 50-Day Moving Average - 6/7/2021 |
View all notes |
Set NEW NOTE alert |
Company Profile |
SEC
News |
Chart |
Request a new note
C
A
S
I |
Symbol/Exchange
Company Name
Industry Group |
PRICE |
CHANGE
(%Change) |
Day High |
Volume
(% DAV)
(% 50 day avg vol) |
52 Wk Hi
% From Hi |
Featured
Date |
Price
Featured |
Pivot Featured |
|
Max Buy |
CRL
-
NYSE
Charles River Labs Intl
DRUGS - Biotechnology
|
$383.18
|
+5.73
1.52% |
$384.30
|
302,960
43.22% of 50 DAV
50 DAV is 701,000
|
$378.99
1.11%
|
6/9/2021
|
$345.91
|
PP = $349.23
|
|
MB = $366.69
|
Most Recent Note - 7/2/2021 4:18:16 PM
G - Color code is changed to green while there was below average volume behind recent gains as it wedged above its "max buy" level. Prior highs in the $349 area and its 50 DMA line ($342) define near-term support to watch on pullbacks. Two of the past 3 quarterly comparisons through Mar '21 have been above the +25% minimum earnings guideline (C criteria).
>>> FEATURED STOCK ARTICLE : Building New Base After Strong Quarterly Earnings Report - 6/9/2021 |
View all notes |
Set NEW NOTE alert |
Company Profile |
SEC
News |
Chart |
Request a new note
C
A
S
I |
GNRC
-
NYSE
Generac Hldgs Inc
Electrical-Power/Equipmt
|
$432.77
|
+3.42
0.80% |
$440.00
|
739,898
96.34% of 50 DAV
50 DAV is 768,000
|
$433.41
-0.15%
|
6/8/2021
|
$348.46
|
PP = $342.38
|
|
MB = $359.50
|
Most Recent Note - 7/6/2021 5:54:07 PM
G - Volume was +27% above average behind today's gain for yet another new all-time high, getting more extended from the previously noted base. Prior high ($364) defines initial support to watch on pullbacks. Fundamentals remain strong.
>>> FEATURED STOCK ARTICLE : Gap Up Gain With +118% Above Average Volume - 6/8/2021 |
View all notes |
Set NEW NOTE alert |
Company Profile |
SEC
News |
Chart |
Request a new note
C
A
S
I |
CAMT
-
NASDAQ
Camtek Ltd
ELECTRONICS - Scientific and Technical Instrum
|
$35.47
|
-0.49
-1.36% |
$36.58
|
217,332
69.88% of 50 DAV
50 DAV is 311,000
|
$40.47
-12.35%
|
4/28/2021
|
$35.03
|
PP = $35.34
|
|
MB = $37.11
|
Most Recent Note - 7/7/2021 3:07:24 PM
Y - Quietly consolidating near prior highs in the $35-36 area. Its 50 DMA line ($34.50) defines important near-term support to watch where any violation would raise concerns and trigger a technical sell signal.
>>> FEATURED STOCK ARTICLE : Perched at 52-Week High After 4th Consecutive Gain - 6/1/2021 |
View all notes |
Set NEW NOTE alert |
Company Profile |
SEC
News |
Chart |
Request a new note
C
A
S
I |
ASML
-
NASDAQ
A S M L Holding N.V. NY
ELECTRONICS - Semiconductor Equipment and Mate
|
$690.18
|
+4.31
0.63% |
$695.72
|
440,505
58.19% of 50 DAV
50 DAV is 757,000
|
$710.97
-2.92%
|
5/25/2021
|
$669.59
|
PP = $675.75
|
|
MB = $709.54
|
Most Recent Note - 7/7/2021 3:05:18 PM
Y - Still stubbornly holding its ground after encountering distributional pressure. The prior high ($675) and its 50 DMA line ($668) defines important near-term support to watch on pullbacks.
>>> FEATURED STOCK ARTICLE : Volume Higher While Pulling Back Toward 50-Day Moving Average - 7/1/2021 |
View all notes |
Set NEW NOTE alert |
Company Profile |
SEC
News |
Chart |
Request a new note
C
A
S
I |
BRKS
-
NASDAQ
Brooks Automation
ELECTRONICS - Semiconductor Equipment and Mate
|
$88.43
|
-1.90
-2.10% |
$91.62
|
826,353
84.24% of 50 DAV
50 DAV is 981,000
|
$108.72
-18.66%
|
4/5/2021
|
$99.31
|
PP = $91.88
|
|
MB = $96.47
|
Most Recent Note - 7/7/2021 2:57:01 PM
Its 50 DMA line ($96) acted as resistance. On track today for a 6th consecutive loss, and it will be dropped from the Featured Stocks list tonight. A rebound above the 50 DMA line is needed for its outlook to improve. Slumping near the recent low ($86.12 on 5/12/21) where a violation would trigger a more worrisome technical sell signal.
>>> FEATURED STOCK ARTICLE : Consolidating Above 50-Day Moving Average Line and Prior High - 6/3/2021 |
View all notes |
Set NEW NOTE alert |
Company Profile |
SEC
News |
Chart |
Request a new note
C
A
S
I |
Symbol/Exchange
Company Name
Industry Group |
PRICE |
CHANGE
(%Change) |
Day High |
Volume
(% DAV)
(% 50 day avg vol) |
52 Wk Hi
% From Hi |
Featured
Date |
Price
Featured |
Pivot Featured |
|
Max Buy |
OPY
-
NYSE
Oppenheimer Holdings Inc
FINANCIAL SERVICES - Investment Brokerage - Regiona
|
$47.08
|
-1.62
-3.33% |
$48.64
|
127,290
116.78% of 50 DAV
50 DAV is 109,000
|
$55.75
-15.55%
|
6/7/2021
|
$48.74
|
PP = $52.55
|
|
MB = $55.18
|
Most Recent Note - 7/7/2021 3:01:40 PM
Down again today for a big loss after it violated its 50 DMA line ($49.84) on the prior session triggering a technical sell signal. Only a prompt rebound above the 50 DMA line would help its outlook improve. It will be dropped from the Featured Stocks list tonight. Fundamentals remain strong.
>>> FEATURED STOCK ARTICLE : Abrupt Slump Back Into Latest Base With 2 Volume-Driven Losses - 6/18/2021 |
View all notes |
Set NEW NOTE alert |
Company Profile |
SEC
News |
Chart |
Request a new note
C
A
S
I |
MED
-
NYSE
Medifast Inc
SPECIALTY RETAIL - Specialty Retail, Other
|
$288.27
|
+4.15
1.46% |
$288.66
|
73,708
60.42% of 50 DAV
50 DAV is 122,000
|
$336.99
-14.46%
|
5/11/2021
|
$285.72
|
PP = $279.56
|
|
MB = $293.54
|
Most Recent Note - 7/7/2021 3:09:36 PM
G - Quietly consolidating after undercutting the prior high in the $279 area and finding support near its 50 DMA line ($286). More damaging losses below the prior low ($258.77 on 6/17/21) would raise greater concerns and trigger a worrisome technical sell signal.
>>> FEATURED STOCK ARTICLE : Halted 10-Session Losing Streak Near Prior High and 50 DMA - 6/15/2021 |
View all notes |
Set NEW NOTE alert |
Company Profile |
SEC
News |
Chart |
Request a new note
C
A
S
I |
CLFD
-
NASDAQ
Clearfield Inc
TELECOMMUNICATIONS - Cables / Satalite Equipment
|
$37.53
|
-0.66
-1.73% |
$38.60
|
80,550
61.02% of 50 DAV
50 DAV is 132,000
|
$43.64
-14.00%
|
6/4/2021
|
$40.01
|
PP = $40.36
|
|
MB = $42.38
|
Most Recent Note - 7/6/2021 5:46:25 PM
G - Posted a gain today with lighter than average volume. Consolidating above its 50 DMA line ($37.17) has helped its outlook improve, but it still faces some resistance due to overhead supply up to the $43 level. Fundamentals remain strong.
>>> FEATURED STOCK ARTICLE : Consolidating Above 50-Day Moving Average Helped Outlook - 6/30/2021 |
View all notes |
Set NEW NOTE alert |
Company Profile |
SEC
News |
Chart |
Request a new note
C
A
S
I |
POOL
-
NASDAQ
Pool Corp
WHOLESALE - Basic Materials Wholesale
|
$470.32
|
+5.79
1.25% |
$472.33
|
283,728
114.41% of 50 DAV
50 DAV is 248,000
|
$470.15
0.04%
|
6/21/2021
|
$455.09
|
PP = $449.54
|
|
MB = $472.02
|
Most Recent Note - 7/6/2021 5:51:52 PM
Y - Volume totals have been cooling while hovering near its 52-week high. Prior highs in the $449-444 range define initial support to watch above its 50 DMA line ($438) on pullbacks.
>>> FEATURED STOCK ARTICLE : Volume-Driven Breakout After Orderly Consolidation - 6/21/2021 |
View all notes |
Set NEW NOTE alert |
Company Profile |
SEC
News |
Chart |
Request a new note
C
A
S
I |
FSBW
-
NASDAQ
F S Bancorp
Banks-West/Southwest
|
$68.47
|
-1.33
-1.91% |
$69.71
|
9,257
57.86% of 50 DAV
50 DAV is 16,000
|
$73.62
-7.00%
|
5/18/2021
|
$70.16
|
PP = $73.72
|
|
MB = $77.41
|
Most Recent Note - 7/6/2021 12:39:25 PM
Y - Encountering distributional pressure today and while recently perched within striking distance of the pivot point cited based on its 3/08/21 high plus 10 cents. Consolidating near its 50 DMA line ($69.97) where it found prompt support during its ongoing ascent. Subsequent gains above the pivot point backed by at least +40% above average volume are needed to trigger a technical buy signal.
>>> FEATURED STOCK ARTICLE : Still Consolidating With Close Striking Distance of All-Time High - 6/24/2021 |
View all notes |
Set NEW NOTE alert |
Company Profile |
SEC
News |
Chart |
Request a new note
C
A
S
I |
Symbol/Exchange
Company Name
Industry Group |
PRICE |
CHANGE
(%Change) |
Day High |
Volume
(% DAV)
(% 50 day avg vol) |
52 Wk Hi
% From Hi |
Featured
Date |
Price
Featured |
Pivot Featured |
|
Max Buy |
SMPL
-
NASDAQ
Simply Good Foods Co
Food-Confectionery
|
$37.26
|
+0.21
0.57% |
$37.49
|
613,314
114.21% of 50 DAV
50 DAV is 537,000
|
$38.50
-3.22%
|
12/28/2020
|
$30.40
|
PP = $31.44
|
|
MB = $33.01
|
Most Recent Note - 7/7/2021 3:13:40 PM
G - Holding its ground stubbornly with volume totals cooling after hitting a new all-time high on 7/01/21 when last noted. Prior highs in the $35 area define near-term support to watch along with its 50 DMA line ($34.96). Reported May '21 quarterly earnings +65% on +32% sales revenues versus the year ago period, well above the +25% minimum earnings guideline (C criteria).
>>> FEATURED STOCK ARTICLE : Simply Wedging Into New High Territory - 6/14/2021 |
View all notes |
Set NEW NOTE alert |
Company Profile |
SEC
News |
Chart |
Request a new note
C
A
S
I |
SHOP
-
NYSE
Shopify Inc Cl A
Computer Sftwr-Enterprse
|
$1,520.22
|
-17.81
-1.16% |
$1,587.74
|
1,662,166
111.26% of 50 DAV
50 DAV is 1,494,000
|
$1,552.23
-2.06%
|
7/2/2021
|
$1,468.00
|
PP = $1,552.23
|
|
MB = $1,629.84
|
Most Recent Note - 7/7/2021 1:04:06 PM
Y - Reversed into the red today after hitting a new high. A new pivot point was recently cited based on its 6/21/21 high while building on a cup-with-high-handle base. Confirming gains with at least +40% above average volume for new highs would trigger a new (or add-on) technical buy signal and be a reassuring sign of fresh institutional buying demand.
>>> FEATURED STOCK ARTICLE : Rebounding After Choppy 4-Month Consolidation - 6/16/2021 |
View all notes |
Set NEW NOTE alert |
Company Profile |
SEC
News |
Chart |
Request a new note
C
A
S
I |
YETI
-
NYSE
Yeti Holdings Inc
Leisure-Products
|
$92.19
|
+0.33
0.36% |
$92.97
|
429,296
28.70% of 50 DAV
50 DAV is 1,496,000
|
$95.76
-3.73%
|
5/13/2021
|
$84.20
|
PP = $90.65
|
|
MB = $95.18
|
Most Recent Note - 7/2/2021 3:51:03 PM
Y - Volume totals have been cooling while consolidating near its 52-week high. The 50 DMA line ($88.81) and prior low ($85.08 on 6/18/21) define near-term support to watch on pullbacks. Reported Mar 21 quarterly earnings +245% on +42% sales revenues versus the year ago period, continuing its strong earnings track record.
>>> FEATURED STOCK ARTICLE : Hovering Near High After Finding Support at 50-Day Moving Average - 6/4/2021 |
View all notes |
Set NEW NOTE alert |
Company Profile |
SEC
News |
Chart |
Request a new note
C
A
S
I |
DOCU
-
NASDAQ
Docusign Inc
Computer Sftwr-Enterprse
|
$288.94
|
+0.76
0.26% |
$293.65
|
3,061,800
98.55% of 50 DAV
50 DAV is 3,107,000
|
$293.61
-1.59%
|
7/6/2021
|
$288.96
|
PP = $290.33
|
|
MB = $304.85
|
Most Recent Note - 7/7/2021 12:29:45 PM
Y - Wedging into new high territory with today's gain backed by above average volume. Highlighted in yellow with pivot point cited based on its 9/02/20 high plus 10 cents. A gain and strong close above the pivot point cited backed by at least +40% above average volume may trigger a convincing new (or add-on) technical buy signal. Fundamentals remain strong after reporting very strong Apr '21 quarterly results. It went through a choppy consolidation then rebounded since noted on 3/03/21 when dropped from the Featured Stocks list. See the latest FSU analysis for more details and an annotated graph.
>>> FEATURED STOCK ARTICLE : Touched New High With Average Volume Behind Today's Gain - 7/6/2021 |
View all notes |
Set NEW NOTE alert |
Company Profile |
SEC
News |
Chart |
Request a new note
C
A
S
I |
MRBK
-
NASDAQ
Meridian Corp
Banks-Northeast
|
$25.49
|
-0.74
-2.82% |
$26.30
|
24,804
59.06% of 50 DAV
50 DAV is 42,000
|
$29.18
-12.65%
|
5/18/2021
|
$25.58
|
PP = $28.06
|
|
MB = $29.46
|
Most Recent Note - 7/6/2021 5:27:58 PM
G - Color code is changed to green as it churned average volume today while consolidating in a tight range but now below its 50 DMA line ($26.53). Stalled since reaching a new 52-week high when featured on 5/18/21. Reported Mar '21 earnings +323% on +93% sales revenues versus the year ago period, continuing its strong earnings track record. Recent low ($24.01 on 4/21/21) defines important near-term support where any violation may trigger a worrisome technical sell signal. Its Relative Strength Rating is 77, below the 80 minimum guideline.
>>> FEATURED STOCK ARTICLE : Stalled Yet Found Support at 50-Day Moving Average Line - 6/11/2021 |
View all notes |
Set NEW NOTE alert |
Company Profile |
SEC
News |
Chart |
Request a new note
C
A
S
I |
Symbol/Exchange
Company Name
Industry Group |
PRICE |
CHANGE
(%Change) |
Day High |
Volume
(% DAV)
(% 50 day avg vol) |
52 Wk Hi
% From Hi |
Featured
Date |
Price
Featured |
Pivot Featured |
|
Max Buy |
JEF
-
NYSE
Jefferies Financial Grp
Finance-Invest Bnk/Bkrs
|
$32.66
|
-0.75
-2.24% |
$33.51
|
2,251,284
111.84% of 50 DAV
50 DAV is 2,013,000
|
$34.98
-6.63%
|
6/28/2021
|
$31.81
|
PP = $34.42
|
|
MB = $36.14
|
Most Recent Note - 7/6/2021 5:49:44 PM
Y - Holding its ground well but it has suffered 4 consecutive small losses since a considerable gap up for a big volume-driven gain noted on 6/29/21. The bullish action came after it reported May '21 quarterly earnings +713% on +70% sales revenues versus the year ago period, continuing its strong earnings rack record. Previously noted - "Subsequent gains above the pivot point backed by at least +40% above average volume are necessary to trigger a technical buy signal. The past 3 quarterly comparisons through Feb '21 showed strong earnings increases with solid sales revenues growth. Annual earnings history (the A criteria) has been strong."
>>> FEATURED STOCK ARTICLE : High-Ranked Financial Firm Formed "Double Bottom" Base - 6/28/2021 |
View all notes |
Set NEW NOTE alert |
Company Profile |
SEC
News |
Chart |
Request a new note
C
A
S
I |
CLAR
-
NASDAQ
Clarus Corporation
Leisure-Products
|
$27.15
|
+0.11
0.41% |
$27.95
|
205,258
88.09% of 50 DAV
50 DAV is 233,000
|
$27.44
-1.06%
|
5/12/2021
|
$21.40
|
PP = $19.73
|
|
MB = $20.72
|
Most Recent Note - 7/2/2021 12:15:57 PM
G - Perched at its 52-week high today after 4 consecutive gains. It did not form a sound base of sufficient length. Its 50 DMA line ($22.62) defines important near-term support to watch.
>>> FEATURED STOCK ARTICLE : Encountering Distributional Pressure After Recent Rally - 6/17/2021 |
View all notes |
Set NEW NOTE alert |
Company Profile |
SEC
News |
Chart |
Request a new note
C
A
S
I |
AVTR
-
NYSE
Avantor Inc
Medical-Research Eqp/Svc
|
$35.72
|
-0.48
-1.33% |
$36.42
|
2,700,799
66.74% of 50 DAV
50 DAV is 4,047,000
|
$36.31
-1.62%
|
6/10/2021
|
$32.94
|
PP = $34.09
|
|
MB = $35.79
|
Most Recent Note - 7/6/2021 5:52:54 PM
G - Color code is changed to green after quietly rising back above its "max buy" level. Stubbornly held its ground and made gradual progress since triggering a technical buy signal. Prior highs in the $33 area define initial support to watch on pullbacks.
>>> FEATURED STOCK ARTICLE : Medical Research Firm Challenging Prior High - 6/10/2021 |
View all notes |
Set NEW NOTE alert |
Company Profile |
SEC
News |
Chart |
Request a new note
C
A
S
I |