***Last / Change / Volume data in this table is the closing quote data***
Symbol/Exchange
Company Name
Industry Group |
PRICE |
CHANGE
(%Change) |
Day High |
Volume
(% DAV)
(% 50 day avg vol) |
52 Wk Hi
% From Hi |
Featured
Date |
Price
Featured |
Pivot Featured |
|
Max Buy |
 SIVB
-
NASDAQ
SIVB
-
NASDAQ
S V B Financial Group
BANKING - Regional - Pacific Banks
|
$544.18
|
-5.78
-1.05% |
$567.46
|
282,886
77.29% of 50 DAV
50 DAV is 366,000
|
$608.84
-10.62%
|
4/23/2021
|
$579.70
|
PP = $577.16
|
|
MB = $606.02
|
Most Recent Note - 7/30/2021 5:49:30 PM
G - Ended with a loss today with higher (near average) volume, still sputtering below its 50 DMA line ($567.53). A rebound above the 50 DMA line is needed for its outlook to improve. Reported Jun '21 quarterly earnings +106% on +69% sales revenues versus the year ago period, continuing its strong earnings track record.
>>> FEATURED STOCK ARTICLE : Consolidating Near 50-Day Average After Distributional Pressure - 6/25/2021 |
View all notes |
Set NEW NOTE alert |
Company Profile |
SEC
News |
Chart |
Request a new note
C
A
S
I |
LOGI
-
NASDAQ
Logitech Intl Sa
COMPUTER HARDWARE - Computer Peripherals
|
$108.16
|
-0.89
-0.82% |
$110.13
|
1,156,240
134.18% of 50 DAV
50 DAV is 861,700
|
$140.17
-22.84%
|
5/26/2021
|
$119.13
|
PP = $120.34
|
|
MB = $126.36
|
Most Recent Note - 7/27/2021 9:55:38 AM
G - Gapped down today after reporting Jun '21 quarterly earnings +91% on +66% sales revenues versus the year ago period. Volume and volatility often increase near earnings news. Met noted resistance when rebounding near its 50 DMA line. Its 200 DMA line ($105) defines the next important chart support.
>>> FEATURED STOCK ARTICLE : Recent Pullback is Testing Important Technical Support - 7/2/2021 |
View all notes |
Set NEW NOTE alert |
Company Profile |
SEC
News |
Chart |
Request a new note
C
A
S
I |
CROX
-
NASDAQ
Crocs Inc
CONSUMER NON-DURABLES - Textile - Apparel Footwear
|
$136.64
|
+0.83
0.61% |
$140.99
|
1,232,641
80.99% of 50 DAV
50 DAV is 1,522,000
|
$138.69
-1.48%
|
6/14/2021
|
$112.64
|
PP = $110.01
|
|
MB = $115.51
|
Most Recent Note - 7/29/2021 5:27:51 PM
G - Powered into new all-time high territory with a solid gain today, getting more extended from any sound base. Found support at its 50 DMA line ($112).
>>> FEATURED STOCK ARTICLE : Quietly Consolidating Below "Max Buy" Level - 7/7/2021 |
View all notes |
Set NEW NOTE alert |
Company Profile |
SEC
News |
Chart |
Request a new note
C
A
S
I |
CRL
-
NYSE
Charles River Labs Intl
DRUGS - Biotechnology
|
$405.60
|
-1.32
-0.32% |
$410.52
|
408,636
98.94% of 50 DAV
50 DAV is 413,000
|
$410.15
-1.11%
|
6/9/2021
|
$345.91
|
PP = $349.23
|
|
MB = $366.69
|
 Most Recent Note - 8/2/2021 5:27:57 PM
G - Extended from any sound base and perched at its all-time high. Recent volume totals have been lackluster while wedging into record high territory. Its 50 DMA line ($365) and prior high in the $349 area define near-term support to watch on pullbacks. Two of the past 3 quarterly comparisons through Mar '21 have been above the +25% minimum earnings guideline (C criteria).
>>> FEATURED STOCK ARTICLE : Volume Totals Cooling While Perched at High - 7/13/2021 |
View all notes |
Set NEW NOTE alert |
Company Profile |
SEC
News |
Chart |
Request a new note
C
A
S
I |
GNRC
-
NYSE
Generac Hldgs Inc
Electrical-Power/Equipmt
|
$400.00
|
-19.36
-4.62% |
$421.32
|
1,260,848
155.85% of 50 DAV
50 DAV is 809,000
|
$457.00
-12.47%
|
6/8/2021
|
$348.46
|
PP = $342.38
|
|
MB = $359.50
|
Most Recent Note - 8/2/2021 5:42:00 PM
G - Suffered another damaging volume-driven loss today, slumping toward its 50 DMA line ($390) which defines important near-term support to watch. Reported Jun '21 quarterly earnings +71% on +68% sales revenues versus the year ago period. Fundamentals remain strong.
>>> FEATURED STOCK ARTICLE : Gain for New High Leaves GNRC Very Extended From Prior Base - 7/12/2021 |
View all notes |
Set NEW NOTE alert |
Company Profile |
SEC
News |
Chart |
Request a new note
C
A
S
I |
Symbol/Exchange
Company Name
Industry Group |
PRICE |
CHANGE
(%Change) |
Day High |
Volume
(% DAV)
(% 50 day avg vol) |
52 Wk Hi
% From Hi |
Featured
Date |
Price
Featured |
Pivot Featured |
|
Max Buy |
CAMT
-
NASDAQ
Camtek Ltd
ELECTRONICS - Scientific and Technical Instrum
|
$37.17
|
-0.23
-0.61% |
$38.42
|
126,364
49.55% of 50 DAV
50 DAV is 255,000
|
$40.47
-8.15%
|
4/28/2021
|
$35.03
|
PP = $35.34
|
|
MB = $37.11
|
Most Recent Note - 7/29/2021 5:24:02 PM
Y - Color code is changed to yellow after it posted a solid gain today with below average volume, rebounding well above the 50 DMA line ($35.87) helping its outlook improve. Due to report Jun '21 quarterly results on 8/04/21.
>>> FEATURED STOCK ARTICLE : Loss With Light Volume Undercut 50-Day Moving Average - 7/8/2021 |
View all notes |
Set NEW NOTE alert |
Company Profile |
SEC
News |
Chart |
Request a new note
C
A
S
I |
PKI
-
NYSE
Perkinelmer Inc
ELECTRONICS - Scientific and Technical Instrum
|
$183.84
|
+1.61
0.88% |
$185.68
|
1,248,714
164.09% of 50 DAV
50 DAV is 761,000
|
$183.85
-0.01%
|
7/26/2021
|
$168.06
|
PP = $162.80
|
|
MB = $170.94
|
Most Recent Note - 7/29/2021 12:48:04 PM
G - Rallied above its "max buy" level hitting another new all-time high today and its color code is changed to green. Bullish action came after it reported earnings +80% on +51% sales revenues for the Jun '21 quarter versus the year ago period. Prior high ($162) defines initial support to watch on pullbacks.
>>> FEATURED STOCK ARTICLE : Powerful Volume-Driven Breakout After Earnings Report - 7/26/2021 |
View all notes |
Set NEW NOTE alert |
Company Profile |
SEC
News |
Chart |
Request a new note
C
A
S
I |
ASML
-
NASDAQ
A S M L Holding N.V. NY
ELECTRONICS - Semiconductor Equipment and Mate
|
$769.65
|
+2.91
0.38% |
$775.84
|
490,366
68.39% of 50 DAV
50 DAV is 717,000
|
$768.70
0.12%
|
5/25/2021
|
$669.59
|
PP = $675.75
|
|
MB = $709.54
|
Most Recent Note - 7/27/2021 12:07:37 PM
G - Retreating today, it rallied well above its "max buy" level and hit new all-time highs with 5 consecutive volume-driven gains. Its 50 DMA line ($687) defines important near-term support to watch on pullbacks.
>>> FEATURED STOCK ARTICLE : Volume Higher While Pulling Back Toward 50-Day Moving Average - 7/1/2021 |
View all notes |
Set NEW NOTE alert |
Company Profile |
SEC
News |
Chart |
Request a new note
C
A
S
I |
LUNA
-
NASDAQ
Luna Innovations Inc
Medical-Research Eqp/Svc
|
$12.34
|
+0.01
0.08% |
$12.87
|
136,994
89.54% of 50 DAV
50 DAV is 153,000
|
$13.05
-5.44%
|
7/26/2021
|
$12.46
|
PP = $13.15
|
|
MB = $13.81
|
Most Recent Note - 7/28/2021 5:28:15 PM
Y - Posted another volume-driven gain today, adding to a spurt of gains marked by volume. Highlighted in yellow in the 7/26/21 mid-day report with pivot point cited based on its 3/12/21 high plus 10 cents. Rallied impressively from support at its 200 DMA line, nearly challenging its 52-week high. Subsequent gains above the pivot point backed by at least +40% above average volume may trigger a technical buy signal. Reported Mar '21 quarterly earnings +50% on +53% sales revenues versus the year ago period, its 4th strong quarterly comparison (C criteria). Annual earnings (A criteria) history has improved in recent years, helping it match with the fundamental guidelines of the fact-based investment system. See the latest FSU analysis for more details and an annotated graph.
>>> FEATURED STOCK ARTICLE : Pulled Back After Streak of Gains Challenging 52-Week High - 7/27/2021 |
View all notes |
Set NEW NOTE alert |
Company Profile |
SEC
News |
Chart |
Request a new note
C
A
S
I |
CLFD
-
NASDAQ
Clearfield Inc
TELECOMMUNICATIONS - Cables / Satalite Equipment
|
$42.98
|
-0.54
-1.24% |
$44.94
|
93,455
72.45% of 50 DAV
50 DAV is 129,000
|
$45.36
-5.25%
|
7/23/2021
|
$40.23
|
PP = $43.74
|
|
MB = $45.93
|
Most Recent Note - 7/29/2021 5:25:46 PM
Y - Posted a solid gain today with +53% above average volume for a best ever close. The big gain and close above the pivot point with volume triggered a new (or add-on) technical buy signal. Fundamentals remain strong. Bullish action came after it reported Jun '21 quarterly earnings +100% on +49% sales revenues."
>>> FEATURED STOCK ARTICLE : Big Volume-Driven Gain Challenging Prior High After Earnings - 7/23/2021 |
View all notes |
Set NEW NOTE alert |
Company Profile |
SEC
News |
Chart |
Request a new note
C
A
S
I |
Symbol/Exchange
Company Name
Industry Group |
PRICE |
CHANGE
(%Change) |
Day High |
Volume
(% DAV)
(% 50 day avg vol) |
52 Wk Hi
% From Hi |
Featured
Date |
Price
Featured |
Pivot Featured |
|
Max Buy |
POOL
-
NASDAQ
Pool Corp
WHOLESALE - Basic Materials Wholesale
|
$476.51
|
-1.31
-0.27% |
$482.24
|
191,311
71.92% of 50 DAV
50 DAV is 266,000
|
$484.42
-1.63%
|
6/21/2021
|
$455.09
|
PP = $449.54
|
|
MB = $472.02
|
Most Recent Note - 7/29/2021 5:32:33 PM
G - Posted a gain today with light volume for a new all-time high above its "max buy" level and its color code is changed to green. Found support at its 50 DMA line ($450) last week. Reported Jun '21 quarterly earnings +66% on +40% sales revenues versus the year ago period. Recent losses have tested prior highs in the $449-444 range and its 50 DMA line which define important support. More damaging losses would raise concerns and trigger a technical sell signal.
>>> FEATURED STOCK ARTICLE : Churned Heavy Volume While Testing 50-Day Moving Average - 7/22/2021 |
View all notes |
Set NEW NOTE alert |
Company Profile |
SEC
News |
Chart |
Request a new note
C
A
S
I |
FSBW
-
NASDAQ
F S Bancorp
Banks-West/Southwest
|
$34.85
|
+0.07
0.20% |
$35.53
|
20,033
66.78% of 50 DAV
50 DAV is 30,000
|
$36.85
-5.43%
|
5/18/2021
|
$35.08
|
PP = $36.85
|
|
MB = $38.69
|
Most Recent Note - 7/29/2021 5:33:05 PM
G - Color code is changed to green while consolidating near its 50 DMA line ($35.21). Recently reported Jun '21 quarterly earnings -16% on -11% sales revenues versus the year ago period raising fundamental concerns. Do not be confused by a 2:1 stock split which impacted share prices as of 7/15/21 (Featured Price, Pivot Point, and Max Buy levels were updated accordingly). See the latest FSU analysis for more details and a new annotated graph.
>>> FEATURED STOCK ARTICLE : Latest Earnings Report Broke Streak of Strong Increases - 7/29/2021 |
View all notes |
Set NEW NOTE alert |
Company Profile |
SEC
News |
Chart |
Request a new note
C
A
S
I |
SMPL
-
NASDAQ
Simply Good Foods Co
Food-Confectionery
|
$36.96
|
-0.52
-1.39% |
$37.77
|
245,949
50.71% of 50 DAV
50 DAV is 485,000
|
$38.50
-4.00%
|
12/28/2020
|
$30.40
|
PP = $31.44
|
|
MB = $33.01
|
Most Recent Note - 8/2/2021 5:35:22 PM
G - Still hovering near its all-time high with volume totals cooling in recent weeks. Its 50 DMA line ($36.07) and prior highs in the $35 area define important near-term support to watch on pullbacks. Reported May '21 quarterly earnings +65% on +32% sales revenues versus the year ago period, well above the +25% minimum earnings guideline (C criteria).
>>> FEATURED STOCK ARTICLE : Pulled Back from High With Small Losses on Light Volume - 7/15/2021 |
View all notes |
Set NEW NOTE alert |
Company Profile |
SEC
News |
Chart |
Request a new note
C
A
S
I |
PYPL
-
NASDAQ
"PayPal Holdings, Inc"
Finance-CrdtCard/PmtPr
|
$270.99
|
-4.54
-1.65% |
$276.89
|
10,028,970
162.50% of 50 DAV
50 DAV is 6,171,600
|
$310.16
-12.63%
|
7/27/2021
|
$296.69
|
PP = $307.82
|
|
MB = $323.21
|
Most Recent Note - 7/30/2021 12:47:06 PM
G - Slumping below its 50 DMA line ($282) with today's loss raising greater concerns. Color code was changed to green following a gap down on the prior session after it reported Jun '21 quarterly earnings +7% on +19% sales revenues versus the year ago period, below the +25% minimum earnings guideline (C criteria), raising fundamental concerns. Volume and volatility often increase near earnings news.
>>> FEATURED STOCK ARTICLE : Paypal Perched at Record High - 7/28/2021 |
View all notes |
Set NEW NOTE alert |
Company Profile |
SEC
News |
Chart |
Request a new note
C
A
S
I |
SQ
-
NYSE
Square Inc Cl A
Finance-CrdtCard/PmtPr
|
$272.38
|
+25.12
10.16% |
$280.88
|
45,505,328
594.53% of 50 DAV
50 DAV is 7,654,000
|
$283.19
-3.82%
|
8/2/2021
|
$273.78
|
PP = $283.29
|
|
MB = $297.45
|
Most Recent Note - 8/2/2021 5:36:15 PM
Y - Posted a big volume-driven gain today nearly challenging its all-time high following M&A news. Color code was changed to yellow with new pivot point cited based on its 2/16/21 high plus 10 cents. Faces some resistance due to overhead supply up to prior highs in the $283-278 area. Subsequent volume-driven gains above the pivot point may trigger a technical buy signal. Bullish action came after it reported Jun '21 quarterly earnings +267% on +143% sales revenues versus the year ago period, its 4th strong comparison well above the +25% minimum guideline (C criteria).
>>> FEATURED STOCK ARTICLE : Slumped Back Into Prior Base Testing 50-Day Average - 4/2/2018 |
View all notes |
Set NEW NOTE alert |
Company Profile |
SEC
News |
Chart |
Request a new note
C
A
S
I |
Symbol/Exchange
Company Name
Industry Group |
PRICE |
CHANGE
(%Change) |
Day High |
Volume
(% DAV)
(% 50 day avg vol) |
52 Wk Hi
% From Hi |
Featured
Date |
Price
Featured |
Pivot Featured |
|
Max Buy |
SHOP
-
NYSE
Shopify Inc Cl A
Computer Sftwr-Enterprse
|
$1,538.67
|
+38.74
2.58% |
$1,555.00
|
1,418,782
100.27% of 50 DAV
50 DAV is 1,415,000
|
$1,650.00
-6.75%
|
7/2/2021
|
$1,468.00
|
PP = $1,552.23
|
|
MB = $1,629.84
|
Most Recent Note - 7/28/2021 12:57:31 PM
Y - Color code was changed to yellow after pulling back below its "max buy" level. Its recent low and 50 DMA line ($1391) define near term support to watch. Reported Jun '21 quarterly earnings +113% on +57% sales revenues versus the year ago period.
>>> FEATURED STOCK ARTICLE : Managed a Positive Reversal After Early Weakness - 7/19/2021 |
View all notes |
Set NEW NOTE alert |
Company Profile |
SEC
News |
Chart |
Request a new note
C
A
S
I |
YETI
-
NYSE
Yeti Holdings Inc
Leisure-Products
|
$97.61
|
+1.28
1.33% |
$99.21
|
1,068,002
90.20% of 50 DAV
50 DAV is 1,184,000
|
$98.93
-1.33%
|
5/13/2021
|
$84.20
|
PP = $90.65
|
|
MB = $95.18
|
Most Recent Note - 8/2/2021 5:39:50 PM
G - Posted a gain today with average volume for a best-ever close. Near its 50 DMA line ($91.34) it recently found prompt support. Due to report Jun '21 quarterly results on 8/05/21. Volume and volatility often increase near earnings news.
>>> FEATURED STOCK ARTICLE : Volume Totals Cooling While Consolidating Near High - 7/9/2021 |
View all notes |
Set NEW NOTE alert |
Company Profile |
SEC
News |
Chart |
Request a new note
C
A
S
I |
DOCU
-
NASDAQ
Docusign Inc
Computer Sftwr-Enterprse
|
$295.10
|
-2.94
-0.99% |
$299.80
|
2,000,479
67.86% of 50 DAV
50 DAV is 2,948,000
|
$310.51
-4.96%
|
7/6/2021
|
$288.96
|
PP = $290.33
|
|
MB = $304.85
|
Most Recent Note - 7/27/2021 1:21:37 PM
Y - Quietly pulling back from its all-time high after wedging into new high territory with recent gains lacking great volume conviction. Prior low ($270.41 on 7/15/21) defines initial support above its 50 DMA line.
>>> FEATURED STOCK ARTICLE : Touched New High With Average Volume Behind Today's Gain - 7/6/2021 |
View all notes |
Set NEW NOTE alert |
Company Profile |
SEC
News |
Chart |
Request a new note
C
A
S
I |
XPEL
-
NASDAQ
Xpel Inc
Auto/Truck-Tires andamp; Misc
|
$92.95
|
+0.35
0.38% |
$95.97
|
226,340
98.84% of 50 DAV
50 DAV is 229,000
|
$103.84
-10.49%
|
7/21/2021
|
$92.25
|
PP = $94.31
|
|
MB = $99.03
|
Most Recent Note - 7/29/2021 5:30:41 PM
G - Posted a gain today with average volume after bouncing at its 50 DMA line ($86.28) and finding prompt support. Raised concerns this week as it fell back into the previously noted base. Reported Mar '21 quarterly earnings +317% on +83% sales revenues versus the year ago period, adding to its strong earnings track record.
>>> FEATURED STOCK ARTICLE : New Base Formed May Be "Late Stage" - 7/21/2021 |
View all notes |
Set NEW NOTE alert |
Company Profile |
SEC
News |
Chart |
Request a new note
C
A
S
I |
JEF
-
NYSE
Jefferies Financial Grp
Finance-Invest Bnk/Bkrs
|
$33.62
|
+0.43
1.30% |
$33.89
|
1,437,262
69.77% of 50 DAV
50 DAV is 2,060,000
|
$35.69
-5.80%
|
6/28/2021
|
$31.81
|
PP = $34.42
|
|
MB = $36.14
|
Most Recent Note - 8/2/2021 5:33:38 PM
Y - Volume totals have been cooling since it found support when recently testing its 50 DMA line ($32.27). More damaging losses would raise concerns and trigger a technical sell signal. As previously noted - "Subsequent gains above the pivot point backed by at least +40% above average volume are necessary to trigger a technical buy signal."
>>> FEATURED STOCK ARTICLE : High-Ranked Financial Firm Formed "Double Bottom" Base - 6/28/2021 |
View all notes |
Set NEW NOTE alert |
Company Profile |
SEC
News |
Chart |
Request a new note
C
A
S
I |
Symbol/Exchange
Company Name
Industry Group |
PRICE |
CHANGE
(%Change) |
Day High |
Volume
(% DAV)
(% 50 day avg vol) |
52 Wk Hi
% From Hi |
Featured
Date |
Price
Featured |
Pivot Featured |
|
Max Buy |
CLAR
-
NASDAQ
Clarus Corporation
Leisure-Products
|
$29.32
|
+0.80
2.81% |
$29.44
|
659,945
293.31% of 50 DAV
50 DAV is 225,000
|
$28.86
1.59%
|
5/12/2021
|
$21.40
|
PP = $19.73
|
|
MB = $20.72
|
Most Recent Note - 8/2/2021 5:32:26 PM
G - Posted a volume-driven gain today for a new 52-week high, getting very extended from any sound base. After the close it reported Jun '21 quarterly earnings +244% on +41% sales revenues versus the year ago period, showing impressive sales revenues and earnings acceleration in sequential quarterly comparisons. Its 50 DMA line ($25.83) defines important near-term support to watch on pullbacks.
>>> FEATURED STOCK ARTICLE : Extended From Prior Base and Hitting Another New High - 7/20/2021 |
View all notes |
Set NEW NOTE alert |
Company Profile |
SEC
News |
Chart |
Request a new note
C
A
S
I |
AVTR
-
NYSE
Avantor Inc
Medical-Research Eqp/Svc
|
$37.60
|
+0.02
0.05% |
$38.65
|
3,071,873
81.57% of 50 DAV
50 DAV is 3,766,000
|
$38.04
-1.16%
|
6/10/2021
|
$32.94
|
PP = $34.09
|
|
MB = $35.79
|
Most Recent Note - 7/30/2021 12:21:41 PM
G - Perched at its all-time high, extended from any sound base. Reported Jun '21 earnings +84% on +26% sales revenues versus the year ago period. Volume and volatility often increase near earnings news. Its 50 DMA line coincides with the prior high in the $34 area defining important support to watch on pullbacks.
>>> FEATURED STOCK ARTICLE : Held Ground But Made Little Price Progress Since Featured - 7/14/2021 |
View all notes |
Set NEW NOTE alert |
Company Profile |
SEC
News |
Chart |
Request a new note
C
A
S
I |
MIME
-
NASDAQ
Mimecast Limited
Computer Sftwr-Security
|
$55.12
|
-0.43
-0.77% |
$56.87
|
1,747,747
323.66% of 50 DAV
50 DAV is 540,000
|
$59.48
-7.33%
|
8/2/2021
|
$56.12
|
PP = $59.58
|
|
MB = $62.56
|
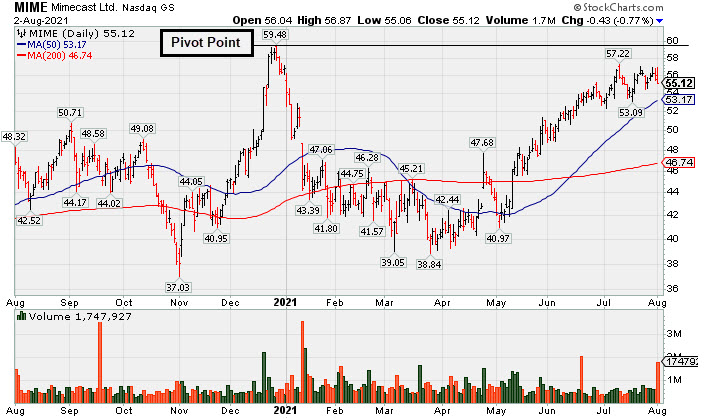
Most Recent Note - 8/2/2021 1:01:49 PM
Y - Color code is changed to yellow with pivot point cited based on its 12/28/20 high plus 10 cents. Recently rebounding near its all-time high. Subsequent gains above the pivot point backed by at least +40% above average volume may trigger a technical buy signal. Due to report Jun '21 quarterly results. Volume and volatility often increase near earnings news. Quarterly and annual earnings (C and A criteria) history has been strong after a loss in FY '18
>>> FEATURED STOCK ARTICLE : Perched Not Far From High With Earnings News Due Pre-Open - 8/2/2021 |
View all notes |
Set NEW NOTE alert |
Company Profile |
SEC
News |
Chart |
Request a new note
C
A
S
I |