You are not logged in.
This means you
CAN ONLY VIEW reports that were published prior to Thursday, March 20, 2025.
You
MUST UPGRADE YOUR MEMBERSHIP if you want to see any current reports.
AFTER MARKET UPDATE - WEDNESDAY, JULY 28TH, 2021
Previous After Market Report Next After Market Report >>>
|
|
|
|
DOW |
-127.59 |
34,930.93 |
-0.36% |
|
Volume |
875,555,760 |
-1% |
|
Volume |
4,214,431,500 |
-1% |
|
NASDAQ |
+101.98 |
14,762.56 |
+0.70% |
|
Advancers |
2,005 |
62% |
|
Advancers |
3,120 |
72% |
|
S&P 500 |
-0.82 |
4,400.64 |
-0.02% |
|
Decliners |
1,226 |
38% |
|
Decliners |
1,194 |
28% |
|
Russell 2000 |
+33.12 |
2,224.96 |
+1.51% |
|
52 Wk Highs |
114 |
|
|
52 Wk Highs |
68 |
|
|
S&P 600 |
+10.68 |
1,329.40 |
+0.81% |
|
52 Wk Lows |
28 |
|
|
52 Wk Lows |
76 |
|
|
 |
Breadth Positive as Major Indices Ended Mixed
Kenneth J. Gruneisen - Passed the CAN SLIM® Master's Exam
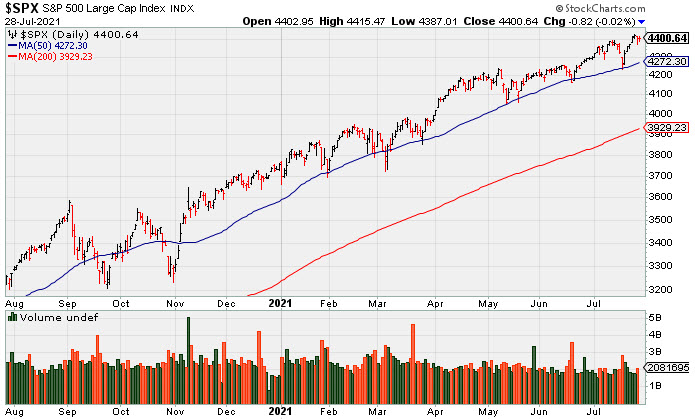
The Dow lost 127 points, while the S&P 500 closed just below the flat line. The Nasdaq Composite climbed 0.7%, rebounding after suffering its biggest one-day decline since mid-May on Tuesday. The volume totals reported were lighter than the prior session on the NYSE and on the Nasdaq exchange. Breadth was positive as advancers led decliners by almost a 5-3 margin on the NYSE and 5-2 on the Nasdaq exchange. There were 29 high-ranked companies from the Leaders List that hit new 52-week highs and were listed on the BreakOuts Page versus 18 on the prior session. New 52-week highs totals expanded and outnumbered new 52-week lows on the NYSE, however, new lows easily outnumbered new highs on the Nasdaq exchange. The major indices (M criteria) are in an uptrend that has come under pressure. Investors are reminded to always make buying and selling decisions on case-by-case basis under the strict criteria and rules of the fact-based investment system.
PICTURED: The S&P 500 Index is perched near its new record high.
U.S. stocks fluctuated on Wednesday as investors assessed the latest policy statement from the Federal Reserve and digested key corporate earnings results. The U.S. central bank held rates near zero and made no changes to their bond buying program, as widely expected. The policy statement acknowledged that the economy had made progress towards the Fed’s employment and inflation goals, and noted that officials will continue to monitor economic conditions in the coming months. During the post-meeting press conference, Fed Chair Jerome Powell indicated that the timing of tapering its asset purchases remained uncertain. Treasuries advanced, with the yield on the 10-year note down one basis point to 1.23%. In Washington, a bipartisan group of lawmakers reportedly reached an agreement on a broad infrastructure bill, with a procedural vote potentially being held this evening.
Seven of 11 S&P 500 sectors closed in negative territory. Energy bucked the downtrend as WTI crude rose following a larger-than-anticipated weekly drawdown in crude stockpiles. The Communication Services group also outperformed, with Google parent Alphabet (GOOGL +3.19%) following a 69% surge in advertising revenues compared to a year ago. In other earnings, Apple (AAPL -1.22%) after warning of slowing sales growth following a record-setting quarter. Microsoft (MSFT -0.11%) as investors weighed concerns about slowing growth in its cloud computing business. Elsewhere, Boeing (BA +4.18%) following its first profit since the third quarter of 2019. |
 Kenneth J. Gruneisen started out as a licensed stockbroker in August 1987, a couple of months prior to the historic stock market crash that took the Dow Jones Industrial Average down -22.6% in a single day. He has published daily fact-based fundamental and technical analysis on high-ranked stocks online for two decades. Through FACTBASEDINVESTING.COM, Kenneth provides educational articles, news, market commentary, and other information regarding proven investment systems that work in good times and bad.
Comments contained in the body of this report are technical opinions only and are not necessarily those of Gruneisen Growth Corp. The material herein has been obtained from sources believed to be reliable and accurate, however, its accuracy and completeness cannot be guaranteed. Our firm, employees, and customers may effect transactions, including transactions contrary to any recommendation herein, or have positions in the securities mentioned herein or options with respect thereto. Any recommendation contained in this report may not be suitable for all investors and it is not to be deemed an offer or solicitation on our part with respect to the purchase or sale of any securities. |
|
 |
Financial, Tech, and Commodity-Linked Groups Rose
Kenneth J. Gruneisen - Passed the CAN SLIM® Master's Exam
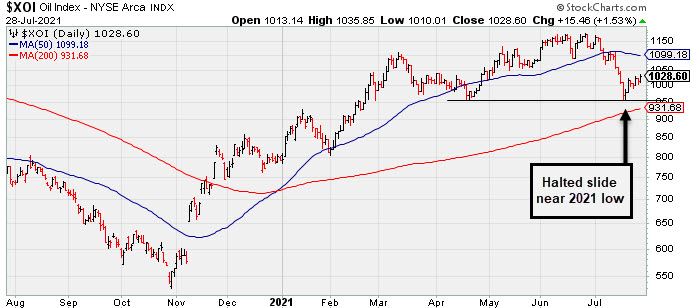
The Broker/Dealer Index ($XBD +1.04%) outpaced the Bank Index ($BKX +0.29%) while the Retail Index ($RLX -0.15%) ended slightly lower. The tech sector had a positive bias as the Biotech Index ($BTK +2.33%), Semiconductor Index ($SOX +1.76%), and Networking Index ($NWX +1.12%) each rose. Commodity-linked groups also had a positive bias as the Gold & Silver Index ($XAU +1.72%), Oil Services Index ($OSX +0.65%), and the Integrated Oil Index ($XOI +1.53%) posted unanimous gains.
PICTURED: The Integrated Oil Index ($XOI +1.53%) halted its slide above its 200-day moving average (DMA) line near the 2021 low.
| Oil Services |
$OSX |
56.40 |
+0.37 |
+0.65% |
+27.23% |
| Integrated Oil |
$XOI |
1,028.60 |
+15.46 |
+1.53% |
+29.80% |
| Semiconductor |
$SOX |
3,272.58 |
+56.61 |
+1.76% |
+17.07% |
| Networking |
$NWX |
850.79 |
+9.45 |
+1.12% |
+18.64% |
| Broker/Dealer |
$XBD |
461.57 |
+4.74 |
+1.04% |
+22.24% |
| Retail |
$RLX |
4,146.24 |
-6.32 |
-0.15% |
+16.36% |
| Gold & Silver |
$XAU |
140.47 |
+2.38 |
+1.72% |
-2.58% |
| Bank |
$BKX |
122.35 |
+0.35 |
+0.29% |
+24.96% |
| Biotech |
$BTK |
5,790.81 |
+131.78 |
+2.33% |
+0.90% |
|
|
|
 |
Paypal Perched at Record High
Kenneth J. Gruneisen - Passed the CAN SLIM® Master's Exam
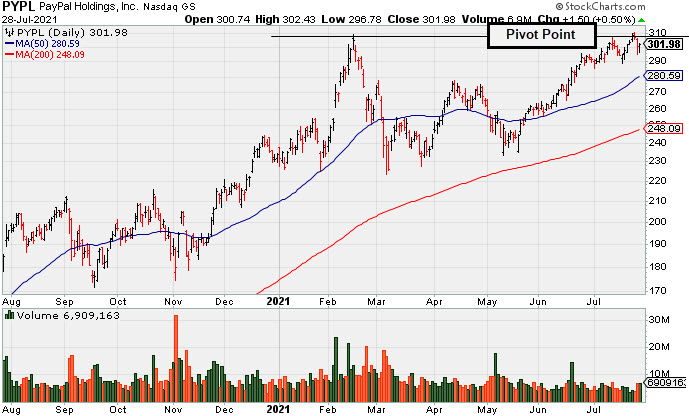
Paypal Holdings Inc (PYPL +$1.50 or +0.50% to $301.98) was highlighted in yellow in the 7/27/21 mid-day report (read here) with new pivot point cited based on its 7/13/21 high after a cup-with-handle base. It quietly wedged to a new all-time high. Subsequent gains above its pivot point backed by at least +40% above average volume may trigger a new buy signal. It reported Jun '21 quarterly results after the close. Volume and volatility often increase near earnings news.
PYPL reported Mar '21 quarterly earnings +85% on +31% sales revenues versus the year ago period, its 4th strong comparison above the +25% minimum guideline (C criteria). Annual earnings (A criteria) growth has been strong and steady.
It has a large supply 1.175 billion shares outstanding (S criteria). The high-ranked Finance - Credit Card/Payment Processing firm saw the number of top-rated funds owning its shares rise from 3,666 in Sep '20 to 4,260 in Jun '21, a reassuring sign concerning the I criteria. Its current Up/Down Volume Ratio of 1.5 is an unbiased indication its shares have been under accumulation over the past 50 days. It has a Timeliness Rating of A and Sponsorship Rating of B. |
|
|
Color Codes Explained :
Y - Better candidates highlighted by our
staff of experts.
G - Previously featured
in past reports as yellow but may no longer be buyable under the
guidelines.
***Last / Change / Volume data in this table is the closing quote data***
Symbol/Exchange
Company Name
Industry Group |
PRICE |
CHANGE
(%Change) |
Day High |
Volume
(% DAV)
(% 50 day avg vol) |
52 Wk Hi
% From Hi |
Featured
Date |
Price
Featured |
Pivot Featured |
|
Max Buy |
 SIVB
-
NASDAQ
SIVB
-
NASDAQ
S V B Financial Group
BANKING - Regional - Pacific Banks
|
$561.70
|
+7.38
1.33% |
$568.35
|
229,427
62.18% of 50 DAV
50 DAV is 369,000
|
$608.84
-7.74%
|
4/23/2021
|
$579.70
|
PP = $577.16
|
|
MB = $606.02
|
Most Recent Note - 7/27/2021 1:27:23 PM
G - Reported Jun '21 quarterly earnings +106% on +69% sales revenues versus the year ago period, continuing its strong earnings track record. Remains below its 50 DMA line ($568). A rebound above the 50 DMA line is needed for its outlook to improve.
>>> FEATURED STOCK ARTICLE : Consolidating Near 50-Day Average After Distributional Pressure - 6/25/2021 |
View all notes |
Set NEW NOTE alert |
Company Profile |
SEC
News |
Chart |
Request a new note
C
A
S
I |
LOGI
-
NASDAQ
Logitech Intl Sa
COMPUTER HARDWARE - Computer Peripherals
|
$108.05
|
-0.40
-0.37% |
$108.90
|
1,834,082
223.91% of 50 DAV
50 DAV is 819,100
|
$140.17
-22.92%
|
5/26/2021
|
$119.13
|
PP = $120.34
|
|
MB = $126.36
|
Most Recent Note - 7/27/2021 9:55:38 AM
G - Gapped down today after reporting Jun '21 quarterly earnings +91% on +66% sales revenues versus the year ago period. Volume and volatility often increase near earnings news. Met noted resistance when rebounding near its 50 DMA line. Its 200 DMA line ($105) defines the next important chart support.
>>> FEATURED STOCK ARTICLE : Recent Pullback is Testing Important Technical Support - 7/2/2021 |
View all notes |
Set NEW NOTE alert |
Company Profile |
SEC
News |
Chart |
Request a new note
C
A
S
I |
CROX
-
NASDAQ
Crocs Inc
CONSUMER NON-DURABLES - Textile - Apparel Footwear
|
$131.25
|
+2.56
1.99% |
$131.33
|
843,819
56.18% of 50 DAV
50 DAV is 1,502,000
|
$136.50
-3.85%
|
6/14/2021
|
$112.64
|
PP = $110.01
|
|
MB = $115.51
|
Most Recent Note - 7/27/2021 1:31:32 PM
G - Slumping today with light volume. Powered into new all-time high territory on 7/22/21 when last noted "getting extended from any sound base." Found support at its 50 DMA line ($110.87).
>>> FEATURED STOCK ARTICLE : Quietly Consolidating Below "Max Buy" Level - 7/7/2021 |
View all notes |
Set NEW NOTE alert |
Company Profile |
SEC
News |
Chart |
Request a new note
C
A
S
I |
CRL
-
NYSE
Charles River Labs Intl
DRUGS - Biotechnology
|
$399.62
|
+6.87
1.75% |
$401.90
|
230,278
54.31% of 50 DAV
50 DAV is 424,000
|
$397.61
0.51%
|
6/9/2021
|
$345.91
|
PP = $349.23
|
|
MB = $366.69
|
Most Recent Note - 7/26/2021 5:08:10 PM
G - Recent volume totals have been below average while wedging into record high territory. Its 50 DMA line ($358) and prior high in the $349 area define near-term support to watch on pullbacks. Two of the past 3 quarterly comparisons through Mar '21 have been above the +25% minimum earnings guideline (C criteria).
>>> FEATURED STOCK ARTICLE : Volume Totals Cooling While Perched at High - 7/13/2021 |
View all notes |
Set NEW NOTE alert |
Company Profile |
SEC
News |
Chart |
Request a new note
C
A
S
I |
GNRC
-
NYSE
Generac Hldgs Inc
Electrical-Power/Equipmt
|
$431.04
|
-7.88
-1.80% |
$438.00
|
2,887,140
387.02% of 50 DAV
50 DAV is 746,000
|
$457.00
-5.68%
|
6/8/2021
|
$348.46
|
PP = $342.38
|
|
MB = $359.50
|
 Most Recent Note - 7/28/2021 12:46:27 PM
G - Extended from any sound base, it abruptly pulled back from its all-time high and its earlier low tested support at its 50 DMA line ($383) before rebounding impressively. Reported Jun '21 quarterly earnings +71% on +68% sales revenues versus the year ago period. Volume and volatility often increase near earnings news. Fundamentals remain strong.
>>> FEATURED STOCK ARTICLE : Gain for New High Leaves GNRC Very Extended From Prior Base - 7/12/2021 |
View all notes |
Set NEW NOTE alert |
Company Profile |
SEC
News |
Chart |
Request a new note
C
A
S
I |
Symbol/Exchange
Company Name
Industry Group |
PRICE |
CHANGE
(%Change) |
Day High |
Volume
(% DAV)
(% 50 day avg vol) |
52 Wk Hi
% From Hi |
Featured
Date |
Price
Featured |
Pivot Featured |
|
Max Buy |
CAMT
-
NASDAQ
Camtek Ltd
ELECTRONICS - Scientific and Technical Instrum
|
$35.25
|
+1.47
4.35% |
$35.48
|
119,007
45.77% of 50 DAV
50 DAV is 260,000
|
$40.47
-12.90%
|
4/28/2021
|
$35.03
|
PP = $35.34
|
|
MB = $37.11
|
Most Recent Note - 7/28/2021 5:24:22 PM
G - Posted a gain today with light volume, rebounding near its 50 DMA line ($35.67). Subsequent gains above the 50 DMA line would help its outlook improve. Due to report Jun '21 quarterly results on 8/04/21.
>>> FEATURED STOCK ARTICLE : Loss With Light Volume Undercut 50-Day Moving Average - 7/8/2021 |
View all notes |
Set NEW NOTE alert |
Company Profile |
SEC
News |
Chart |
Request a new note
C
A
S
I |
PKI
-
NYSE
Perkinelmer Inc
ELECTRONICS - Scientific and Technical Instrum
|
$174.46
|
+4.30
2.53% |
$175.28
|
1,122,295
154.16% of 50 DAV
50 DAV is 728,000
|
$174.52
-0.03%
|
7/26/2021
|
$168.06
|
PP = $162.80
|
|
MB = $170.94
|
Most Recent Note - 7/27/2021 12:24:58 PM
Y - Finished strong on the prior session after highlighted in yellow in the mid-day report with pivot point cited based on its 1/11/21 high plus 10 cents . Hit a new all-time high with +186% above average volume behind its 8th consecutive gain triggering a technical buy signal. Reported earnings +80% on +51% sales revenues for the Jun '21 quarter versus the year ago period, its 6th strong quarterly comparison above the +25% minimum guideline (C criteria). Annual earnings (A criteria) history has improved steadily. See the latest FSU report for more detailed analysis and an annotated graph.
>>> FEATURED STOCK ARTICLE : Powerful Volume-Driven Breakout After Earnings Report - 7/26/2021 |
View all notes |
Set NEW NOTE alert |
Company Profile |
SEC
News |
Chart |
Request a new note
C
A
S
I |
ASML
-
NASDAQ
A S M L Holding N.V. NY
ELECTRONICS - Semiconductor Equipment and Mate
|
$759.86
|
+14.26
1.91% |
$761.04
|
710,633
97.08% of 50 DAV
50 DAV is 732,000
|
$759.00
0.11%
|
5/25/2021
|
$669.59
|
PP = $675.75
|
|
MB = $709.54
|
Most Recent Note - 7/27/2021 12:07:37 PM
G - Retreating today, it rallied well above its "max buy" level and hit new all-time highs with 5 consecutive volume-driven gains. Its 50 DMA line ($687) defines important near-term support to watch on pullbacks.
>>> FEATURED STOCK ARTICLE : Volume Higher While Pulling Back Toward 50-Day Moving Average - 7/1/2021 |
View all notes |
Set NEW NOTE alert |
Company Profile |
SEC
News |
Chart |
Request a new note
C
A
S
I |
LUNA
-
NASDAQ
Luna Innovations Inc
Medical-Research Eqp/Svc
|
$12.22
|
+0.80
7.01% |
$12.46
|
241,859
143.11% of 50 DAV
50 DAV is 169,000
|
$13.05
-6.36%
|
7/26/2021
|
$12.46
|
PP = $13.15
|
|
MB = $13.81
|
Most Recent Note - 7/28/2021 5:28:15 PM
Y - Posted another volume-driven gain today, adding to a spurt of gains marked by volume. Highlighted in yellow in the 7/26/21 mid-day report with pivot point cited based on its 3/12/21 high plus 10 cents. Rallied impressively from support at its 200 DMA line, nearly challenging its 52-week high. Subsequent gains above the pivot point backed by at least +40% above average volume may trigger a technical buy signal. Reported Mar '21 quarterly earnings +50% on +53% sales revenues versus the year ago period, its 4th strong quarterly comparison (C criteria). Annual earnings (A criteria) history has improved in recent years, helping it match with the fundamental guidelines of the fact-based investment system. See the latest FSU analysis for more details and an annotated graph.
>>> FEATURED STOCK ARTICLE : Pulled Back After Streak of Gains Challenging 52-Week High - 7/27/2021 |
View all notes |
Set NEW NOTE alert |
Company Profile |
SEC
News |
Chart |
Request a new note
C
A
S
I |
CLFD
-
NASDAQ
Clearfield Inc
TELECOMMUNICATIONS - Cables / Satalite Equipment
|
$42.35
|
+2.15
5.35% |
$42.76
|
134,771
107.82% of 50 DAV
50 DAV is 125,000
|
$45.36
-6.64%
|
7/23/2021
|
$40.23
|
PP = $43.74
|
|
MB = $45.93
|
Most Recent Note - 7/28/2021 5:26:13 PM
Y - There was a "negative reversal" on 7/26/21, encountering distributional pressure after its early gain into new high territory. Subsequent gains above the pivot point with volume may trigger a new (or add-on) technical buy signal. Fundamentals remain strong. Bullish action came after it reported Jun '21 quarterly earnings +100% on +49% sales revenues."
>>> FEATURED STOCK ARTICLE : Big Volume-Driven Gain Challenging Prior High After Earnings - 7/23/2021 |
View all notes |
Set NEW NOTE alert |
Company Profile |
SEC
News |
Chart |
Request a new note
C
A
S
I |
Symbol/Exchange
Company Name
Industry Group |
PRICE |
CHANGE
(%Change) |
Day High |
Volume
(% DAV)
(% 50 day avg vol) |
52 Wk Hi
% From Hi |
Featured
Date |
Price
Featured |
Pivot Featured |
|
Max Buy |
POOL
-
NASDAQ
Pool Corp
WHOLESALE - Basic Materials Wholesale
|
$467.63
|
-4.24
-0.90% |
$473.80
|
168,524
62.88% of 50 DAV
50 DAV is 268,000
|
$478.67
-2.31%
|
6/21/2021
|
$455.09
|
PP = $449.54
|
|
MB = $472.02
|
Most Recent Note - 7/26/2021 12:31:18 PM
Y - Posting a 2nd consecutive gain today challenging its high after finding support at its 50 DMA line ($448) last week. Reported Jun '21 quarterly earnings +66% on +40% sales revenues versus the year ago period. Recent losses have tested prior highs in the $449-444 range and its 50 DMA line which define important support. More damaging losses would raise concerns and trigger a technical sell signal.
>>> FEATURED STOCK ARTICLE : Churned Heavy Volume While Testing 50-Day Moving Average - 7/22/2021 |
View all notes |
Set NEW NOTE alert |
Company Profile |
SEC
News |
Chart |
Request a new note
C
A
S
I |
FSBW
-
NASDAQ
F S Bancorp
Banks-West/Southwest
|
$35.39
|
+0.61
1.75% |
$35.81
|
19,399
62.58% of 50 DAV
50 DAV is 31,000
|
$36.85
-3.96%
|
5/18/2021
|
$35.08
|
PP = $36.85
|
|
MB = $38.69
|
Most Recent Note - 7/27/2021 1:23:47 PM
Y - Consolidating near its 50 DMA line ($35.21). Reported Jun '21 quarterly earnings -16% on -11% sales revenues versus the year ago period raising fundamental concerns. Do not be confused by a 2:1 stock split which impacted share prices as of 7/15/21 (Featured Price, Pivot Point, and Max Buy levels were updated accordingly).
>>> FEATURED STOCK ARTICLE : Still Consolidating With Close Striking Distance of All-Time High - 6/24/2021 |
View all notes |
Set NEW NOTE alert |
Company Profile |
SEC
News |
Chart |
Request a new note
C
A
S
I |
SMPL
-
NASDAQ
Simply Good Foods Co
Food-Confectionery
|
$37.31
|
+0.26
0.70% |
$37.56
|
171,990
32.64% of 50 DAV
50 DAV is 527,000
|
$38.50
-3.09%
|
12/28/2020
|
$30.40
|
PP = $31.44
|
|
MB = $33.01
|
Most Recent Note - 7/27/2021 1:28:28 PM
G - Still holding its ground near its all-time high with volume totals cooling. Its 50 DMA line ($35.77) and prior highs in the $35 area define important near-term support to watch on pullbacks. Reported May '21 quarterly earnings +65% on +32% sales revenues versus the year ago period, well above the +25% minimum earnings guideline (C criteria).
>>> FEATURED STOCK ARTICLE : Pulled Back from High With Small Losses on Light Volume - 7/15/2021 |
View all notes |
Set NEW NOTE alert |
Company Profile |
SEC
News |
Chart |
Request a new note
C
A
S
I |
PYPL
-
NASDAQ
Paypal Holdings Inc
Finance-CrdtCard/PmtPr
|
$301.98
|
+1.50
0.50% |
$302.43
|
7,657,332
133.73% of 50 DAV
50 DAV is 5,726,000
|
$310.16
-2.64%
|
7/27/2021
|
$296.69
|
PP = $307.82
|
|
MB = $323.21
|
Most Recent Note - 7/28/2021 5:22:40 PM
Y - Reported Jun '21 quarterly results after the close. Volume and volatility often increase near earnings news. It was highlighted in yellow in the 7/27/21 mid-day report with new pivot point cited based on its 7/13/21 high after a cup-with-handle base. Subsequent gains above its pivot point backed by at least +40% above average volume may trigger a new buy signal. Reported Mar '21 quarterly earnings +85% on +31% sales revenues versus the year ago period, its 4th strong comparison above the +25% minimum guideline (C criteria). Annual earnings (A criteria) growth has been strong and steady. See the latest FSU analysis for more details and a new annotated graph.
>>> FEATURED STOCK ARTICLE : Perched Near Record High Ahead of Earnings News - 7/23/2019 |
View all notes |
Set NEW NOTE alert |
Company Profile |
SEC
News |
Chart |
Request a new note
C
A
S
I |
SHOP
-
NYSE
Shopify Inc Cl A
Computer Sftwr-Enterprse
|
$1,538.00
|
-17.10
-1.10% |
$1,583.15
|
2,178,752
154.30% of 50 DAV
50 DAV is 1,412,000
|
$1,650.00
-6.79%
|
7/2/2021
|
$1,468.00
|
PP = $1,552.23
|
|
MB = $1,629.84
|
Most Recent Note - 7/28/2021 12:57:31 PM
Y - Color code was changed to yellow after pulling back below its "max buy" level. Its recent low and 50 DMA line ($1391) define near term support to watch. Reported Jun '21 quarterly earnings +113% on +57% sales revenues versus the year ago period.
>>> FEATURED STOCK ARTICLE : Managed a Positive Reversal After Early Weakness - 7/19/2021 |
View all notes |
Set NEW NOTE alert |
Company Profile |
SEC
News |
Chart |
Request a new note
C
A
S
I |
Symbol/Exchange
Company Name
Industry Group |
PRICE |
CHANGE
(%Change) |
Day High |
Volume
(% DAV)
(% 50 day avg vol) |
52 Wk Hi
% From Hi |
Featured
Date |
Price
Featured |
Pivot Featured |
|
Max Buy |
YETI
-
NYSE
Yeti Holdings Inc
Leisure-Products
|
$96.48
|
+0.46
0.48% |
$97.18
|
438,671
34.84% of 50 DAV
50 DAV is 1,259,000
|
$98.79
-2.34%
|
5/13/2021
|
$84.20
|
PP = $90.65
|
|
MB = $95.18
|
Most Recent Note - 7/27/2021 4:08:24 PM
G - Holding its ground above its "max buy" level with volume totals cooling. Its 50 DMA line ($90.44) and recent low define important near-term support where more damaging losses would raise greater concerns. Fundamentals remain strong.
>>> FEATURED STOCK ARTICLE : Volume Totals Cooling While Consolidating Near High - 7/9/2021 |
View all notes |
Set NEW NOTE alert |
Company Profile |
SEC
News |
Chart |
Request a new note
C
A
S
I |
DOCU
-
NASDAQ
Docusign Inc
Computer Sftwr-Enterprse
|
$304.82
|
+2.78
0.92% |
$307.37
|
1,089,863
36.63% of 50 DAV
50 DAV is 2,975,000
|
$310.51
-1.83%
|
7/6/2021
|
$288.96
|
PP = $290.33
|
|
MB = $304.85
|
Most Recent Note - 7/27/2021 1:21:37 PM
Y - Quietly pulling back from its all-time high after wedging into new high territory with recent gains lacking great volume conviction. Prior low ($270.41 on 7/15/21) defines initial support above its 50 DMA line.
>>> FEATURED STOCK ARTICLE : Touched New High With Average Volume Behind Today's Gain - 7/6/2021 |
View all notes |
Set NEW NOTE alert |
Company Profile |
SEC
News |
Chart |
Request a new note
C
A
S
I |
XPEL
-
NASDAQ
Xpel Inc
Auto/Truck-Tires andamp; Misc
|
$87.61
|
+2.02
2.36% |
$87.93
|
248,924
110.63% of 50 DAV
50 DAV is 225,000
|
$103.84
-15.63%
|
7/21/2021
|
$92.25
|
PP = $94.31
|
|
MB = $99.03
|
Most Recent Note - 7/27/2021 1:35:21 PM
G - Color code is changed to green with today's big volume-driven loss after abruptly reversing from its all-time high raising concerns. Fell below its 50 DMA line ($85.71) and back into the prior base noted as a riskier "late-stage" base. Reported Mar '21 quarterly earnings +317% on +83% sales revenues versus the year ago period, adding to its strong earnings track record.
>>> FEATURED STOCK ARTICLE : New Base Formed May Be "Late Stage" - 7/21/2021 |
View all notes |
Set NEW NOTE alert |
Company Profile |
SEC
News |
Chart |
Request a new note
C
A
S
I |
JEF
-
NYSE
Jefferies Financial Grp
Finance-Invest Bnk/Bkrs
|
$32.95
|
+0.11
0.33% |
$33.14
|
731,342
34.84% of 50 DAV
50 DAV is 2,099,000
|
$35.69
-7.68%
|
6/28/2021
|
$31.81
|
PP = $34.42
|
|
MB = $36.14
|
Most Recent Note - 7/26/2021 5:09:22 PM
Y - Found support when recently testing its 50 DMA line ($32.13). More damaging losses would raise concerns and trigger a technical sell signal. As previously noted - "Subsequent gains above the pivot point backed by at least +40% above average volume are necessary to trigger a technical buy signal."
>>> FEATURED STOCK ARTICLE : High-Ranked Financial Firm Formed "Double Bottom" Base - 6/28/2021 |
View all notes |
Set NEW NOTE alert |
Company Profile |
SEC
News |
Chart |
Request a new note
C
A
S
I |
CLAR
-
NASDAQ
Clarus Corporation
Leisure-Products
|
$28.28
|
-0.06
-0.21% |
$28.64
|
130,023
58.57% of 50 DAV
50 DAV is 222,000
|
$28.86
-2.01%
|
5/12/2021
|
$21.40
|
PP = $19.73
|
|
MB = $20.72
|
Most Recent Note - 7/27/2021 1:18:01 PM
G - Hovering near its 52-week high with volume totals cooling, extended from any sound base of sufficient length. Its 50 DMA line ($25.24) defines important near-term support to watch.
>>> FEATURED STOCK ARTICLE : Extended From Prior Base and Hitting Another New High - 7/20/2021 |
View all notes |
Set NEW NOTE alert |
Company Profile |
SEC
News |
Chart |
Request a new note
C
A
S
I |
Symbol/Exchange
Company Name
Industry Group |
PRICE |
CHANGE
(%Change) |
Day High |
Volume
(% DAV)
(% 50 day avg vol) |
52 Wk Hi
% From Hi |
Featured
Date |
Price
Featured |
Pivot Featured |
|
Max Buy |
AVTR
-
NYSE
Avantor Inc
Medical-Research Eqp/Svc
|
$37.48
|
+0.52
1.41% |
$37.60
|
4,088,694
111.02% of 50 DAV
50 DAV is 3,683,000
|
$37.50
-0.05%
|
6/10/2021
|
$32.94
|
PP = $34.09
|
|
MB = $35.79
|
Most Recent Note - 7/27/2021 1:08:20 PM
G - Volume totals have been cooling while stubbornly holding ground near its all-time high. Due to release its financial results for the second quarter 2021 after the market closes on Thursday, July 29, 2021. Volume and volatility often increase near earnings news. Its 50 DMA line coincides with the prior high in the $34 area defining important support to watch on pullbacks.
>>> FEATURED STOCK ARTICLE : Held Ground But Made Little Price Progress Since Featured - 7/14/2021 |
View all notes |
Set NEW NOTE alert |
Company Profile |
SEC
News |
Chart |
Request a new note
C
A
S
I |
|
|
|
THESE ARE NOT BUY RECOMMENDATIONS!
Comments contained in the body of this report are technical
opinions only. The material herein has been obtained
from sources believed to be reliable and accurate, however,
its accuracy and completeness cannot be guaranteed.
This site is not an investment advisor, hence it does
not endorse or recommend any securities or other investments.
Any recommendation contained in this report may not
be suitable for all investors and it is not to be deemed
an offer or solicitation on our part with respect to
the purchase or sale of any securities. All trademarks,
service marks and trade names appearing in this report
are the property of their respective owners, and are
likewise used for identification purposes only.
This report is a service available
only to active Paid Premium Members.
You may opt-out of receiving report notifications
at any time. Questions or comments may be submitted
by writing to Premium Membership Services 665 S.E. 10 Street, Suite 201 Deerfield Beach, FL 33441-5634 or by calling 1-800-965-8307
or 954-785-1121.
|
|
|