You are not logged in.
This means you
CAN ONLY VIEW reports that were published prior to Thursday, March 20, 2025.
You
MUST UPGRADE YOUR MEMBERSHIP if you want to see any current reports.
AFTER MARKET UPDATE - TUESDAY, AUGUST 3RD, 2021
Previous After Market Report Next After Market Report >>>
|
|
|
|
DOW |
+278.24 |
35,116.40 |
+0.80% |
|
Volume |
918,250,094 |
+10% |
|
Volume |
4,083,266,500 |
+10% |
|
NASDAQ |
+77.48 |
14,758.55 |
+0.53% |
|
Advancers |
1,961 |
61% |
|
Advancers |
2,059 |
49% |
|
S&P 500 |
+35.99 |
4,423.15 |
+0.82% |
|
Decliners |
1,276 |
39% |
|
Decliners |
2,184 |
51% |
|
Russell 2000 |
+8.08 |
2,223.58 |
+0.36% |
|
52 Wk Highs |
165 |
|
|
52 Wk Highs |
136 |
|
|
S&P 600 |
+10.22 |
1,345.17 |
+0.77% |
|
52 Wk Lows |
33 |
|
|
52 Wk Lows |
128 |
|
|
 |
Major Indices Rose With Mostly Good Earnings News
Kenneth J. Gruneisen - Passed the CAN SLIM® Master's Exam
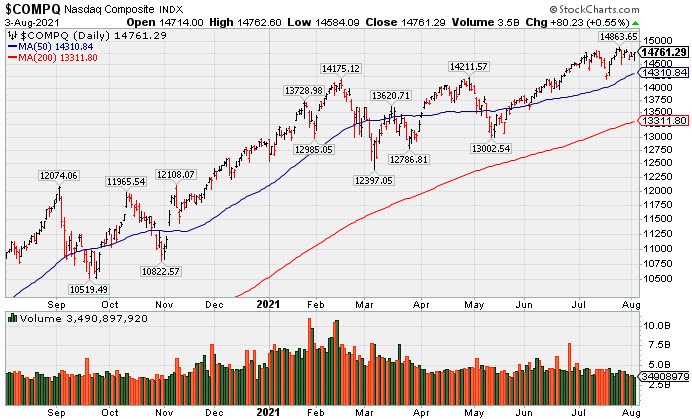
The Dow climbed 278 points, erasing an earlier drop of over 100 points and ending within striking distance of a new record level. The S&P 500 gained 0.8%, closing at a fresh all-time high, while the Nasdaq Composite was up 0.6%. The volume totals reported were lighter than the prior session on the NYSE and on the Nasdaq exchange. Advancers led decliners by a 3-2 margin on the NYSE while decliners narrowly outnumbered advancers on the Nasdaq exchange. There were 52 high-ranked companies from the Leaders List that hit new 52-week highs and were listed on the BreakOuts Page versus 73 on the prior session. New 52-week highs totals contracted yet still outnumbered new 52-week lows totals on the NYSE and on the Nasdaq exchange. The major indices (M criteria) are in an uptrend that has come under pressure. Investors are reminded to always make buying and selling decisions on case-by-case basis under the strict criteria and rules of the fact-based investment system.
PICTURED: The Nasdaq Composite Index is hovering near its all-time high.
U.S. stocks finished higher on Tuesday as generally strong corporate earnings results seemed to overshadow lingering worries surrounding the COVID-19 Delta variant. Overseas, concerns that China would continue to tighten its regulatory controls on tech-related companies resurfaced after a state-owned Chinese newspaper criticized the online gaming industry.
Ten of 11 S&P 500 sectors closed in positive territory, with Communication Services the sole declining group. In earnings, Under Armour (UAA +7.58%) and Ralph Lauren (RL +6.24%) both rallied following boosts to their respective full-year outlooks. Take-Two Interactive (TTWO -7.71%) was pressured by tepid guidance despite a top and bottom line beat. Meanwhile, Clorox (CLX -9.46%) fell after its profit and sales fell short of Wall Street estimates. In Real Estate, Simon Property Group (SPG +2.55%) rose after the mall operator noted that retail sales at some of its shopping centers and outlets recovered to pre-pandemic levels. Elsewhere, BP (BP +6.69%) after increasing its dividend and share buyback program. In the M&A space, shares of NVIDIA (NVDA +0.33%) edged higher despite reports of the U.K. potentially blocking the chipmaker’s $40 billion deal to buy Arm Ltd.
Treasuries ended little changed, with the yield on the 10-year note holding steady at 1.17%. On the data front, factory orders rose a better-than-expected 1.5% in June. In commodities, WTI crude slipped 0.9% to $70.64/barrel. |
 Kenneth J. Gruneisen started out as a licensed stockbroker in August 1987, a couple of months prior to the historic stock market crash that took the Dow Jones Industrial Average down -22.6% in a single day. He has published daily fact-based fundamental and technical analysis on high-ranked stocks online for two decades. Through FACTBASEDINVESTING.COM, Kenneth provides educational articles, news, market commentary, and other information regarding proven investment systems that work in good times and bad.
Comments contained in the body of this report are technical opinions only and are not necessarily those of Gruneisen Growth Corp. The material herein has been obtained from sources believed to be reliable and accurate, however, its accuracy and completeness cannot be guaranteed. Our firm, employees, and customers may effect transactions, including transactions contrary to any recommendation herein, or have positions in the securities mentioned herein or options with respect thereto. Any recommendation contained in this report may not be suitable for all investors and it is not to be deemed an offer or solicitation on our part with respect to the purchase or sale of any securities. |
|
 |
Retail, Bank, Tech, and Commodity-Linked Groups Rose
Kenneth J. Gruneisen - Passed the CAN SLIM® Master's Exam
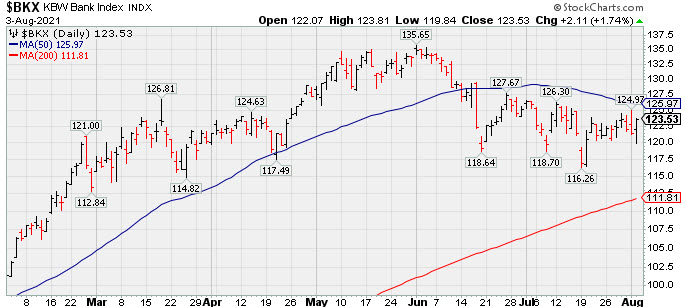
The Retail Index ($RLX +1.27%) and Bank Index ($BKX +1.74%) both had a positive influence on the major indices while the Broker/Dealer Index ($XBD -0.02%) finished flat. The Networking Index ($NWX +1.48%), Biotech Index ($BTK +1.15%), and Semiconductor Index ($SOX +0.56%) posted unanimous gains. Commodity-linked groups had a positive bias as the Oil Services Index ($OSX +0.69%), Integrated Oil Index ($XOI +2.60%), and Gold & Silver Index ($XAU +0.94%) rose.
PICTURED: The Bank Index ($BKX +1.74%) found support in recent weeks after undercutting its April low and rebounded but met resistance near its 50-day moving average (DMA) line.
| Oil Services |
$OSX |
55.18 |
+0.38 |
+0.69% |
+24.48% |
| Integrated Oil |
$XOI |
1,035.57 |
+26.24 |
+2.60% |
+30.67% |
| Semiconductor |
$SOX |
3,396.57 |
+19.08 |
+0.56% |
+21.50% |
| Networking |
$NWX |
871.39 |
+12.70 |
+1.48% |
+21.51% |
| Broker/Dealer |
$XBD |
463.86 |
-0.11 |
-0.02% |
+22.84% |
| Retail |
$RLX |
3,997.09 |
+50.30 |
+1.27% |
+12.18% |
| Gold & Silver |
$XAU |
143.47 |
+1.34 |
+0.94% |
-0.50% |
| Bank |
$BKX |
123.53 |
+2.11 |
+1.74% |
+26.16% |
| Biotech |
$BTK |
5,849.06 |
+66.27 |
+1.15% |
+1.92% |
|
|
|
 |
Pullback Following Big Gain on Strong Earnings and M&A News
Kenneth J. Gruneisen - Passed the CAN SLIM® Master's Exam
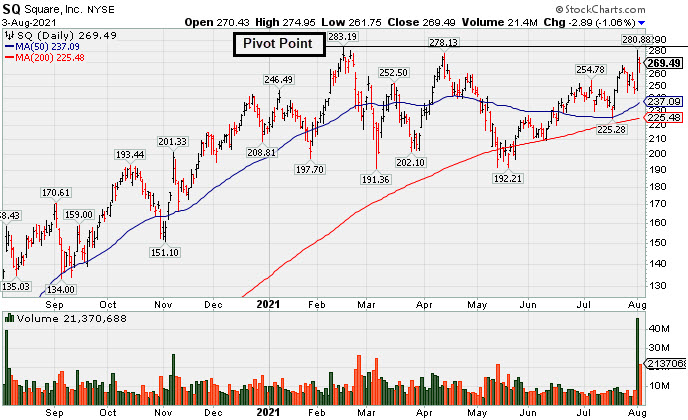
Square Inc Cl A (SQ -$2.89 or -1.06% to $269.49) pulled back today after a big volume-driven gain on the prior session challenging its all-time high. Little resistance remains due to overhead supply. Subsequent volume-driven gains above the pivot point may trigger a technical buy signal. SQ was highlighted in yellow with pivot point cited based on its high plus 10 cents in the 8/02/21 mid-day report (read here).
Bullish action came following M&A news it will acquire Afterpay as it also reported Jun '21 quarterly earnings +267% on +143% sales revenues versus the year ago period. That marked its 4th strong comparison well above the +25% minimum guideline (C criteria). Its annual earnings (A criteria) history has been strong, and it has the highest possible Earnings Per Share Rating of 99.
The number of top-rated funds owning its shares rose from 1,542 in Sep '20 to 1,922 in Jun '21, a reassuring sign concerning the I criteria. Its current Up/Down Volume Ratio of 1.5 is also an unbiased indication its shares have been under accumulation over the past 50 days. It has a Timeliness Rating of A and Sponsorship Rating of A. SQ completed its $9 IPO in Nov '15.
|
|
|
Color Codes Explained :
Y - Better candidates highlighted by our
staff of experts.
G - Previously featured
in past reports as yellow but may no longer be buyable under the
guidelines.
***Last / Change / Volume data in this table is the closing quote data***
Symbol/Exchange
Company Name
Industry Group |
PRICE |
CHANGE
(%Change) |
Day High |
Volume
(% DAV)
(% 50 day avg vol) |
52 Wk Hi
% From Hi |
Featured
Date |
Price
Featured |
Pivot Featured |
|
Max Buy |
 SIVB
-
NASDAQ
SIVB
-
NASDAQ
S V B Financial Group
BANKING - Regional - Pacific Banks
|
$548.45
|
+4.27
0.78% |
$549.47
|
223,740
61.13% of 50 DAV
50 DAV is 366,000
|
$608.84
-9.92%
|
4/23/2021
|
$579.70
|
PP = $577.16
|
|
MB = $606.02
|
Most Recent Note - 7/30/2021 5:49:30 PM
G - Ended with a loss today with higher (near average) volume, still sputtering below its 50 DMA line ($567.53). A rebound above the 50 DMA line is needed for its outlook to improve. Reported Jun '21 quarterly earnings +106% on +69% sales revenues versus the year ago period, continuing its strong earnings track record.
>>> FEATURED STOCK ARTICLE : Consolidating Near 50-Day Average After Distributional Pressure - 6/25/2021 |
View all notes |
Set NEW NOTE alert |
Company Profile |
SEC
News |
Chart |
Request a new note
C
A
S
I |
LOGI
-
NASDAQ
Logitech Intl Sa
COMPUTER HARDWARE - Computer Peripherals
|
$108.72
|
+0.56
0.52% |
$109.30
|
726,482
83.30% of 50 DAV
50 DAV is 872,100
|
$140.17
-22.44%
|
5/26/2021
|
$119.13
|
PP = $120.34
|
|
MB = $126.36
|
 Most Recent Note - 8/3/2021 5:51:18 PM
Still holding its ground above its 200 DMA line ($105.84) since a damaging gap down on 7/27/21. Weak action came after it reported Jun '21 quarterly earnings +91% on +66% sales revenues versus the year ago period. Its Relative Strength Rating has slumped to 54, well below the 80+ minimum guideline for buy candidates. A rebound above its 50 DMA line ($122) is needed for its outlook to improve. It will be dropped from the Featured Stocks list tonight.
>>> FEATURED STOCK ARTICLE : Recent Pullback is Testing Important Technical Support - 7/2/2021 |
View all notes |
Set NEW NOTE alert |
Company Profile |
SEC
News |
Chart |
Request a new note
C
A
S
I |
CROX
-
NASDAQ
Crocs Inc
CONSUMER NON-DURABLES - Textile - Apparel Footwear
|
$137.09
|
+0.45
0.33% |
$138.87
|
687,490
45.26% of 50 DAV
50 DAV is 1,519,000
|
$140.99
-2.77%
|
6/14/2021
|
$112.64
|
PP = $110.01
|
|
MB = $115.51
|
Most Recent Note - 7/29/2021 5:27:51 PM
G - Powered into new all-time high territory with a solid gain today, getting more extended from any sound base. Found support at its 50 DMA line ($112).
>>> FEATURED STOCK ARTICLE : Quietly Consolidating Below "Max Buy" Level - 7/7/2021 |
View all notes |
Set NEW NOTE alert |
Company Profile |
SEC
News |
Chart |
Request a new note
C
A
S
I |
CRL
-
NYSE
Charles River Labs Intl
DRUGS - Biotechnology
|
$411.24
|
+5.64
1.39% |
$412.05
|
341,349
83.05% of 50 DAV
50 DAV is 411,000
|
$410.52
0.18%
|
6/9/2021
|
$345.91
|
PP = $349.23
|
|
MB = $366.69
|
Most Recent Note - 8/2/2021 5:27:57 PM
G - Extended from any sound base and perched at its all-time high. Recent volume totals have been lackluster while wedging into record high territory. Its 50 DMA line ($365) and prior high in the $349 area define near-term support to watch on pullbacks. Two of the past 3 quarterly comparisons through Mar '21 have been above the +25% minimum earnings guideline (C criteria).
>>> FEATURED STOCK ARTICLE : Volume Totals Cooling While Perched at High - 7/13/2021 |
View all notes |
Set NEW NOTE alert |
Company Profile |
SEC
News |
Chart |
Request a new note
C
A
S
I |
GNRC
-
NYSE
Generac Hldgs Inc
Electrical-Power/Equipmt
|
$402.09
|
+2.09
0.52% |
$410.78
|
930,290
112.90% of 50 DAV
50 DAV is 824,000
|
$457.00
-12.02%
|
6/8/2021
|
$348.46
|
PP = $342.38
|
|
MB = $359.50
|
Most Recent Note - 8/2/2021 5:42:00 PM
G - Suffered another damaging volume-driven loss today, slumping toward its 50 DMA line ($390) which defines important near-term support to watch. Reported Jun '21 quarterly earnings +71% on +68% sales revenues versus the year ago period. Fundamentals remain strong.
>>> FEATURED STOCK ARTICLE : Gain for New High Leaves GNRC Very Extended From Prior Base - 7/12/2021 |
View all notes |
Set NEW NOTE alert |
Company Profile |
SEC
News |
Chart |
Request a new note
C
A
S
I |
Symbol/Exchange
Company Name
Industry Group |
PRICE |
CHANGE
(%Change) |
Day High |
Volume
(% DAV)
(% 50 day avg vol) |
52 Wk Hi
% From Hi |
Featured
Date |
Price
Featured |
Pivot Featured |
|
Max Buy |
CAMT
-
NASDAQ
Camtek Ltd
ELECTRONICS - Scientific and Technical Instrum
|
$37.50
|
+0.33
0.89% |
$37.75
|
182,338
72.36% of 50 DAV
50 DAV is 252,000
|
$40.47
-7.34%
|
4/28/2021
|
$35.03
|
PP = $35.34
|
|
MB = $37.11
|
Most Recent Note - 7/29/2021 5:24:02 PM
Y - Color code is changed to yellow after it posted a solid gain today with below average volume, rebounding well above the 50 DMA line ($35.87) helping its outlook improve. Due to report Jun '21 quarterly results on 8/04/21.
>>> FEATURED STOCK ARTICLE : Loss With Light Volume Undercut 50-Day Moving Average - 7/8/2021 |
View all notes |
Set NEW NOTE alert |
Company Profile |
SEC
News |
Chart |
Request a new note
C
A
S
I |
PKI
-
NYSE
Perkinelmer Inc
ELECTRONICS - Scientific and Technical Instrum
|
$185.07
|
+1.23
0.67% |
$187.14
|
1,079,741
141.33% of 50 DAV
50 DAV is 764,000
|
$185.68
-0.33%
|
7/26/2021
|
$168.06
|
PP = $162.80
|
|
MB = $170.94
|
Most Recent Note - 7/29/2021 12:48:04 PM
G - Rallied above its "max buy" level hitting another new all-time high today and its color code is changed to green. Bullish action came after it reported earnings +80% on +51% sales revenues for the Jun '21 quarter versus the year ago period. Prior high ($162) defines initial support to watch on pullbacks.
>>> FEATURED STOCK ARTICLE : Powerful Volume-Driven Breakout After Earnings Report - 7/26/2021 |
View all notes |
Set NEW NOTE alert |
Company Profile |
SEC
News |
Chart |
Request a new note
C
A
S
I |
ASML
-
NASDAQ
A S M L Holding N.V. NY
ELECTRONICS - Semiconductor Equipment and Mate
|
$779.53
|
+9.88
1.28% |
$780.45
|
532,159
75.48% of 50 DAV
50 DAV is 705,000
|
$775.84
0.48%
|
5/25/2021
|
$669.59
|
PP = $675.75
|
|
MB = $709.54
|
Most Recent Note - 8/3/2021 5:43:55 PM
G - Hit another new all-time high with lighter volume behind today's 10th gain in the span of 11 sessions. Its 50 DMA line ($700) defines important near-term support to watch on pullbacks.
>>> FEATURED STOCK ARTICLE : Volume Higher While Pulling Back Toward 50-Day Moving Average - 7/1/2021 |
View all notes |
Set NEW NOTE alert |
Company Profile |
SEC
News |
Chart |
Request a new note
C
A
S
I |
LUNA
-
NASDAQ
Luna Innovations Inc
Medical-Research Eqp/Svc
|
$12.44
|
+0.10
0.81% |
$12.73
|
108,632
71.47% of 50 DAV
50 DAV is 152,000
|
$13.05
-4.67%
|
7/26/2021
|
$12.46
|
PP = $13.15
|
|
MB = $13.81
|
Most Recent Note - 8/3/2021 5:53:28 PM
Y - On lighter than average volume today it posted a 10th gain in the span of 11 sessions. Highlighted in yellow in the 7/26/21 mid-day report with pivot point cited based on its 3/12/21 high plus 10 cents. Rallied impressively from support at its 200 DMA line, nearly challenging its 52-week high. Subsequent gains above the pivot point backed by at least +40% above average volume may trigger a technical buy signal. Reported Mar '21 quarterly earnings +50% on +53% sales revenues versus the year ago period, its 4th strong quarterly comparison (C criteria). Annual earnings (A criteria) history has improved in recent years, helping it match with the fundamental guidelines of the fact-based investment system.
>>> FEATURED STOCK ARTICLE : Pulled Back After Streak of Gains Challenging 52-Week High - 7/27/2021 |
View all notes |
Set NEW NOTE alert |
Company Profile |
SEC
News |
Chart |
Request a new note
C
A
S
I |
CLFD
-
NASDAQ
Clearfield Inc
TELECOMMUNICATIONS - Cables / Satalite Equipment
|
$43.48
|
+0.50
1.16% |
$43.85
|
63,308
49.08% of 50 DAV
50 DAV is 129,000
|
$45.36
-4.14%
|
7/23/2021
|
$40.23
|
PP = $43.74
|
|
MB = $45.93
|
Most Recent Note - 7/29/2021 5:25:46 PM
Y - Posted a solid gain today with +53% above average volume for a best ever close. The big gain and close above the pivot point with volume triggered a new (or add-on) technical buy signal. Fundamentals remain strong. Bullish action came after it reported Jun '21 quarterly earnings +100% on +49% sales revenues."
>>> FEATURED STOCK ARTICLE : Big Volume-Driven Gain Challenging Prior High After Earnings - 7/23/2021 |
View all notes |
Set NEW NOTE alert |
Company Profile |
SEC
News |
Chart |
Request a new note
C
A
S
I |
Symbol/Exchange
Company Name
Industry Group |
PRICE |
CHANGE
(%Change) |
Day High |
Volume
(% DAV)
(% 50 day avg vol) |
52 Wk Hi
% From Hi |
Featured
Date |
Price
Featured |
Pivot Featured |
|
Max Buy |
POOL
-
NASDAQ
Pool Corp
WHOLESALE - Basic Materials Wholesale
|
$480.44
|
+3.93
0.82% |
$485.61
|
183,365
69.25% of 50 DAV
50 DAV is 264,800
|
$484.42
-0.82%
|
6/21/2021
|
$455.09
|
PP = $449.54
|
|
MB = $472.02
|
Most Recent Note - 7/29/2021 5:32:33 PM
G - Posted a gain today with light volume for a new all-time high above its "max buy" level and its color code is changed to green. Found support at its 50 DMA line ($450) last week. Reported Jun '21 quarterly earnings +66% on +40% sales revenues versus the year ago period. Recent losses have tested prior highs in the $449-444 range and its 50 DMA line which define important support. More damaging losses would raise concerns and trigger a technical sell signal.
>>> FEATURED STOCK ARTICLE : Churned Heavy Volume While Testing 50-Day Moving Average - 7/22/2021 |
View all notes |
Set NEW NOTE alert |
Company Profile |
SEC
News |
Chart |
Request a new note
C
A
S
I |
FSBW
-
NASDAQ
F S Bancorp
Banks-West/Southwest
|
$34.90
|
+0.05
0.14% |
$35.27
|
12,494
43.08% of 50 DAV
50 DAV is 29,000
|
$36.85
-5.29%
|
5/18/2021
|
$35.08
|
PP = $36.85
|
|
MB = $38.69
|
Most Recent Note - 7/29/2021 5:33:05 PM
G - Color code is changed to green while consolidating near its 50 DMA line ($35.21). Recently reported Jun '21 quarterly earnings -16% on -11% sales revenues versus the year ago period raising fundamental concerns. Do not be confused by a 2:1 stock split which impacted share prices as of 7/15/21 (Featured Price, Pivot Point, and Max Buy levels were updated accordingly). See the latest FSU analysis for more details and a new annotated graph.
>>> FEATURED STOCK ARTICLE : Latest Earnings Report Broke Streak of Strong Increases - 7/29/2021 |
View all notes |
Set NEW NOTE alert |
Company Profile |
SEC
News |
Chart |
Request a new note
C
A
S
I |
SMPL
-
NASDAQ
Simply Good Foods Co
Food-Confectionery
|
$36.88
|
-0.08
-0.22% |
$37.11
|
352,762
73.34% of 50 DAV
50 DAV is 481,000
|
$38.50
-4.21%
|
12/28/2020
|
$30.40
|
PP = $31.44
|
|
MB = $33.01
|
Most Recent Note - 8/2/2021 5:35:22 PM
G - Still hovering near its all-time high with volume totals cooling in recent weeks. Its 50 DMA line ($36.07) and prior highs in the $35 area define important near-term support to watch on pullbacks. Reported May '21 quarterly earnings +65% on +32% sales revenues versus the year ago period, well above the +25% minimum earnings guideline (C criteria).
>>> FEATURED STOCK ARTICLE : Pulled Back from High With Small Losses on Light Volume - 7/15/2021 |
View all notes |
Set NEW NOTE alert |
Company Profile |
SEC
News |
Chart |
Request a new note
C
A
S
I |
PYPL
-
NASDAQ
"PayPal Holdings, Inc"
Finance-CrdtCard/PmtPr
|
$273.50
|
+2.51
0.93% |
$274.54
|
8,287,100
133.43% of 50 DAV
50 DAV is 6,211,000
|
$310.16
-11.82%
|
7/27/2021
|
$296.69
|
PP = $307.82
|
|
MB = $323.21
|
Most Recent Note - 7/30/2021 12:47:06 PM
G - Slumping below its 50 DMA line ($282) with today's loss raising greater concerns. Color code was changed to green following a gap down on the prior session after it reported Jun '21 quarterly earnings +7% on +19% sales revenues versus the year ago period, below the +25% minimum earnings guideline (C criteria), raising fundamental concerns. Volume and volatility often increase near earnings news.
>>> FEATURED STOCK ARTICLE : Paypal Perched at Record High - 7/28/2021 |
View all notes |
Set NEW NOTE alert |
Company Profile |
SEC
News |
Chart |
Request a new note
C
A
S
I |
SQ
-
NYSE
Square Inc Cl A
Finance-CrdtCard/PmtPr
|
$269.49
|
-2.89
-1.06% |
$274.95
|
21,359,289
254.22% of 50 DAV
50 DAV is 8,402,000
|
$283.19
-4.84%
|
8/2/2021
|
$273.78
|
PP = $283.29
|
|
MB = $297.45
|
Most Recent Note - 8/3/2021 5:42:14 PM
Y - Pulled back today after a big volume-driven gain on the prior session. Challenged its all-time high following M&A news and strong earnings. Little resistance remains due to overhead supply. Subsequent volume-driven gains above the pivot point may trigger a technical buy signal. It reported Jun '21 quarterly earnings +267% on +143% sales revenues versus the year ago period, its 4th strong comparison well above the +25% minimum guideline (C criteria). See the latest FSU analysis for more details and a new annotated graph.
>>> FEATURED STOCK ARTICLE : Pullback Following Big Gain on Strong Earnings and M&A News - 8/3/2021 |
View all notes |
Set NEW NOTE alert |
Company Profile |
SEC
News |
Chart |
Request a new note
C
A
S
I |
Symbol/Exchange
Company Name
Industry Group |
PRICE |
CHANGE
(%Change) |
Day High |
Volume
(% DAV)
(% 50 day avg vol) |
52 Wk Hi
% From Hi |
Featured
Date |
Price
Featured |
Pivot Featured |
|
Max Buy |
SHOP
-
NYSE
Shopify Inc Cl A
Computer Sftwr-Enterprse
|
$1,522.56
|
-16.11
-1.05% |
$1,559.75
|
1,607,808
113.87% of 50 DAV
50 DAV is 1,412,000
|
$1,650.00
-7.72%
|
7/2/2021
|
$1,468.00
|
PP = $1,552.23
|
|
MB = $1,629.84
|
Most Recent Note - 8/3/2021 1:30:36 PM
Y - Consolidating below its "max buy" level. Its 50 DMA line ($1,418) and recent low define near term support to watch. Reported Jun '21 quarterly earnings +113% on +57% sales revenues versus the year ago period.
>>> FEATURED STOCK ARTICLE : Managed a Positive Reversal After Early Weakness - 7/19/2021 |
View all notes |
Set NEW NOTE alert |
Company Profile |
SEC
News |
Chart |
Request a new note
C
A
S
I |
YETI
-
NYSE
Yeti Holdings Inc
Leisure-Products
|
$100.07
|
+2.46
2.52% |
$101.41
|
1,660,915
140.16% of 50 DAV
50 DAV is 1,185,000
|
$99.21
0.87%
|
5/13/2021
|
$84.20
|
PP = $90.65
|
|
MB = $95.18
|
Most Recent Note - 8/3/2021 1:34:56 PM
G - Posting another gain today with above average volume and hitting new all-time highs. Near its 50 DMA line ($91.59) it recently found prompt support. Due to report Jun '21 quarterly results on 8/05/21. Volume and volatility often increase near earnings news.
>>> FEATURED STOCK ARTICLE : Volume Totals Cooling While Consolidating Near High - 7/9/2021 |
View all notes |
Set NEW NOTE alert |
Company Profile |
SEC
News |
Chart |
Request a new note
C
A
S
I |
DOCU
-
NASDAQ
Docusign Inc
Computer Sftwr-Enterprse
|
$292.66
|
-2.44
-0.83% |
$299.84
|
1,451,595
49.59% of 50 DAV
50 DAV is 2,927,000
|
$310.51
-5.75%
|
7/6/2021
|
$288.96
|
PP = $290.33
|
|
MB = $304.85
|
Most Recent Note - 8/3/2021 5:45:40 PM
Y - Volume totals have been cooling while hovering near its all-time high after wedging into new high territory with recent gains lacking great volume conviction. Prior low ($270.41 on 7/15/21) defines initial support above its 50 DMA line ($265).
>>> FEATURED STOCK ARTICLE : Touched New High With Average Volume Behind Today's Gain - 7/6/2021 |
View all notes |
Set NEW NOTE alert |
Company Profile |
SEC
News |
Chart |
Request a new note
C
A
S
I |
XPEL
-
NASDAQ
Xpel Inc
Auto/Truck-Tires andamp; Misc
|
$86.18
|
-6.77
-7.28% |
$92.82
|
323,818
140.79% of 50 DAV
50 DAV is 230,000
|
$103.84
-17.01%
|
7/21/2021
|
$92.25
|
PP = $94.31
|
|
MB = $99.03
|
Most Recent Note - 8/3/2021 5:56:22 PM
G - Violated its 50 DMA line ($87.14) with today's big volume-driven loss. Raised concerns last week as it fell back into the previously noted base. Prior lows in the $78.50 define the next important support. Due to report Jun '21 quarterly results on 8/09/21.
>>> FEATURED STOCK ARTICLE : New Base Formed May Be "Late Stage" - 7/21/2021 |
View all notes |
Set NEW NOTE alert |
Company Profile |
SEC
News |
Chart |
Request a new note
C
A
S
I |
JEF
-
NYSE
Jefferies Financial Grp
Finance-Invest Bnk/Bkrs
|
$33.73
|
+0.11
0.33% |
$33.91
|
1,009,296
48.73% of 50 DAV
50 DAV is 2,071,000
|
$35.69
-5.49%
|
6/28/2021
|
$31.81
|
PP = $34.42
|
|
MB = $36.14
|
Most Recent Note - 8/2/2021 5:33:38 PM
Y - Volume totals have been cooling since it found support when recently testing its 50 DMA line ($32.27). More damaging losses would raise concerns and trigger a technical sell signal. As previously noted - "Subsequent gains above the pivot point backed by at least +40% above average volume are necessary to trigger a technical buy signal."
>>> FEATURED STOCK ARTICLE : High-Ranked Financial Firm Formed "Double Bottom" Base - 6/28/2021 |
View all notes |
Set NEW NOTE alert |
Company Profile |
SEC
News |
Chart |
Request a new note
C
A
S
I |
Symbol/Exchange
Company Name
Industry Group |
PRICE |
CHANGE
(%Change) |
Day High |
Volume
(% DAV)
(% 50 day avg vol) |
52 Wk Hi
% From Hi |
Featured
Date |
Price
Featured |
Pivot Featured |
|
Max Buy |
CLAR
-
NASDAQ
Clarus Corporation
Leisure-Products
|
$29.99
|
+0.67
2.29% |
$32.36
|
367,348
157.66% of 50 DAV
50 DAV is 233,000
|
$29.44
1.87%
|
5/12/2021
|
$21.40
|
PP = $19.73
|
|
MB = $20.72
|
Most Recent Note - 8/3/2021 1:01:17 PM
G - Gapped up today powering for a 4th consecutive volume-driven gain for a new 52-week high, getting very extended from any sound base. Bullish action came after it reported Jun '21 quarterly earnings +244% on +41% sales revenues versus the year ago period, showing impressive sales revenues and earnings acceleration in sequential quarterly comparisons. Its 50 DMA line ($26) defines important near-term support to watch on pullbacks.
>>> FEATURED STOCK ARTICLE : Extended From Prior Base and Hitting Another New High - 7/20/2021 |
View all notes |
Set NEW NOTE alert |
Company Profile |
SEC
News |
Chart |
Request a new note
C
A
S
I |
AVTR
-
NYSE
Avantor Inc
Medical-Research Eqp/Svc
|
$37.80
|
+0.20
0.53% |
$38.04
|
3,932,825
104.21% of 50 DAV
50 DAV is 3,774,000
|
$38.65
-2.20%
|
6/10/2021
|
$32.94
|
PP = $34.09
|
|
MB = $35.79
|
Most Recent Note - 7/30/2021 12:21:41 PM
G - Perched at its all-time high, extended from any sound base. Reported Jun '21 earnings +84% on +26% sales revenues versus the year ago period. Volume and volatility often increase near earnings news. Its 50 DMA line coincides with the prior high in the $34 area defining important support to watch on pullbacks.
>>> FEATURED STOCK ARTICLE : Held Ground But Made Little Price Progress Since Featured - 7/14/2021 |
View all notes |
Set NEW NOTE alert |
Company Profile |
SEC
News |
Chart |
Request a new note
C
A
S
I |
MIME
-
NASDAQ
Mimecast Limited
Computer Sftwr-Security
|
$58.01
|
+2.89
5.24% |
$59.96
|
1,436,597
253.82% of 50 DAV
50 DAV is 566,000
|
$59.48
-2.47%
|
8/2/2021
|
$56.12
|
PP = $59.58
|
|
MB = $62.56
|
Most Recent Note - 8/3/2021 1:24:23 PM
Y - Posting a big volume-driven gain for a new all-time high today. Bullish action came after reporting Jun '21 quarterly earnings +45% on +24% sales revenues versus the year ago period. It was highlighted in yellow in the prior mid-day report with pivot point cited based on its 12/28/20 high plus 10 cents when noted - "Subsequent gains above the pivot point backed by at least +40% above average volume may trigger a technical buy signal. Due to report Jun '21 quarterly results. Volume and volatility often increase near earnings news. Quarterly and annual earnings (C and A criteria) history has been strong after a loss in FY '18."
>>> FEATURED STOCK ARTICLE : Perched Not Far From High With Earnings News Due Pre-Open - 8/2/2021 |
View all notes |
Set NEW NOTE alert |
Company Profile |
SEC
News |
Chart |
Request a new note
C
A
S
I |
|
|
|
THESE ARE NOT BUY RECOMMENDATIONS!
Comments contained in the body of this report are technical
opinions only. The material herein has been obtained
from sources believed to be reliable and accurate, however,
its accuracy and completeness cannot be guaranteed.
This site is not an investment advisor, hence it does
not endorse or recommend any securities or other investments.
Any recommendation contained in this report may not
be suitable for all investors and it is not to be deemed
an offer or solicitation on our part with respect to
the purchase or sale of any securities. All trademarks,
service marks and trade names appearing in this report
are the property of their respective owners, and are
likewise used for identification purposes only.
This report is a service available
only to active Paid Premium Members.
You may opt-out of receiving report notifications
at any time. Questions or comments may be submitted
by writing to Premium Membership Services 665 S.E. 10 Street, Suite 201 Deerfield Beach, FL 33441-5634 or by calling 1-800-965-8307
or 954-785-1121.
|
|
|