You are not logged in.
This means you
CAN ONLY VIEW reports that were published prior to Thursday, March 20, 2025.
You
MUST UPGRADE YOUR MEMBERSHIP if you want to see any current reports.
AFTER MARKET UPDATE - MONDAY, JULY 12TH, 2021
Previous After Market Report Next After Market Report >>>
|
|
|
|
DOW |
+126.02 |
34,996.18 |
+0.36% |
|
Volume |
786,461,663 |
-4% |
|
Volume |
3,823,197,800 |
+1% |
|
NASDAQ |
+31.05 |
14,732.96 |
+0.21% |
|
Advancers |
1,880 |
58% |
|
Advancers |
2,279 |
53% |
|
S&P 500 |
+15.08 |
4,384.63 |
+0.35% |
|
Decliners |
1,349 |
42% |
|
Decliners |
2,019 |
47% |
|
Russell 2000 |
+1.82 |
2,281.83 |
+0.08% |
|
52 Wk Highs |
209 |
|
|
52 Wk Highs |
154 |
|
|
S&P 600 |
+5.61 |
1,365.19 |
+0.41% |
|
52 Wk Lows |
14 |
|
|
52 Wk Lows |
31 |
|
|
 |
Major Indices Rose With More Leadership Showing Up
Kenneth J. Gruneisen - Passed the CAN SLIM® Master's Exam
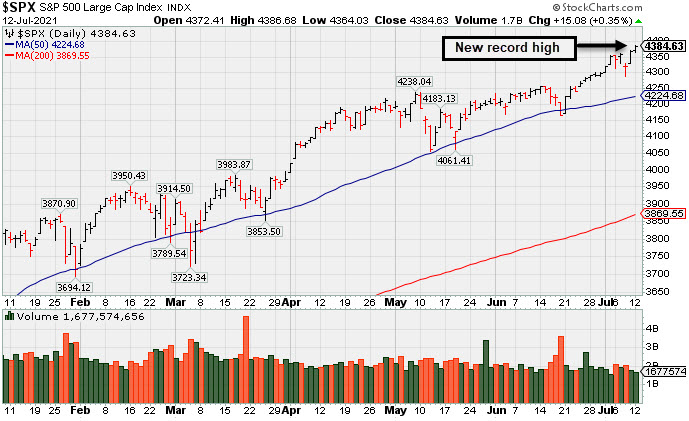
The Dow added 126 points, while the S&P 500 rose 0.4%. The Nasdaq Composite was up 0.2%. Overall S&P 500 earnings growth is expected to exceed 63% year-over-year during the April-June period, according to Bloomberg data. The volume totals reported were mixed, lighter than the prior session on the NYSE and slightly higher on the Nasdaq exchange. Advancers led decliners by almost a 3-2 margin on the NYSE but led by a much narrower margin on the Nasdaq exchange. There were 55 high-ranked companies from the Leaders List that hit new 52-week highs and were listed on the BreakOuts Page, versus 33 on the prior session. New 52-week highs totals expanded and outnumbered new 52-week lows on the NYSE and on the Nasdaq exchange. The major indices (M criteria) are in an uptrend. Investors are reminded to always make buying and selling decisions on case-by-case basis under the strict criteria and rules of the fact-based investment system.
PICTURED: The S&P 500 Index posted a gain for a new record close.
The major averages finished at fresh record levels Monday as investors anticipated a jam-packed week of corporate earnings reports and key economic data. Treasuries fluctuated, with the yield on the 10-year note ending just one basis point higher at 1.37% following a strong $38 billion auction of this maturity. Market participants will now turn their attention to tomorrow’s consumer price index (CPI) figures for an update on inflationary pressures. In commodities, WTI crude slipped 0.6% to $74.13/barrel.
Nine of 11 S&P 500 sectors closed in positive territory, with Consumer Staples and Energy the two declining groups. Financials paced gains ahead of this week’s earnings reports, with some of the largest U.S. banks scheduled to unofficially kick off the season tomorrow. Communication Services also outperformed, with Walt Disney (DIS +4.28%) rose following strong streaming demand for one of its latest films. In corporate news, Broadcom (AVGO +1.16%) rose amid reports the Tech giant is engaging in discussions to purchase privately-held SAS Institute, Inc. Elsewhere, Virgin Galactic (SPCE -17.30%) fell after disclosing plans to issue additional shares.
Last week’s volatility was characterized by peak economic growth concerns. Treasury yields tumbled to the lowest levels in nearly five months, while the S&P 500 saw its worst session since June 18 on Thursday before experiencing a relief rally on Friday. |
 Kenneth J. Gruneisen started out as a licensed stockbroker in August 1987, a couple of months prior to the historic stock market crash that took the Dow Jones Industrial Average down -22.6% in a single day. He has published daily fact-based fundamental and technical analysis on high-ranked stocks online for two decades. Through FACTBASEDINVESTING.COM, Kenneth provides educational articles, news, market commentary, and other information regarding proven investment systems that work in good times and bad.
Comments contained in the body of this report are technical opinions only and are not necessarily those of Gruneisen Growth Corp. The material herein has been obtained from sources believed to be reliable and accurate, however, its accuracy and completeness cannot be guaranteed. Our firm, employees, and customers may effect transactions, including transactions contrary to any recommendation herein, or have positions in the securities mentioned herein or options with respect thereto. Any recommendation contained in this report may not be suitable for all investors and it is not to be deemed an offer or solicitation on our part with respect to the purchase or sale of any securities. |
|
 |
Financials and Semiconductor Index Rose
Kenneth J. Gruneisen - Passed the CAN SLIM® Master's Exam
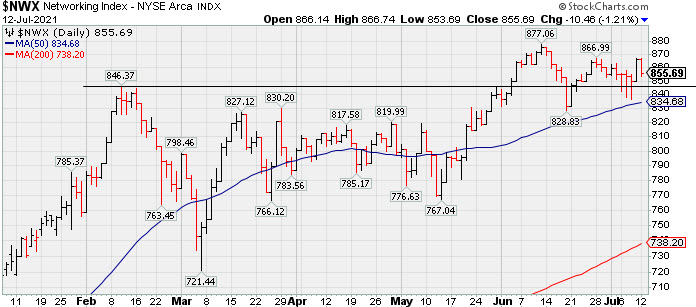
The Broker/Dealer Index ($XBD +1.08%) and Bank Index ($BKX +1.17%) both posted gains while the Retail Index ($RLX +0.04%) finished flat. The tech sector was mixed as the Semiconductor Index ($SOX +1.27%) posted a gain while the Biotech Index ($BTK -1.17%) and Networking Index ($NWX -1.21%) both lost ground. The Gold & Silver Index ($XAU -1.48%) also slumped while the Oil Services Index ($OSX -0.09%) and Integrated Oil Index ($XOI -0.19%) both did a better job holding their ground.
PICTURED: The Networking Index ($NWX -1.21%) found support near its prior high and above its 50-day moving average (DMA) line.
| Oil Services |
$OSX |
62.27 |
-0.06 |
-0.09% |
+40.48% |
| Integrated Oil |
$XOI |
1,101.75 |
-2.13 |
-0.19% |
+39.03% |
| Semiconductor |
$SOX |
3,319.94 |
+41.55 |
+1.27% |
+18.76% |
| Networking |
$NWX |
855.69 |
-10.46 |
-1.21% |
+19.32% |
| Broker/Dealer |
$XBD |
468.42 |
+5.00 |
+1.08% |
+24.05% |
| Retail |
$RLX |
4,191.33 |
+1.67 |
+0.04% |
+17.63% |
| Gold & Silver |
$XAU |
139.28 |
-2.09 |
-1.48% |
-3.41% |
| Bank |
$BKX |
125.91 |
+1.45 |
+1.17% |
+28.59% |
| Biotech |
$BTK |
5,843.46 |
-69.18 |
-1.17% |
+1.82% |
|
|
|
 |
Gain for New High Leaves GNRC Very Extended From Prior Base
Kenneth J. Gruneisen - Passed the CAN SLIM® Master's Exam
Generac Holdings Inc (GNRC +$11.78 or +2.70% to $448.15) volume was just +7% above average behind today's gain for yet another new all-time high, getting more extended from the previously noted base. The prior high ($364) defines initial support to watch on pullbacks. Fundamentals remain strong.
GNRC was highlighted in yellow in the 6/08/21 mid-day report (read here) with pivot point cited based on its 4/06/21 high. It gapped up clearing prior highs and nearly challenging its all-time high, which an annotated graph showed that evening under the headline, "Gap Up Gain With +118% Above Average Volume".
GNRC has an Earnings Per Share Rating of 97. Recently it reported earnings +174% on +70% sales revenues for the Mar '21 quarter versus the year ago period, its 3rd strong quarterly comparison above the +25% minimum guideline (C criteria). Annual earnings (A criteria) growth has been strong and steady.
The high-ranked Electrical-Power/Equipment firm has seen the number of top-rated funds owning its shares rise from 816 in Jun '20 to 1,528 in Jun '21,a reassuring sign concerning the I criteria. Its current Up/Down Volume Ratio of 2.8 is an unbiased indication its shares have been under accumulation over the past 50 days. It has a Timeliness Rating of A and Sponsorship Rating of B. |
|
|
Color Codes Explained :
Y - Better candidates highlighted by our
staff of experts.
G - Previously featured
in past reports as yellow but may no longer be buyable under the
guidelines.
***Last / Change / Volume data in this table is the closing quote data***
Symbol/Exchange
Company Name
Industry Group |
PRICE |
CHANGE
(%Change) |
Day High |
Volume
(% DAV)
(% 50 day avg vol) |
52 Wk Hi
% From Hi |
Featured
Date |
Price
Featured |
Pivot Featured |
|
Max Buy |
 SIVB
-
NASDAQ
SIVB
-
NASDAQ
S V B Financial Group
BANKING - Regional - Pacific Banks
|
$593.66
|
+18.42
3.20% |
$597.32
|
487,769
128.70% of 50 DAV
50 DAV is 379,000
|
$608.84
-2.49%
|
4/23/2021
|
$579.70
|
PP = $577.16
|
|
MB = $606.02
|
 Most Recent Note - 7/12/2021 1:00:49 PM
Y - With today's 2nd consecutive big gain it has rebounded above its 50 DMA line ($569.40) to nearly challenge its 52-week high and little resistance remains. Previously noted - "Confirming gains above the pivot point backed by at least +40% above average volume are still needed to help clinch a convincing technical buy signal. Reported earnings +293% on +64% sales revenues for the Mar '21 quarter versus the year ago period, its 3rd strong comparison. Completed a new Public Offering on 3/24/21."
>>> FEATURED STOCK ARTICLE : Consolidating Near 50-Day Average After Distributional Pressure - 6/25/2021 |
View all notes |
Set NEW NOTE alert |
Company Profile |
SEC
News |
Chart |
Request a new note
C
A
S
I |
LOGI
-
NASDAQ
Logitech Intl Sa
COMPUTER HARDWARE - Computer Peripherals
|
$124.90
|
-1.28
-1.01% |
$127.66
|
504,331
59.33% of 50 DAV
50 DAV is 850,000
|
$140.17
-10.89%
|
5/26/2021
|
$119.13
|
PP = $120.34
|
|
MB = $126.36
|
Most Recent Note - 7/7/2021 3:15:27 PM
G - Color code is changed to green after rising back above its "max buy" level with today's 3rd consecutive gain. Halted its slide after slumping near prior highs in the $120-117 area which define important support to watch along with its 50 DMA line ($119.56).
>>> FEATURED STOCK ARTICLE : Recent Pullback is Testing Important Technical Support - 7/2/2021 |
View all notes |
Set NEW NOTE alert |
Company Profile |
SEC
News |
Chart |
Request a new note
C
A
S
I |
CROX
-
NASDAQ
Crocs Inc
CONSUMER NON-DURABLES - Textile - Apparel Footwear
|
$117.61
|
+0.61
0.52% |
$117.83
|
703,458
45.56% of 50 DAV
50 DAV is 1,544,000
|
$118.68
-0.90%
|
6/14/2021
|
$112.64
|
PP = $110.01
|
|
MB = $115.51
|
Most Recent Note - 7/9/2021 5:20:07 PM
G - Color code is changed to green after matching its best-ever close with today's gain backed by light volume as it rose above its "max buy" level. Its prior highs in the $109 area and its 50 DMA line ($106.55) define support to watch on pullbacks. See the latest FSU analysis for more details and a new annotated graph.
>>> FEATURED STOCK ARTICLE : Quietly Consolidating Below "Max Buy" Level - 7/7/2021 |
View all notes |
Set NEW NOTE alert |
Company Profile |
SEC
News |
Chart |
Request a new note
C
A
S
I |
CRL
-
NYSE
Charles River Labs Intl
DRUGS - Biotechnology
|
$384.13
|
-0.76
-0.20% |
$386.57
|
209,104
29.96% of 50 DAV
50 DAV is 698,000
|
$384.92
-0.21%
|
6/9/2021
|
$345.91
|
PP = $349.23
|
|
MB = $366.69
|
Most Recent Note - 7/8/2021 5:20:31 PM
G - Below average volume was behind recent gains as it wedged into record high territory. Prior highs in the $349 area and its 50 DMA line ($345) define near-term support to watch on pullbacks. Two of the past 3 quarterly comparisons through Mar '21 have been above the +25% minimum earnings guideline (C criteria).
>>> FEATURED STOCK ARTICLE : Building New Base After Strong Quarterly Earnings Report - 6/9/2021 |
View all notes |
Set NEW NOTE alert |
Company Profile |
SEC
News |
Chart |
Request a new note
C
A
S
I |
GNRC
-
NYSE
Generac Hldgs Inc
Electrical-Power/Equipmt
|
$448.15
|
+11.78
2.70% |
$452.92
|
840,027
108.81% of 50 DAV
50 DAV is 772,000
|
$440.00
1.85%
|
6/8/2021
|
$348.46
|
PP = $342.38
|
|
MB = $359.50
|
Most Recent Note - 7/12/2021 5:15:22 PM
G - Volume was just +7% above average behind today's gain for yet another new all-time high, getting more extended from the previously noted base. Prior high ($364) defines initial support to watch on pullbacks. Fundamentals remain strong. See the latest FSU analysis for more details and a new annotated graph.
>>> FEATURED STOCK ARTICLE : Gain for New High Leaves GNRC Very Extended From Prior Base - 7/12/2021 |
View all notes |
Set NEW NOTE alert |
Company Profile |
SEC
News |
Chart |
Request a new note
C
A
S
I |
Symbol/Exchange
Company Name
Industry Group |
PRICE |
CHANGE
(%Change) |
Day High |
Volume
(% DAV)
(% 50 day avg vol) |
52 Wk Hi
% From Hi |
Featured
Date |
Price
Featured |
Pivot Featured |
|
Max Buy |
CAMT
-
NASDAQ
Camtek Ltd
ELECTRONICS - Scientific and Technical Instrum
|
$35.57
|
+0.40
1.14% |
$36.01
|
173,128
57.90% of 50 DAV
50 DAV is 299,000
|
$40.47
-12.11%
|
4/28/2021
|
$35.03
|
PP = $35.34
|
|
MB = $37.11
|
Most Recent Note - 7/12/2021 5:18:47 PM
Y - Color code is changed to yellow after posting gains with light volume yet finding prompt support near its 50 DMA line ($34.53). More damaging losses would raise greater concerns and trigger a technical sell signal.
>>> FEATURED STOCK ARTICLE : Loss With Light Volume Undercut 50-Day Moving Average - 7/8/2021 |
View all notes |
Set NEW NOTE alert |
Company Profile |
SEC
News |
Chart |
Request a new note
C
A
S
I |
ASML
-
NASDAQ
A S M L Holding N.V. NY
ELECTRONICS - Semiconductor Equipment and Mate
|
$707.81
|
+16.45
2.38% |
$708.51
|
618,206
81.99% of 50 DAV
50 DAV is 754,000
|
$710.97
-0.44%
|
5/25/2021
|
$669.59
|
PP = $675.75
|
|
MB = $709.54
|
Most Recent Note - 7/8/2021 12:17:48 PM
Y - Recently encountering distributional pressure, testing the prior high ($675) and its 50 DMA line ($668) which define important near-term support. More damaging losses would raise concerns and trigger technical sell signals.
>>> FEATURED STOCK ARTICLE : Volume Higher While Pulling Back Toward 50-Day Moving Average - 7/1/2021 |
View all notes |
Set NEW NOTE alert |
Company Profile |
SEC
News |
Chart |
Request a new note
C
A
S
I |
MED
-
NYSE
Medifast Inc
SPECIALTY RETAIL - Specialty Retail, Other
|
$283.44
|
-0.78
-0.27% |
$286.38
|
77,278
62.83% of 50 DAV
50 DAV is 123,000
|
$336.99
-15.89%
|
5/11/2021
|
$285.72
|
PP = $279.56
|
|
MB = $293.54
|
Most Recent Note - 7/7/2021 3:09:36 PM
G - Quietly consolidating after undercutting the prior high in the $279 area and finding support near its 50 DMA line ($286). More damaging losses below the prior low ($258.77 on 6/17/21) would raise greater concerns and trigger a worrisome technical sell signal.
>>> FEATURED STOCK ARTICLE : Halted 10-Session Losing Streak Near Prior High and 50 DMA - 6/15/2021 |
View all notes |
Set NEW NOTE alert |
Company Profile |
SEC
News |
Chart |
Request a new note
C
A
S
I |
CLFD
-
NASDAQ
Clearfield Inc
TELECOMMUNICATIONS - Cables / Satalite Equipment
|
$37.28
|
-0.29
-0.77% |
$37.67
|
61,555
52.17% of 50 DAV
50 DAV is 118,000
|
$43.64
-14.57%
|
6/4/2021
|
$40.01
|
PP = $40.36
|
|
MB = $42.38
|
Most Recent Note - 7/9/2021 5:18:30 PM
G - Posted a gain today with lighter than average volume yet closed above its 50 DMA line ($37.10) helping its outlook improve. Faces some resistance due to overhead supply up to the $43 level. Fundamentals remain strong.
>>> FEATURED STOCK ARTICLE : Consolidating Above 50-Day Moving Average Helped Outlook - 6/30/2021 |
View all notes |
Set NEW NOTE alert |
Company Profile |
SEC
News |
Chart |
Request a new note
C
A
S
I |
POOL
-
NASDAQ
Pool Corp
WHOLESALE - Basic Materials Wholesale
|
$475.51
|
-0.73
-0.15% |
$478.67
|
249,744
99.90% of 50 DAV
50 DAV is 250,000
|
$476.69
-0.25%
|
6/21/2021
|
$455.09
|
PP = $449.54
|
|
MB = $472.02
|
Most Recent Note - 7/12/2021 5:22:57 PM
G - Perched at its 52-week high and its color code is changed to green after getting extended from the latest base. Prior highs in the $449-444 range define initial support to watch above its 50 DMA line ($442) on pullbacks.
>>> FEATURED STOCK ARTICLE : Volume-Driven Breakout After Orderly Consolidation - 6/21/2021 |
View all notes |
Set NEW NOTE alert |
Company Profile |
SEC
News |
Chart |
Request a new note
C
A
S
I |
Symbol/Exchange
Company Name
Industry Group |
PRICE |
CHANGE
(%Change) |
Day High |
Volume
(% DAV)
(% 50 day avg vol) |
52 Wk Hi
% From Hi |
Featured
Date |
Price
Featured |
Pivot Featured |
|
Max Buy |
FSBW
-
NASDAQ
F S Bancorp
Banks-West/Southwest
|
$71.31
|
+1.21
1.73% |
$71.68
|
17,453
109.08% of 50 DAV
50 DAV is 16,000
|
$73.62
-3.14%
|
5/18/2021
|
$70.16
|
PP = $73.72
|
|
MB = $77.41
|
Most Recent Note - 7/12/2021 12:47:52 PM
Y - Still perched within striking distance of the pivot point cited based on its 3/08/21 high plus 10 cents. Near its 50 DMA line ($70.14) it has found prompt support during its ongoing ascent. Subsequent gains above the pivot point backed by at least +40% above average volume are needed to trigger a technical buy signal.
>>> FEATURED STOCK ARTICLE : Still Consolidating With Close Striking Distance of All-Time High - 6/24/2021 |
View all notes |
Set NEW NOTE alert |
Company Profile |
SEC
News |
Chart |
Request a new note
C
A
S
I |
SMPL
-
NASDAQ
Simply Good Foods Co
Food-Confectionery
|
$37.21
|
-0.08
-0.21% |
$37.51
|
665,256
120.96% of 50 DAV
50 DAV is 550,000
|
$38.50
-3.35%
|
12/28/2020
|
$30.40
|
PP = $31.44
|
|
MB = $33.01
|
Most Recent Note - 7/7/2021 3:13:40 PM
G - Holding its ground stubbornly with volume totals cooling after hitting a new all-time high on 7/01/21 when last noted. Prior highs in the $35 area define near-term support to watch along with its 50 DMA line ($34.96). Reported May '21 quarterly earnings +65% on +32% sales revenues versus the year ago period, well above the +25% minimum earnings guideline (C criteria).
>>> FEATURED STOCK ARTICLE : Simply Wedging Into New High Territory - 6/14/2021 |
View all notes |
Set NEW NOTE alert |
Company Profile |
SEC
News |
Chart |
Request a new note
C
A
S
I |
SHOP
-
NYSE
Shopify Inc Cl A
Computer Sftwr-Enterprse
|
$1,494.74
|
-0.25
-0.02% |
$1,530.18
|
1,118,777
77.05% of 50 DAV
50 DAV is 1,452,000
|
$1,587.74
-5.86%
|
7/2/2021
|
$1,468.00
|
PP = $1,552.23
|
|
MB = $1,629.84
|
Most Recent Note - 7/7/2021 1:04:06 PM
Y - Reversed into the red today after hitting a new high. A new pivot point was recently cited based on its 6/21/21 high while building on a cup-with-high-handle base. Confirming gains with at least +40% above average volume for new highs would trigger a new (or add-on) technical buy signal and be a reassuring sign of fresh institutional buying demand.
>>> FEATURED STOCK ARTICLE : Rebounding After Choppy 4-Month Consolidation - 6/16/2021 |
View all notes |
Set NEW NOTE alert |
Company Profile |
SEC
News |
Chart |
Request a new note
C
A
S
I |
YETI
-
NYSE
Yeti Holdings Inc
Leisure-Products
|
$93.09
|
+1.44
1.57% |
$93.72
|
558,551
37.77% of 50 DAV
50 DAV is 1,479,000
|
$95.76
-2.79%
|
5/13/2021
|
$84.20
|
PP = $90.65
|
|
MB = $95.18
|
Most Recent Note - 7/9/2021 5:15:00 PM
Y - Volume totals still have been cooling while consolidating near its 52-week high. The 50 DMA line ($89.10) and prior low ($85.08 on 6/18/21) define near-term support to watch on pullbacks. Fundamentals remain strong. See the latest FSU analysis for more details and a new annotated graph.
>>> FEATURED STOCK ARTICLE : Volume Totals Cooling While Consolidating Near High - 7/9/2021 |
View all notes |
Set NEW NOTE alert |
Company Profile |
SEC
News |
Chart |
Request a new note
C
A
S
I |
DOCU
-
NASDAQ
Docusign Inc
Computer Sftwr-Enterprse
|
$288.10
|
+0.08
0.03% |
$298.75
|
1,975,233
62.85% of 50 DAV
50 DAV is 3,143,000
|
$293.65
-1.89%
|
7/6/2021
|
$288.96
|
PP = $290.33
|
|
MB = $304.85
|
Most Recent Note - 7/7/2021 12:29:45 PM
Y - Wedging into new high territory with today's gain backed by above average volume. Highlighted in yellow with pivot point cited based on its 9/02/20 high plus 10 cents. A gain and strong close above the pivot point cited backed by at least +40% above average volume may trigger a convincing new (or add-on) technical buy signal. Fundamentals remain strong after reporting very strong Apr '21 quarterly results. It went through a choppy consolidation then rebounded since noted on 3/03/21 when dropped from the Featured Stocks list. See the latest FSU analysis for more details and an annotated graph.
>>> FEATURED STOCK ARTICLE : Touched New High With Average Volume Behind Today's Gain - 7/6/2021 |
View all notes |
Set NEW NOTE alert |
Company Profile |
SEC
News |
Chart |
Request a new note
C
A
S
I |
Symbol/Exchange
Company Name
Industry Group |
PRICE |
CHANGE
(%Change) |
Day High |
Volume
(% DAV)
(% 50 day avg vol) |
52 Wk Hi
% From Hi |
Featured
Date |
Price
Featured |
Pivot Featured |
|
Max Buy |
JEF
-
NYSE
Jefferies Financial Grp
Finance-Invest Bnk/Bkrs
|
$32.36
|
+0.43
1.35% |
$32.50
|
1,215,714
58.34% of 50 DAV
50 DAV is 2,084,000
|
$34.98
-7.49%
|
6/28/2021
|
$31.81
|
PP = $34.42
|
|
MB = $36.14
|
Most Recent Note - 7/8/2021 5:23:27 PM
G - Color code is changed to green after a gap down today and 6th consecutive loss violated its 50 DMA line ($32.09) triggering a technical sell signal. Only a prompt rebound above the 50 DMA line would help its outlook improve. Subsequent gains above the pivot point backed by at least +40% above average volume are necessary to trigger a technical buy signal.
>>> FEATURED STOCK ARTICLE : High-Ranked Financial Firm Formed "Double Bottom" Base - 6/28/2021 |
View all notes |
Set NEW NOTE alert |
Company Profile |
SEC
News |
Chart |
Request a new note
C
A
S
I |
CLAR
-
NASDAQ
Clarus Corporation
Leisure-Products
|
$27.97
|
+1.13
4.21% |
$28.00
|
166,762
73.79% of 50 DAV
50 DAV is 226,000
|
$27.95
0.07%
|
5/12/2021
|
$21.40
|
PP = $19.73
|
|
MB = $20.72
|
Most Recent Note - 7/12/2021 5:20:49 PM
G - Posted a big gain with below average volume and hit a new 52-week high today. It did not form a sound base of sufficient length. Its 50 DMA line ($23.46) defines important near-term support to watch.
>>> FEATURED STOCK ARTICLE : Encountering Distributional Pressure After Recent Rally - 6/17/2021 |
View all notes |
Set NEW NOTE alert |
Company Profile |
SEC
News |
Chart |
Request a new note
C
A
S
I |
AVTR
-
NYSE
Avantor Inc
Medical-Research Eqp/Svc
|
$36.22
|
+0.14
0.39% |
$36.50
|
4,098,250
102.20% of 50 DAV
50 DAV is 4,010,000
|
$36.42
-0.55%
|
6/10/2021
|
$32.94
|
PP = $34.09
|
|
MB = $35.79
|
Most Recent Note - 7/12/2021 5:17:21 PM
G - Inched to a new high today. Stubbornly held its ground and made gradual progress since triggering a technical buy signal. Prior highs in the $33 area define initial support to watch on pullbacks.
>>> FEATURED STOCK ARTICLE : Medical Research Firm Challenging Prior High - 6/10/2021 |
View all notes |
Set NEW NOTE alert |
Company Profile |
SEC
News |
Chart |
Request a new note
C
A
S
I |
|
|
|
THESE ARE NOT BUY RECOMMENDATIONS!
Comments contained in the body of this report are technical
opinions only. The material herein has been obtained
from sources believed to be reliable and accurate, however,
its accuracy and completeness cannot be guaranteed.
This site is not an investment advisor, hence it does
not endorse or recommend any securities or other investments.
Any recommendation contained in this report may not
be suitable for all investors and it is not to be deemed
an offer or solicitation on our part with respect to
the purchase or sale of any securities. All trademarks,
service marks and trade names appearing in this report
are the property of their respective owners, and are
likewise used for identification purposes only.
This report is a service available
only to active Paid Premium Members.
You may opt-out of receiving report notifications
at any time. Questions or comments may be submitted
by writing to Premium Membership Services 665 S.E. 10 Street, Suite 201 Deerfield Beach, FL 33441-5634 or by calling 1-800-965-8307
or 954-785-1121.
|
|
|