***Last / Change / Volume data in this table is the closing quote data***
Symbol/Exchange
Company Name
Industry Group |
PRICE |
CHANGE
(%Change) |
Day High |
Volume
(% DAV)
(% 50 day avg vol) |
52 Wk Hi
% From Hi |
Featured
Date |
Price
Featured |
Pivot Featured |
|
Max Buy |
 ABCB
-
NASDAQ
ABCB
-
NASDAQ
Ameris Bancorp
BANKING - Regional - Mid-Atlantic Banks
|
$51.57
|
-1.45
-2.73% |
$52.63
|
344,937
77.51% of 50 DAV
50 DAV is 445,000
|
$59.85
-13.83%
|
5/21/2021
|
$58.86
|
PP = $57.91
|
|
MB = $60.81
|
Most Recent Note - 6/24/2021 3:52:55 PM
G - Rebounding after last week's damaging losses triggered a worrisome technical sell signal. A rebound above the 50 DMA line (54.21) is needed for its outlook to improve.
>>> FEATURED STOCK ARTICLE : Breakout to New All-Time High for Another Regional Bank - 5/21/2021 |
View all notes |
Set NEW NOTE alert |
Company Profile |
SEC
News |
Chart |
Request a new note
C
A
S
I |
SIVB
-
NASDAQ
S V B Financial Group
BANKING - Regional - Pacific Banks
|
$556.88
|
-7.83
-1.39% |
$565.31
|
275,707
66.60% of 50 DAV
50 DAV is 414,000
|
$608.84
-8.53%
|
4/23/2021
|
$579.70
|
PP = $577.16
|
|
MB = $606.02
|
Most Recent Note - 6/25/2021 5:14:27 PM
G - Consolidating near its 50 DMA line ($566). Confirming gains above the pivot point backed by at least +40% above average volume are still needed to help clinch a convincing technical buy signal. Reported earnings +293% on +64% sales revenues for the Mar '21 quarter versus the year ago period, its 3rd strong comparison. Completed a new Public Offering on 3/24/21. See the latest FSU analysis for more details and a new annotated graph.
>>> FEATURED STOCK ARTICLE : Consolidating Near 50-Day Average After Distributional Pressure - 6/25/2021 |
View all notes |
Set NEW NOTE alert |
Company Profile |
SEC
News |
Chart |
Request a new note
C
A
S
I |
LOGI
-
NASDAQ
Logitech Intl Sa
COMPUTER HARDWARE - Computer Peripherals
|
$121.80
|
+1.05
0.87% |
$122.57
|
576,366
67.25% of 50 DAV
50 DAV is 857,000
|
$140.17
-13.11%
|
5/26/2021
|
$119.13
|
PP = $120.34
|
|
MB = $126.36
|
Most Recent Note - 6/25/2021 5:12:56 PM
Y - Suffered a loss today with higher volume, slumping near prior highs in the $120-117 area which define important support to watch above its 50 DMA line ($118.34).
>>> FEATURED STOCK ARTICLE : Streak of Gains to New Highs Lacked Great Volume Conviction - 5/27/2021 |
View all notes |
Set NEW NOTE alert |
Company Profile |
SEC
News |
Chart |
Request a new note
C
A
S
I |
CROX
-
NASDAQ
Crocs Inc
CONSUMER NON-DURABLES - Textile - Apparel Footwear
|
$116.06
|
+1.65
1.44% |
$117.31
|
876,605
48.57% of 50 DAV
50 DAV is 1,805,000
|
$117.43
-1.17%
|
6/14/2021
|
$112.64
|
PP = $110.01
|
|
MB = $115.51
|
 Most Recent Note - 6/28/2021 5:13:08 PM
Y - Posted a 6th consecutive gain today with lighter than average volume hitting new all-time highs. Its 50 DMA line ($101.64) defines initial support above the prior low ($94.92 on 5/20/21).
>>> FEATURED STOCK ARTICLE : Encountered Distributional Pressure Late This Week - 5/28/2021 |
View all notes |
Set NEW NOTE alert |
Company Profile |
SEC
News |
Chart |
Request a new note
C
A
S
I |
RCKY
-
NASDAQ
Rocky Brands Inc
CONSUMER NON-DURABLES - Textile - Apparel Footwear
|
$55.16
|
-0.28
-0.51% |
$55.50
|
44,943
49.94% of 50 DAV
50 DAV is 90,000
|
$69.00
-20.06%
|
5/5/2021
|
$61.65
|
PP = $61.55
|
|
MB = $64.63
|
Most Recent Note - 6/28/2021 5:16:08 PM
G - Still sputtering below its 50 DMA line ($55.99) which is now downward sloping. A rebound above that short-term average is needed for its outlook to improve. The prior low ($50.52 on 5/19/21) defines the next important support where any violation may trigger a more worrisome technical sell signal. Fundamentals remain strong.
>>> FEATURED STOCK ARTICLE : Still Sputtering After Slump Below 50-Day Moving Average - 6/7/2021 |
View all notes |
Set NEW NOTE alert |
Company Profile |
SEC
News |
Chart |
Request a new note
C
A
S
I |
Symbol/Exchange
Company Name
Industry Group |
PRICE |
CHANGE
(%Change) |
Day High |
Volume
(% DAV)
(% 50 day avg vol) |
52 Wk Hi
% From Hi |
Featured
Date |
Price
Featured |
Pivot Featured |
|
Max Buy |
CRL
-
NYSE
Charles River Labs Intl
DRUGS - Biotechnology
|
$366.06
|
-1.84
-0.50% |
$369.95
|
283,181
40.11% of 50 DAV
50 DAV is 706,000
|
$370.58
-1.22%
|
6/9/2021
|
$345.91
|
PP = $349.23
|
|
MB = $366.69
|
Most Recent Note - 6/28/2021 5:11:21 PM
Y - Holding its ground with below average volume after recently wedging to new highs. Gains above the pivot point backed by at least +40% above average volume are needed to trigger a proper new (or add-on) technical buy signal. Its 50 DMA line ($338.50) defines near-term support to watch on pullbacks. Two of the past 3 quarterly comparisons through Mar '21 have been above the +25% minimum earnings guideline (C criteria).
>>> FEATURED STOCK ARTICLE : Building New Base After Strong Quarterly Earnings Report - 6/9/2021 |
View all notes |
Set NEW NOTE alert |
Company Profile |
SEC
News |
Chart |
Request a new note
C
A
S
I |
GNRC
-
NYSE
Generac Hldgs Inc
Electrical-Power/Equipmt
|
$409.19
|
+13.14
3.32% |
$412.10
|
957,258
129.18% of 50 DAV
50 DAV is 741,000
|
$409.38
-0.05%
|
6/8/2021
|
$348.46
|
PP = $342.38
|
|
MB = $359.50
|
Most Recent Note - 6/24/2021 12:52:54 PM
G - Reversed into the red today after hitting another new all-time high. Very extended from the previously noted base after a streak of 10 consecutive gains marked by volume. Prior high ($364) defines initial support to watch on pullbacks. Fundamentals remain strong.
>>> FEATURED STOCK ARTICLE : Gap Up Gain With +118% Above Average Volume - 6/8/2021 |
View all notes |
Set NEW NOTE alert |
Company Profile |
SEC
News |
Chart |
Request a new note
C
A
S
I |
CAMT
-
NASDAQ
Camtek Ltd
ELECTRONICS - Scientific and Technical Instrum
|
$38.30
|
+1.24
3.35% |
$38.47
|
141,197
45.11% of 50 DAV
50 DAV is 313,000
|
$40.47
-5.36%
|
4/28/2021
|
$35.03
|
PP = $35.34
|
|
MB = $37.11
|
Most Recent Note - 6/24/2021 3:48:49 PM
G - Found support this week near prior highs in the $35-36 area after briefly dipping below the previously noted "max buy" level. Its 50 DMA line ($33.73) defines the next important support to watch.
>>> FEATURED STOCK ARTICLE : Perched at 52-Week High After 4th Consecutive Gain - 6/1/2021 |
View all notes |
Set NEW NOTE alert |
Company Profile |
SEC
News |
Chart |
Request a new note
C
A
S
I |
ASML
-
NASDAQ
A S M L Holding N.V. NY
ELECTRONICS - Semiconductor Equipment and Mate
|
$704.11
|
+17.90
2.61% |
$705.80
|
589,894
71.76% of 50 DAV
50 DAV is 822,000
|
$710.97
-0.96%
|
5/25/2021
|
$669.59
|
PP = $675.75
|
|
MB = $709.54
|
Most Recent Note - 6/24/2021 3:54:43 PM
Y - Consolidating near its all time high after testing the prior high ($675) with a big loss on heavier volume. Highlighted in yellow with pivot point cited based on its 4/26/21 high plus 10 cents. Subsequent gain and a strong close above its pivot point backed by at least +40% above average volume is needed to trigger a proper technical buy signal. Its 50 DMA line ($661) defines important near-term support to watch.
>>> FEATURED STOCK ARTICLE : Perched Near All-Time High After Short Base Above 50-Day Average - 5/26/2021 |
View all notes |
Set NEW NOTE alert |
Company Profile |
SEC
News |
Chart |
Request a new note
C
A
S
I |
BRKS
-
NASDAQ
Brooks Automation
ELECTRONICS - Semiconductor Equipment and Mate
|
$97.08
|
+2.81
2.98% |
$98.45
|
1,119,568
115.06% of 50 DAV
50 DAV is 973,000
|
$108.72
-10.71%
|
4/5/2021
|
$99.31
|
PP = $91.88
|
|
MB = $96.47
|
Most Recent Note - 6/24/2021 3:51:08 PM
G - Rebounding toward its 50 DMA line ($97.17) which may act as resistance after damaging volume-driven losses. A rebound above the 50 DMA line would help its outlook improve. More damaging losses below the recent low ($86.12 on 5/12/21) would trigger a more worrisome technical sell signal.
>>> FEATURED STOCK ARTICLE : Consolidating Above 50-Day Moving Average Line and Prior High - 6/3/2021 |
View all notes |
Set NEW NOTE alert |
Company Profile |
SEC
News |
Chart |
Request a new note
C
A
S
I |
Symbol/Exchange
Company Name
Industry Group |
PRICE |
CHANGE
(%Change) |
Day High |
Volume
(% DAV)
(% 50 day avg vol) |
52 Wk Hi
% From Hi |
Featured
Date |
Price
Featured |
Pivot Featured |
|
Max Buy |
OPY
-
NYSE
Oppenheimer Holdings Inc
FINANCIAL SERVICES - Investment Brokerage - Regiona
|
$50.65
|
-1.69
-3.23% |
$52.80
|
103,691
90.96% of 50 DAV
50 DAV is 114,000
|
$55.75
-9.15%
|
6/7/2021
|
$48.74
|
PP = $52.55
|
|
MB = $55.18
|
Most Recent Note - 6/24/2021 4:00:52 PM
Y - Posted a 2nd consecutive gain with below average volume. Recent slump below prior highs and back into the prior base raised concerns. Its 50 DMA line ($49.06) defines important near term support. Fundamentals remain strong.
>>> FEATURED STOCK ARTICLE : Abrupt Slump Back Into Latest Base With 2 Volume-Driven Losses - 6/18/2021 |
View all notes |
Set NEW NOTE alert |
Company Profile |
SEC
News |
Chart |
Request a new note
C
A
S
I |
MED
-
NYSE
Medifast Inc
SPECIALTY RETAIL - Specialty Retail, Other
|
$274.95
|
-1.46
-0.53% |
$279.75
|
87,743
73.12% of 50 DAV
50 DAV is 120,000
|
$336.99
-18.41%
|
5/11/2021
|
$285.72
|
PP = $279.56
|
|
MB = $293.54
|
Most Recent Note - 6/24/2021 4:44:39 PM
G - Recently rebounded and it is consolidating near the prior high in the $279 area and near its 50 DMA line ($278). More damaging losses below the prior low ($258.77 on ce6/17/21) would raise greater concerns and trigger a worrisome technical sell signal.
>>> FEATURED STOCK ARTICLE : Halted 10-Session Losing Streak Near Prior High and 50 DMA - 6/15/2021 |
View all notes |
Set NEW NOTE alert |
Company Profile |
SEC
News |
Chart |
Request a new note
C
A
S
I |
CLFD
-
NASDAQ
Clearfield Inc
TELECOMMUNICATIONS - Cables / Satalite Equipment
|
$37.52
|
+0.28
0.75% |
$37.94
|
80,495
54.76% of 50 DAV
50 DAV is 147,000
|
$43.64
-14.02%
|
6/4/2021
|
$40.01
|
PP = $40.36
|
|
MB = $42.38
|
Most Recent Note - 6/22/2021 6:36:27 PM
G - Posted a gain today. Its 50 DMA line ($35.97) may act as resistance, while a convincing rebound above its would help its outlook improve. Fundamentals remain strong. See the latest FSU analysis for ore details and a new annotated graph.
>>> FEATURED STOCK ARTICLE : Stalled and Found Support Above 50-Day Moving Average - 5/24/2021 |
View all notes |
Set NEW NOTE alert |
Company Profile |
SEC
News |
Chart |
Request a new note
C
A
S
I |
POOL
-
NASDAQ
Pool Corp
WHOLESALE - Basic Materials Wholesale
|
$456.54
|
+0.77
0.17% |
$459.12
|
222,341
85.52% of 50 DAV
50 DAV is 260,000
|
$464.03
-1.61%
|
6/21/2021
|
$455.09
|
PP = $449.54
|
|
MB = $472.02
|
Most Recent Note - 6/28/2021 5:15:23 PM
Y - Holding its ground in a tight range near its 52-week high. Prior highs in the $449-444 range define initial support to watch above its 50 DMA line on pullbacks.
>>> FEATURED STOCK ARTICLE : Volume-Driven Breakout After Orderly Consolidation - 6/21/2021 |
View all notes |
Set NEW NOTE alert |
Company Profile |
SEC
News |
Chart |
Request a new note
C
A
S
I |
FSBW
-
NASDAQ
F S Bancorp
Banks-West/Southwest
|
$71.05
|
-0.36
-0.50% |
$72.08
|
25,121
167.47% of 50 DAV
50 DAV is 15,000
|
$73.62
-3.49%
|
5/18/2021
|
$70.16
|
PP = $73.72
|
|
MB = $77.41
|
Most Recent Note - 6/24/2021 4:41:38 PM
Y - Quiet gain today leaves it perched within close striking distance of the pivot point cited based on its 3/08/21 high plus 10 cents. It has been consolidating above its 50 DMA line ($69.25) where it found prompt support during its ongoing ascent. Subsequent gains above the pivot point backed by at least +40% above average volume are needed to trigger a technical buy signal. See the latest FSU analysis for more details and a new annotated graph.
>>> FEATURED STOCK ARTICLE : Still Consolidating With Close Striking Distance of All-Time High - 6/24/2021 |
View all notes |
Set NEW NOTE alert |
Company Profile |
SEC
News |
Chart |
Request a new note
C
A
S
I |
Symbol/Exchange
Company Name
Industry Group |
PRICE |
CHANGE
(%Change) |
Day High |
Volume
(% DAV)
(% 50 day avg vol) |
52 Wk Hi
% From Hi |
Featured
Date |
Price
Featured |
Pivot Featured |
|
Max Buy |
SMPL
-
NASDAQ
Simply Good Foods Co
Food-Confectionery
|
$36.49
|
+0.63
1.76% |
$36.63
|
530,808
100.15% of 50 DAV
50 DAV is 530,000
|
$37.83
-3.54%
|
12/28/2020
|
$30.40
|
PP = $31.44
|
|
MB = $33.01
|
Most Recent Note - 6/24/2021 1:07:55 PM
G - Hovering near its all-time high following a noted streak of 8 consecutive gains. Near-term support to watch is its 50 DMA line ($34.45) and the prior low ($31.09 on 5/18/21). Reported Feb '21 quarterly earnings +9% on +2% sales revenues versus the year ago period, below the +25% minimum earnings guideline (C criteria), raising fundamental concerns.
>>> FEATURED STOCK ARTICLE : Simply Wedging Into New High Territory - 6/14/2021 |
View all notes |
Set NEW NOTE alert |
Company Profile |
SEC
News |
Chart |
Request a new note
C
A
S
I |
SHOP
-
NYSE
Shopify Inc Cl A
Computer Sftwr-Enterprse
|
$1,494.99
|
+21.45
1.46% |
$1,523.15
|
1,278,066
87.54% of 50 DAV
50 DAV is 1,460,000
|
$1,552.23
-3.69%
|
6/16/2021
|
$1,343.80
|
PP = $1,499.85
|
|
MB = $1,574.84
|
Most Recent Note - 6/23/2021 12:24:20 PM
Y - The prior gain and close above the pivot point was backed by +51% above average volume helping clinch a technical buy signal. Perched at its all-time high today following a streak of 9 consecutive gains marked by volume. Prior highs define initial support to watch on pullbacks.
>>> FEATURED STOCK ARTICLE : Rebounding After Choppy 4-Month Consolidation - 6/16/2021 |
View all notes |
Set NEW NOTE alert |
Company Profile |
SEC
News |
Chart |
Request a new note
C
A
S
I |
YETI
-
NYSE
Yeti Holdings Inc
Leisure-Products
|
$92.19
|
+0.12
0.13% |
$92.72
|
780,918
49.36% of 50 DAV
50 DAV is 1,582,000
|
$95.76
-3.73%
|
5/13/2021
|
$84.20
|
PP = $90.65
|
|
MB = $95.18
|
Most Recent Note - 6/21/2021 5:23:28 PM
G - Posted a gain today with lighter volume breaking a streak of 5 consecutive losses. Only a prompt rebound above the 50 DMA line ($87.59) would help its outlook improve. Prior highs in the $80 area define near-term support to watch on pullbacks. Reported Mar 21 quarterly earnings +245% on +42% sales revenues versus the year ago period, continuing its strong earnings track record.
>>> FEATURED STOCK ARTICLE : Hovering Near High After Finding Support at 50-Day Moving Average - 6/4/2021 |
View all notes |
Set NEW NOTE alert |
Company Profile |
SEC
News |
Chart |
Request a new note
C
A
S
I |
MRBK
-
NASDAQ
Meridian Corp
Banks-Northeast
|
$26.44
|
+0.19
0.72% |
$26.72
|
40,383
92.62% of 50 DAV
50 DAV is 43,600
|
$29.18
-9.39%
|
5/18/2021
|
$25.58
|
PP = $28.06
|
|
MB = $29.46
|
Most Recent Note - 6/22/2021 11:46:29 AM
Y - Churned higher than average volume while recently consolidating in a tight range near its 50 DMA line ($26.33). Stalled since reaching a new 52-week high when featured on 5/18/21. Reported Mar '21 earnings +323% on +93% sales revenues versus the year ago period, continuing its strong earnings track record. Recent low ($24.01 on 4/21/21) defines important near-term support where any violation may trigger a worrisome technical sell signal. Its Relative Strength Rating is 75, below the 80 minimum guideline.
>>> FEATURED STOCK ARTICLE : Stalled Yet Found Support at 50-Day Moving Average Line - 6/11/2021 |
View all notes |
Set NEW NOTE alert |
Company Profile |
SEC
News |
Chart |
Request a new note
C
A
S
I |
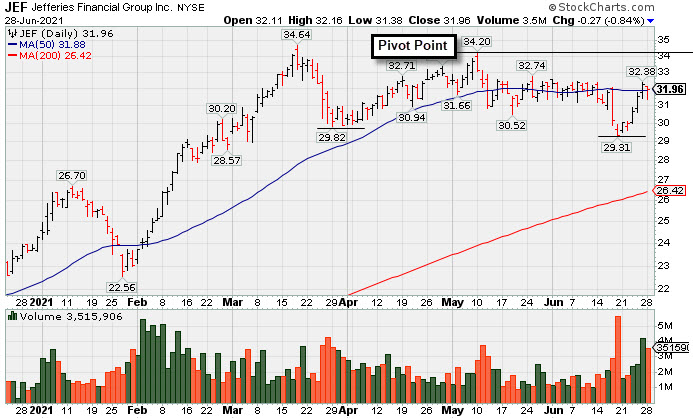
JEF
-
NYSE
Jefferies Financial Grp
Finance-Invest Bnk/Bkrs
|
$31.96
|
-0.27
-0.84% |
$32.16
|
3,511,972
188.41% of 50 DAV
50 DAV is 1,864,000
|
$34.86
-8.32%
|
6/28/2021
|
$31.81
|
PP = $34.42
|
|
MB = $36.14
|
Most Recent Note - 6/28/2021 5:09:59 PM
Y - Ended the session slightly lower after highlighted in yellow with pivot point cited based on its 5/10/21 high while building on a 14-week "double bottom" base. Rebounded near its 50 DMA line and toward its 52-week high. Subsequent gains above the pivot point backed by at least +40% above average volume are necessary to trigger a technical buy signal. The past 3 quarterly comparisons through Feb '21 showed strong earnings increases with solid sales revenues growth. Annual earnings history (the A criteria) has been strong. See the latest FSU analysis for more details and a new annotated graph.
>>> FEATURED STOCK ARTICLE : High-Ranked Financial Firm Formed "Double Bottom" Base - 6/28/2021 |
View all notes |
Set NEW NOTE alert |
Company Profile |
SEC
News |
Chart |
Request a new note
C
A
S
I |
Symbol/Exchange
Company Name
Industry Group |
PRICE |
CHANGE
(%Change) |
Day High |
Volume
(% DAV)
(% 50 day avg vol) |
52 Wk Hi
% From Hi |
Featured
Date |
Price
Featured |
Pivot Featured |
|
Max Buy |
CLAR
-
NASDAQ
Clarus Corporation
Leisure-Products
|
$24.27
|
+0.15
0.62% |
$24.42
|
124,114
58.54% of 50 DAV
50 DAV is 212,000
|
$26.07
-6.90%
|
5/12/2021
|
$21.40
|
PP = $19.73
|
|
MB = $20.72
|
Most Recent Note - 6/21/2021 5:16:54 PM
G - Posted a 2nd consecutive gain today, rebounding after encountering distributional pressure. Still extended from the prior base, its 50 DMA line ($21.29) and prior high ($19.63 on 3/09/21) define support to watch.
>>> FEATURED STOCK ARTICLE : Encountering Distributional Pressure After Recent Rally - 6/17/2021 |
View all notes |
Set NEW NOTE alert |
Company Profile |
SEC
News |
Chart |
Request a new note
C
A
S
I |
AVTR
-
NYSE
Avantor Inc
Medical-Research Eqp/Svc
|
$35.85
|
+0.17
0.48% |
$35.89
|
2,349,297
58.22% of 50 DAV
50 DAV is 4,035,000
|
$35.79
0.17%
|
6/10/2021
|
$32.94
|
PP = $34.09
|
|
MB = $35.79
|
Most Recent Note - 6/24/2021 3:56:38 PM
Y - Stubbornly holding its ground near its all-time high and wedging higher since triggering a technical buy signal. Prior highs in the $33 area define initial support to watch on pullbacks.
>>> FEATURED STOCK ARTICLE : Medical Research Firm Challenging Prior High - 6/10/2021 |
View all notes |
Set NEW NOTE alert |
Company Profile |
SEC
News |
Chart |
Request a new note
C
A
S
I |