You are not logged in.
This means you
CAN ONLY VIEW reports that were published prior to Thursday, April 17, 2025.
You
MUST UPGRADE YOUR MEMBERSHIP if you want to see any current reports.
AFTER MARKET UPDATE - FRIDAY, JUNE 25TH, 2021
Previous After Market Report Next After Market Report >>>
|
|
|
|
DOW |
+237.02 |
34,433.84 |
+0.69% |
|
Volume |
2,846,729,500 |
+251% |
|
Volume |
7,213,666,500 |
+69% |
|
NASDAQ |
-5.25 |
14,364.46 |
-0.04% |
|
Advancers |
1,757 |
55% |
|
Advancers |
2,313 |
56% |
|
S&P 500 |
+14.21 |
4,280.70 |
+0.33% |
|
Decliners |
1,456 |
45% |
|
Decliners |
1,830 |
44% |
|
Russell 2000 |
+0.77 |
2,334.40 |
+0.03% |
|
52 Wk Highs |
213 |
|
|
52 Wk Highs |
208 |
|
|
S&P 600 |
+1.30 |
1,388.76 |
+0.09% |
|
52 Wk Lows |
6 |
|
|
52 Wk Lows |
13 |
|
|
 |
Dow Industrials Led Indices on Mixed Session
Kenneth J. Gruneisen - Passed the CAN SLIM® Master's Exam
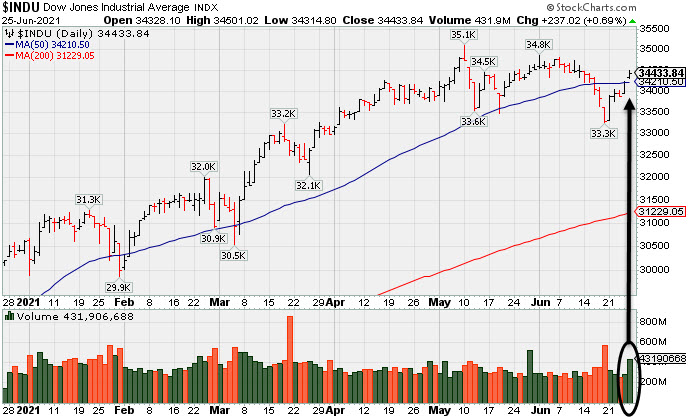
The S&P 500 added 0.3%, notching its 31st record closing high of 2021, and capping its best weekly performance since early February (+2.7%). The tech-heavy Nasdaq Composite drifted from yesterday’s all-time high, edging down 0.1% to pare its weekly gain to 2.4%. The Dow climbed 237 points, lifting the blue chip index up 3.4% on the week. The volume totals reported were lighter than the prior session on the NYSE and on the Nasdaq exchange. Breadth was positive as advancers led decliners by a narrow margin on the NYSE and by a 4-3 margin on the Nasdaq exchange. There were 50 high-ranked companies from the Leaders List that hit new 52-week highs and were listed on the BreakOuts Page, versus 37 on the prior session. New 52-week highs totals expanded and outnumbered shrinking new 52-week lows totals on the NYSE and on the Nasdaq exchange. The major indices (M criteria) are in an uptrend. Investors are reminded to always make buying and selling decisions on case-by-case basis under the strict criteria and rules of the fact-based investment system.
PICTURED: The Dow Jones Industrial Average rebounded above its 50-day moving average (DMA) line.
U.S. stocks finished mixed on Friday, with value-oriented shares regaining momentum versus their growth-related peers. Sentiment remained supported following yesterday’s announcement that a group of bipartisan Senators had reached an agreement on an infrastructure plan. Trading volume picked up steam into the close as investors and fund managers reshuffled holdings to reflect the annual rebalancing of the FTSE Russell indices.
Ten of 11 S&P 500 sectors closed in positive territory, with Technology shares the lone laggard. Financials paced gains as banks shed pandemic-era restrictions on dividends and buybacks after successfully passing the Federal Reserve's annual stress test. In earnings, Nike (NKE +15.53%) after more than doubling consensus earnings estimates, while FedEx (FDX -3.87%) fell as price pressures and labor shortages overshadowed upbeat quarterly figures.
On the data front, the core PCE deflator (the Fed's preferred proxy for inflation) jumped 3.4% year-over-year in May, in-line with expectations, but still the highest reading since April 1992. Separately, personal spending was unchanged last month, though April’s 0.5% increase was upwardly revised to 0.9%. Treasuries weakened, with the yield on the 10-year note up three basis points to 1.52%. In commodities, WTI crude rose 0.9% to $73.99/barrel, capping a fifth consecutive weekly advance. |
 Kenneth J. Gruneisen started out as a licensed stockbroker in August 1987, a couple of months prior to the historic stock market crash that took the Dow Jones Industrial Average down -22.6% in a single day. He has published daily fact-based fundamental and technical analysis on high-ranked stocks online for two decades. Through FACTBASEDINVESTING.COM, Kenneth provides educational articles, news, market commentary, and other information regarding proven investment systems that work in good times and bad.
Comments contained in the body of this report are technical opinions only and are not necessarily those of Gruneisen Growth Corp. The material herein has been obtained from sources believed to be reliable and accurate, however, its accuracy and completeness cannot be guaranteed. Our firm, employees, and customers may effect transactions, including transactions contrary to any recommendation herein, or have positions in the securities mentioned herein or options with respect thereto. Any recommendation contained in this report may not be suitable for all investors and it is not to be deemed an offer or solicitation on our part with respect to the purchase or sale of any securities. |
|
 |
Financial, Tech, and Integrated Oil Indexes Rose
Kenneth J. Gruneisen - Passed the CAN SLIM® Master's Exam
The Broker/Dealer Index ($XBD +0.71%) and Bank Index ($BKX +1.69%) both posted gains while the Retail Index ($RLX -0.50%) edged lower. The Networking Index ($NWX +1.07%) and Biotech Index ($BTK +0.43%) both posted gains while the Semiconductor Index ($SOX -0.38%). The Gold & Silver Index ($XAU -0.84%) and Oil Services Index ($OSX -1.01%) both lost ground while the Integrated Oil Index ($XOI +0.81%) posted a gain. PICTURED: The Broker/Dealer Index ($XBD +0.71%) rebounded above its 50 DMA line toward its record high.
| Oil Services |
$OSX |
66.28 |
-0.67 |
-1.01% |
+49.52% |
| Integrated Oil |
$XOI |
1,175.77 |
+9.42 |
+0.81% |
+48.37% |
| Semiconductor |
$SOX |
3,241.58 |
-12.21 |
-0.38% |
+15.96% |
| Networking |
$NWX |
864.03 |
+9.17 |
+1.07% |
+20.49% |
| Broker/Dealer |
$XBD |
475.88 |
+3.34 |
+0.71% |
+26.03% |
| Retail |
$RLX |
3,936.26 |
-19.94 |
-0.50% |
+10.47% |
| Gold & Silver |
$XAU |
142.03 |
-1.20 |
-0.84% |
-1.50% |
| Bank |
$BKX |
127.35 |
+2.12 |
+1.69% |
+30.06% |
| Biotech |
$BTK |
5,963.87 |
+25.54 |
+0.43% |
+3.92% |
|
|
|
 |
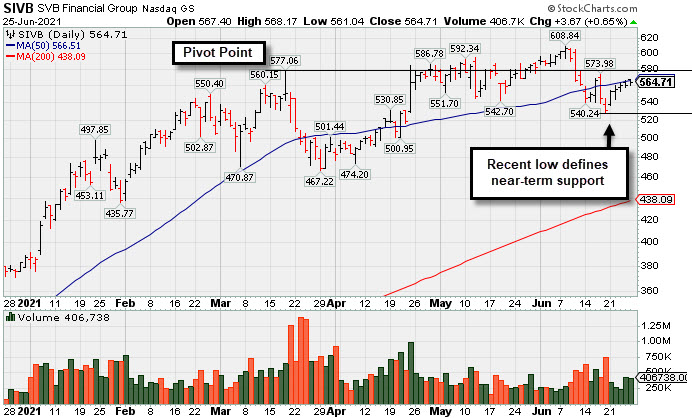
Consolidating Near 50-Day Average After Distributional Pressure
Kenneth J. Gruneisen - Passed the CAN SLIM® Master's Exam
S V B Financial Group (SIVB +$3.67 or +0.65% to $564.71) a has shown resilience after damaging volume-drive losses. It is consolidating near its 50-day moving average (DMA) line ($566). More damaging losses below the recent low ($529.30) would raise greater concerns and trigger a worrisome technical sell signal.
SIVB was highlighted in yellow in the 4/23/21 mid-day report (read here) with a pivot point cited based on its 3/18/21 high plus 10 cents. It wedged higher and then encountered distributional pressure since last shown in this FSU section on 5/20/21 with an annotated graph under the headline, "Sputtering Since Featured Without Confirming Gains".
Its Earnings Per Share Rating is 99. Earnings rose +293% on +64% sales revenues for the Mar '21 quarter versus the year ago period, its 3rd strong comparison above the +25% minimum guideline (C criteria) of the fact-based investment system's guidelines. It has a great annual earnings history (A criteria).
The company completed a new Public Offering on 3/24/21. The number of top-rated funds owning its shares rose from 761 in Mar '17 to 1,713 in Mar '21, a reassuring sign concerning the I criteria. Its current Up/Down Volume ratio of 1.4 is an unbiased indication its shares have been under accumulation over the past 50 days. It has earned a Timeliness rating of A and a Sponsorship Rating of B. There are only 53.8 million shares outstanding (S criteria) which can contribute to greater price volatility in the event of institutional buying or selling. |
|
|
Color Codes Explained :
Y - Better candidates highlighted by our
staff of experts.
G - Previously featured
in past reports as yellow but may no longer be buyable under the
guidelines.
***Last / Change / Volume data in this table is the closing quote data***
Symbol/Exchange
Company Name
Industry Group |
PRICE |
CHANGE
(%Change) |
Day High |
Volume
(% DAV)
(% 50 day avg vol) |
52 Wk Hi
% From Hi |
Featured
Date |
Price
Featured |
Pivot Featured |
|
Max Buy |
 ABCB
-
NASDAQ
ABCB
-
NASDAQ
Ameris Bancorp
BANKING - Regional - Mid-Atlantic Banks
|
$53.02
|
+0.20
0.38% |
$53.55
|
802,120
184.40% of 50 DAV
50 DAV is 435,000
|
$59.85
-11.41%
|
5/21/2021
|
$58.86
|
PP = $57.91
|
|
MB = $60.81
|
Most Recent Note - 6/24/2021 3:52:55 PM
G - Rebounding after last week's damaging losses triggered a worrisome technical sell signal. A rebound above the 50 DMA line (54.21) is needed for its outlook to improve.
>>> FEATURED STOCK ARTICLE : Breakout to New All-Time High for Another Regional Bank - 5/21/2021 |
View all notes |
Set NEW NOTE alert |
Company Profile |
SEC
News |
Chart |
Request a new note
C
A
S
I |
SIVB
-
NASDAQ
S V B Financial Group
BANKING - Regional - Pacific Banks
|
$564.71
|
+3.67
0.65% |
$568.17
|
416,573
99.90% of 50 DAV
50 DAV is 417,000
|
$608.84
-7.25%
|
4/23/2021
|
$579.70
|
PP = $577.16
|
|
MB = $606.02
|
 Most Recent Note - 6/25/2021 5:14:27 PM
G - Consolidating near its 50 DMA line ($566). Confirming gains above the pivot point backed by at least +40% above average volume are still needed to help clinch a convincing technical buy signal. Reported earnings +293% on +64% sales revenues for the Mar '21 quarter versus the year ago period, its 3rd strong comparison. Completed a new Public Offering on 3/24/21. See the latest FSU analysis for more details and a new annotated graph.
>>> FEATURED STOCK ARTICLE : Consolidating Near 50-Day Average After Distributional Pressure - 6/25/2021 |
View all notes |
Set NEW NOTE alert |
Company Profile |
SEC
News |
Chart |
Request a new note
C
A
S
I |
LOGI
-
NASDAQ
Logitech Intl Sa
COMPUTER HARDWARE - Computer Peripherals
|
$120.75
|
-4.89
-3.89% |
$122.49
|
1,458,419
174.24% of 50 DAV
50 DAV is 837,000
|
$140.17
-13.85%
|
5/26/2021
|
$119.13
|
PP = $120.34
|
|
MB = $126.36
|
Most Recent Note - 6/25/2021 5:12:56 PM
Y - Suffered a loss today with higher volume, slumping near prior highs in the $120-117 area which define important support to watch above its 50 DMA line ($118.34).
>>> FEATURED STOCK ARTICLE : Streak of Gains to New Highs Lacked Great Volume Conviction - 5/27/2021 |
View all notes |
Set NEW NOTE alert |
Company Profile |
SEC
News |
Chart |
Request a new note
C
A
S
I |
CROX
-
NASDAQ
Crocs Inc
CONSUMER NON-DURABLES - Textile - Apparel Footwear
|
$114.41
|
+1.29
1.14% |
$117.43
|
2,241,861
126.09% of 50 DAV
50 DAV is 1,778,000
|
$115.37
-0.83%
|
6/14/2021
|
$112.64
|
PP = $110.01
|
|
MB = $115.51
|
Most Recent Note - 6/21/2021 5:20:30 PM
Y - Posted a gain today with lighter volume, halting a streak of 4 consecutive losses. Stalled after hitting a new all-time high on 6/14/21 and slumped back into the previously noted base raising concerns. Its 50 DMA line ($98.32) defines initial support above the prior low ($94.92 on 5/20/21).
>>> FEATURED STOCK ARTICLE : Encountered Distributional Pressure Late This Week - 5/28/2021 |
View all notes |
Set NEW NOTE alert |
Company Profile |
SEC
News |
Chart |
Request a new note
C
A
S
I |
RCKY
-
NASDAQ
Rocky Brands Inc
CONSUMER NON-DURABLES - Textile - Apparel Footwear
|
$55.44
|
+0.44
0.80% |
$57.00
|
157,615
179.11% of 50 DAV
50 DAV is 88,000
|
$69.00
-19.65%
|
5/5/2021
|
$61.65
|
PP = $61.55
|
|
MB = $64.63
|
Most Recent Note - 6/21/2021 5:21:50 PM
G - Posted a gain today with light volume, still sputtering below its 50 DMA line ($56.37). A rebound above that short-term average is needed for its outlook to improve. The prior low ($50.52 on 5/19/21) defines the next important support where any violation may trigger a more worrisome technical sell signal. Fundamentals remain strong.
>>> FEATURED STOCK ARTICLE : Still Sputtering After Slump Below 50-Day Moving Average - 6/7/2021 |
View all notes |
Set NEW NOTE alert |
Company Profile |
SEC
News |
Chart |
Request a new note
C
A
S
I |
Symbol/Exchange
Company Name
Industry Group |
PRICE |
CHANGE
(%Change) |
Day High |
Volume
(% DAV)
(% 50 day avg vol) |
52 Wk Hi
% From Hi |
Featured
Date |
Price
Featured |
Pivot Featured |
|
Max Buy |
CRL
-
NYSE
Charles River Labs Intl
DRUGS - Biotechnology
|
$367.90
|
+1.12
0.31% |
$369.60
|
347,021
49.22% of 50 DAV
50 DAV is 705,000
|
$370.58
-0.72%
|
6/9/2021
|
$345.91
|
PP = $349.23
|
|
MB = $366.69
|
Most Recent Note - 6/21/2021 5:11:52 PM
Y - Posted yet another gain today with below average volume, wedging to new highs. Gains above the pivot point backed by at least +40% above average volume are needed to trigger a proper new (or add-on) technical buy signal. Its 50 DMA line ($333) defines near-term support to watch on pullbacks. Two of the past 3 quarterly comparisons through Mar '21 have been above the +25% minimum earnings guideline (C criteria).
>>> FEATURED STOCK ARTICLE : Building New Base After Strong Quarterly Earnings Report - 6/9/2021 |
View all notes |
Set NEW NOTE alert |
Company Profile |
SEC
News |
Chart |
Request a new note
C
A
S
I |
GNRC
-
NYSE
Generac Hldgs Inc
Electrical-Power/Equipmt
|
$396.05
|
+3.43
0.87% |
$400.64
|
1,531,814
213.05% of 50 DAV
50 DAV is 719,000
|
$409.38
-3.26%
|
6/8/2021
|
$348.46
|
PP = $342.38
|
|
MB = $359.50
|
Most Recent Note - 6/24/2021 12:52:54 PM
G - Reversed into the red today after hitting another new all-time high. Very extended from the previously noted base after a streak of 10 consecutive gains marked by volume. Prior high ($364) defines initial support to watch on pullbacks. Fundamentals remain strong.
>>> FEATURED STOCK ARTICLE : Gap Up Gain With +118% Above Average Volume - 6/8/2021 |
View all notes |
Set NEW NOTE alert |
Company Profile |
SEC
News |
Chart |
Request a new note
C
A
S
I |
CAMT
-
NASDAQ
Camtek Ltd
ELECTRONICS - Scientific and Technical Instrum
|
$37.06
|
-0.33
-0.88% |
$38.20
|
172,468
54.58% of 50 DAV
50 DAV is 316,000
|
$40.47
-8.43%
|
4/28/2021
|
$35.03
|
PP = $35.34
|
|
MB = $37.11
|
Most Recent Note - 6/24/2021 3:48:49 PM
G - Found support this week near prior highs in the $35-36 area after briefly dipping below the previously noted "max buy" level. Its 50 DMA line ($33.73) defines the next important support to watch.
>>> FEATURED STOCK ARTICLE : Perched at 52-Week High After 4th Consecutive Gain - 6/1/2021 |
View all notes |
Set NEW NOTE alert |
Company Profile |
SEC
News |
Chart |
Request a new note
C
A
S
I |
ASML
-
NASDAQ
A S M L Holding N.V. NY
ELECTRONICS - Semiconductor Equipment and Mate
|
$686.21
|
-8.79
-1.26% |
$695.56
|
427,425
51.31% of 50 DAV
50 DAV is 833,000
|
$710.97
-3.48%
|
5/25/2021
|
$669.59
|
PP = $675.75
|
|
MB = $709.54
|
Most Recent Note - 6/24/2021 3:54:43 PM
Y - Consolidating near its all time high after testing the prior high ($675) with a big loss on heavier volume. Highlighted in yellow with pivot point cited based on its 4/26/21 high plus 10 cents. Subsequent gain and a strong close above its pivot point backed by at least +40% above average volume is needed to trigger a proper technical buy signal. Its 50 DMA line ($661) defines important near-term support to watch.
>>> FEATURED STOCK ARTICLE : Perched Near All-Time High After Short Base Above 50-Day Average - 5/26/2021 |
View all notes |
Set NEW NOTE alert |
Company Profile |
SEC
News |
Chart |
Request a new note
C
A
S
I |
BRKS
-
NASDAQ
Brooks Automation
ELECTRONICS - Semiconductor Equipment and Mate
|
$94.27
|
-1.73
-1.80% |
$96.50
|
7,495,071
927.61% of 50 DAV
50 DAV is 808,000
|
$108.72
-13.29%
|
4/5/2021
|
$99.31
|
PP = $91.88
|
|
MB = $96.47
|
Most Recent Note - 6/24/2021 3:51:08 PM
G - Rebounding toward its 50 DMA line ($97.17) which may act as resistance after damaging volume-driven losses. A rebound above the 50 DMA line would help its outlook improve. More damaging losses below the recent low ($86.12 on 5/12/21) would trigger a more worrisome technical sell signal.
>>> FEATURED STOCK ARTICLE : Consolidating Above 50-Day Moving Average Line and Prior High - 6/3/2021 |
View all notes |
Set NEW NOTE alert |
Company Profile |
SEC
News |
Chart |
Request a new note
C
A
S
I |
Symbol/Exchange
Company Name
Industry Group |
PRICE |
CHANGE
(%Change) |
Day High |
Volume
(% DAV)
(% 50 day avg vol) |
52 Wk Hi
% From Hi |
Featured
Date |
Price
Featured |
Pivot Featured |
|
Max Buy |
OPY
-
NYSE
Oppenheimer Holdings Inc
FINANCIAL SERVICES - Investment Brokerage - Regiona
|
$52.34
|
+0.69
1.34% |
$53.28
|
238,332
216.67% of 50 DAV
50 DAV is 110,000
|
$55.75
-6.12%
|
6/7/2021
|
$48.74
|
PP = $52.55
|
|
MB = $55.18
|
Most Recent Note - 6/24/2021 4:00:52 PM
Y - Posted a 2nd consecutive gain with below average volume. Recent slump below prior highs and back into the prior base raised concerns. Its 50 DMA line ($49.06) defines important near term support. Fundamentals remain strong.
>>> FEATURED STOCK ARTICLE : Abrupt Slump Back Into Latest Base With 2 Volume-Driven Losses - 6/18/2021 |
View all notes |
Set NEW NOTE alert |
Company Profile |
SEC
News |
Chart |
Request a new note
C
A
S
I |
MED
-
NYSE
Medifast Inc
SPECIALTY RETAIL - Specialty Retail, Other
|
$276.41
|
-1.99
-0.71% |
$280.00
|
120,727
101.45% of 50 DAV
50 DAV is 119,000
|
$336.99
-17.98%
|
5/11/2021
|
$285.72
|
PP = $279.56
|
|
MB = $293.54
|
Most Recent Note - 6/24/2021 4:44:39 PM
G - Recently rebounded and it is consolidating near the prior high in the $279 area and near its 50 DMA line ($278). More damaging losses below the prior low ($258.77 on ce6/17/21) would raise greater concerns and trigger a worrisome technical sell signal.
>>> FEATURED STOCK ARTICLE : Halted 10-Session Losing Streak Near Prior High and 50 DMA - 6/15/2021 |
View all notes |
Set NEW NOTE alert |
Company Profile |
SEC
News |
Chart |
Request a new note
C
A
S
I |
CLFD
-
NASDAQ
Clearfield Inc
TELECOMMUNICATIONS - Cables / Satalite Equipment
|
$37.24
|
+0.62
1.69% |
$38.04
|
190,247
132.12% of 50 DAV
50 DAV is 144,000
|
$43.64
-14.67%
|
6/4/2021
|
$40.01
|
PP = $40.36
|
|
MB = $42.38
|
Most Recent Note - 6/22/2021 6:36:27 PM
G - Posted a gain today. Its 50 DMA line ($35.97) may act as resistance, while a convincing rebound above its would help its outlook improve. Fundamentals remain strong. See the latest FSU analysis for ore details and a new annotated graph.
>>> FEATURED STOCK ARTICLE : Stalled and Found Support Above 50-Day Moving Average - 5/24/2021 |
View all notes |
Set NEW NOTE alert |
Company Profile |
SEC
News |
Chart |
Request a new note
C
A
S
I |
POOL
-
NASDAQ
Pool Corp
WHOLESALE - Basic Materials Wholesale
|
$455.77
|
-3.26
-0.71% |
$462.47
|
291,479
112.11% of 50 DAV
50 DAV is 260,000
|
$464.03
-1.78%
|
6/21/2021
|
$455.09
|
PP = $449.54
|
|
MB = $472.02
|
Most Recent Note - 6/21/2021 5:10:22 PM
Y - Color code was changed to yellow with pivot point cited based on its 5/10/21 high plus 10 cents. Hit a new 52-week high with today's 3rd consecutive volume-driven gain after an orderly consolidation. The gain and close above the pivot point backed by +85% above average volume clinched a technical buy signal. Reported earnings +227% on +57% sales revenues for the Mar '21 quarter versus the year ago period, its 3rd consecutive comparison well above the +25% minimum earnings guideline (C criteria), helping it better match the fact-based investment system's fundamental guidelines. See the latest FSU analysis for more details and a new annotated graph.
>>> FEATURED STOCK ARTICLE : Volume-Driven Breakout After Orderly Consolidation - 6/21/2021 |
View all notes |
Set NEW NOTE alert |
Company Profile |
SEC
News |
Chart |
Request a new note
C
A
S
I |
FSBW
-
NASDAQ
F S Bancorp
Banks-West/Southwest
|
$71.41
|
-0.05
-0.07% |
$73.50
|
69,868
537.45% of 50 DAV
50 DAV is 13,000
|
$73.62
-3.00%
|
5/18/2021
|
$70.16
|
PP = $73.72
|
|
MB = $77.41
|
Most Recent Note - 6/24/2021 4:41:38 PM
Y - Quiet gain today leaves it perched within close striking distance of the pivot point cited based on its 3/08/21 high plus 10 cents. It has been consolidating above its 50 DMA line ($69.25) where it found prompt support during its ongoing ascent. Subsequent gains above the pivot point backed by at least +40% above average volume are needed to trigger a technical buy signal. See the latest FSU analysis for more details and a new annotated graph.
>>> FEATURED STOCK ARTICLE : Still Consolidating With Close Striking Distance of All-Time High - 6/24/2021 |
View all notes |
Set NEW NOTE alert |
Company Profile |
SEC
News |
Chart |
Request a new note
C
A
S
I |
Symbol/Exchange
Company Name
Industry Group |
PRICE |
CHANGE
(%Change) |
Day High |
Volume
(% DAV)
(% 50 day avg vol) |
52 Wk Hi
% From Hi |
Featured
Date |
Price
Featured |
Pivot Featured |
|
Max Buy |
SMPL
-
NASDAQ
Simply Good Foods Co
Food-Confectionery
|
$35.86
|
-0.28
-0.77% |
$36.45
|
1,515,415
298.90% of 50 DAV
50 DAV is 507,000
|
$37.83
-5.21%
|
12/28/2020
|
$30.40
|
PP = $31.44
|
|
MB = $33.01
|
Most Recent Note - 6/24/2021 1:07:55 PM
G - Hovering near its all-time high following a noted streak of 8 consecutive gains. Near-term support to watch is its 50 DMA line ($34.45) and the prior low ($31.09 on 5/18/21). Reported Feb '21 quarterly earnings +9% on +2% sales revenues versus the year ago period, below the +25% minimum earnings guideline (C criteria), raising fundamental concerns.
>>> FEATURED STOCK ARTICLE : Simply Wedging Into New High Territory - 6/14/2021 |
View all notes |
Set NEW NOTE alert |
Company Profile |
SEC
News |
Chart |
Request a new note
C
A
S
I |
SHOP
-
NYSE
Shopify Inc Cl A
Computer Sftwr-Enterprse
|
$1,473.54
|
-5.45
-0.37% |
$1,489.95
|
1,794,311
124.35% of 50 DAV
50 DAV is 1,443,000
|
$1,552.23
-5.07%
|
6/16/2021
|
$1,343.80
|
PP = $1,499.85
|
|
MB = $1,574.84
|
Most Recent Note - 6/23/2021 12:24:20 PM
Y - The prior gain and close above the pivot point was backed by +51% above average volume helping clinch a technical buy signal. Perched at its all-time high today following a streak of 9 consecutive gains marked by volume. Prior highs define initial support to watch on pullbacks.
>>> FEATURED STOCK ARTICLE : Rebounding After Choppy 4-Month Consolidation - 6/16/2021 |
View all notes |
Set NEW NOTE alert |
Company Profile |
SEC
News |
Chart |
Request a new note
C
A
S
I |
YETI
-
NYSE
Yeti Holdings Inc
Leisure-Products
|
$92.07
|
+3.19
3.59% |
$93.30
|
9,239,026
668.53% of 50 DAV
50 DAV is 1,382,000
|
$95.76
-3.85%
|
5/13/2021
|
$84.20
|
PP = $90.65
|
|
MB = $95.18
|
Most Recent Note - 6/21/2021 5:23:28 PM
G - Posted a gain today with lighter volume breaking a streak of 5 consecutive losses. Only a prompt rebound above the 50 DMA line ($87.59) would help its outlook improve. Prior highs in the $80 area define near-term support to watch on pullbacks. Reported Mar 21 quarterly earnings +245% on +42% sales revenues versus the year ago period, continuing its strong earnings track record.
>>> FEATURED STOCK ARTICLE : Hovering Near High After Finding Support at 50-Day Moving Average - 6/4/2021 |
View all notes |
Set NEW NOTE alert |
Company Profile |
SEC
News |
Chart |
Request a new note
C
A
S
I |
MRBK
-
NASDAQ
Meridian Corp
Banks-Northeast
|
$26.25
|
-0.37
-1.39% |
$26.81
|
713,229
2,425.95% of 50 DAV
50 DAV is 29,400
|
$29.18
-10.04%
|
5/18/2021
|
$25.58
|
PP = $28.06
|
|
MB = $29.46
|
Most Recent Note - 6/22/2021 11:46:29 AM
Y - Churned higher than average volume while recently consolidating in a tight range near its 50 DMA line ($26.33). Stalled since reaching a new 52-week high when featured on 5/18/21. Reported Mar '21 earnings +323% on +93% sales revenues versus the year ago period, continuing its strong earnings track record. Recent low ($24.01 on 4/21/21) defines important near-term support where any violation may trigger a worrisome technical sell signal. Its Relative Strength Rating is 75, below the 80 minimum guideline.
>>> FEATURED STOCK ARTICLE : Stalled Yet Found Support at 50-Day Moving Average Line - 6/11/2021 |
View all notes |
Set NEW NOTE alert |
Company Profile |
SEC
News |
Chart |
Request a new note
C
A
S
I |
CLAR
-
NASDAQ
Clarus Corporation
Leisure-Products
|
$24.12
|
-0.39
-1.59% |
$24.98
|
848,011
443.98% of 50 DAV
50 DAV is 191,000
|
$26.07
-7.48%
|
5/12/2021
|
$21.40
|
PP = $19.73
|
|
MB = $20.72
|
Most Recent Note - 6/21/2021 5:16:54 PM
G - Posted a 2nd consecutive gain today, rebounding after encountering distributional pressure. Still extended from the prior base, its 50 DMA line ($21.29) and prior high ($19.63 on 3/09/21) define support to watch.
>>> FEATURED STOCK ARTICLE : Encountering Distributional Pressure After Recent Rally - 6/17/2021 |
View all notes |
Set NEW NOTE alert |
Company Profile |
SEC
News |
Chart |
Request a new note
C
A
S
I |
Symbol/Exchange
Company Name
Industry Group |
PRICE |
CHANGE
(%Change) |
Day High |
Volume
(% DAV)
(% 50 day avg vol) |
52 Wk Hi
% From Hi |
Featured
Date |
Price
Featured |
Pivot Featured |
|
Max Buy |
AVTR
-
NYSE
Avantor Inc
Medical-Research Eqp/Svc
|
$35.68
|
+0.52
1.48% |
$35.79
|
9,402,797
241.22% of 50 DAV
50 DAV is 3,898,000
|
$35.62
0.17%
|
6/10/2021
|
$32.94
|
PP = $34.09
|
|
MB = $35.79
|
Most Recent Note - 6/24/2021 3:56:38 PM
Y - Stubbornly holding its ground near its all-time high and wedging higher since triggering a technical buy signal. Prior highs in the $33 area define initial support to watch on pullbacks.
>>> FEATURED STOCK ARTICLE : Medical Research Firm Challenging Prior High - 6/10/2021 |
View all notes |
Set NEW NOTE alert |
Company Profile |
SEC
News |
Chart |
Request a new note
C
A
S
I |
|
|
|
THESE ARE NOT BUY RECOMMENDATIONS!
Comments contained in the body of this report are technical
opinions only. The material herein has been obtained
from sources believed to be reliable and accurate, however,
its accuracy and completeness cannot be guaranteed.
This site is not an investment advisor, hence it does
not endorse or recommend any securities or other investments.
Any recommendation contained in this report may not
be suitable for all investors and it is not to be deemed
an offer or solicitation on our part with respect to
the purchase or sale of any securities. All trademarks,
service marks and trade names appearing in this report
are the property of their respective owners, and are
likewise used for identification purposes only.
This report is a service available
only to active Paid Premium Members.
You may opt-out of receiving report notifications
at any time. Questions or comments may be submitted
by writing to Premium Membership Services 665 S.E. 10 Street, Suite 201 Deerfield Beach, FL 33441-5634 or by calling 1-800-965-8307
or 954-785-1121.
|
|
|