You are not logged in.
This means you
CAN ONLY VIEW reports that were published prior to Wednesday, March 19, 2025.
You
MUST UPGRADE YOUR MEMBERSHIP if you want to see any current reports.
AFTER MARKET UPDATE - MONDAY, APRIL 2ND, 2018
Previous After Market Report Next After Market Report >>>
|
|
|
|
DOW |
-458.92 |
23,644.19 |
-1.90% |
|
Volume |
915,374,600 |
-8% |
|
Volume |
2,401,345,390 |
-7% |
|
NASDAQ |
-193.32 |
6,870.12 |
-2.74% |
|
Advancers |
593 |
20% |
|
Advancers |
580 |
19% |
|
S&P 500 |
-58.99 |
2,581.88 |
-2.23% |
|
Decliners |
2,388 |
80% |
|
Decliners |
2,414 |
81% |
|
Russell 2000 |
-36.90 |
1,492.53 |
-2.41% |
|
52 Wk Highs |
16 |
|
|
52 Wk Highs |
20 |
|
|
S&P 600 |
-21.22 |
917.24 |
-2.26% |
|
52 Wk Lows |
133 |
|
|
52 Wk Lows |
155 |
|
|
 |
Breadth Negative as Indices Suffer Deeper Correction
Kenneth J. Gruneisen - Passed the CAN SLIM® Master's Exam
Stocks finished firmly lower Monday. The Dow was down 458 points to 23644. The S&P 500 declined 58 points to 2581 while the Nasdaq Composite dropped 193 points to 6870. The volume totals reported were lighter than the prior session totals on the NYSE and on the Nasdaq exchange, indicative of slightly less institutional selling pressure. However, breadth was solidly negative as decliners led advancers by a 4-1 margin on the NYSE and on the Nasdaq exchange. There were 9 high-ranked companies from the Leaders List that made new 52-week highs and were listed on the BreakOuts Page, versus the total of 19 on the prior session. New 52-week lows totals outnumbered shrinking new 52-week highs totals on the NYSE and on the Nasdaq exchange. Charts used courtesy of www.stockcharts.com
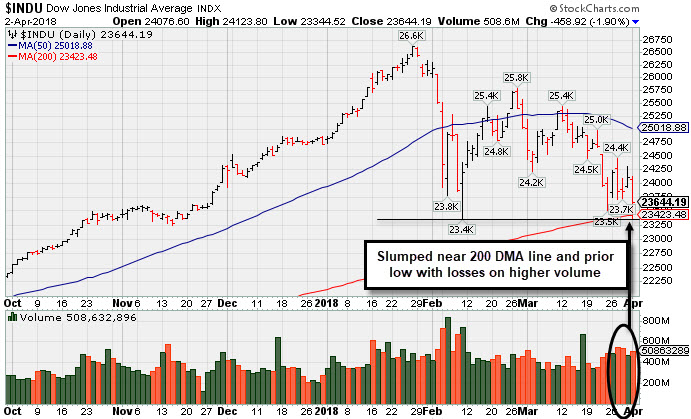 PICTURED: The Dow Jones Industrial Average Index ended the session -11.2% off its record high hit on January 26th. The prior low and 200 DMA line (23.423) define important near-term support.
The major indices (M criteria) have shown weakness indicative of a correction. Investors following the fact-based investment system reduce market exposure during weak market periods by selling any stocks triggering technical sell signals on a case-by-case basis. Once a new confirmed rally with a solid follow through day occurs it will be noted and new buying efforts will again be justified only when all key criteria of the fact-based investment system are satisfied. The Featured Stocks Page provides the most timely analysis on high-ranked leaders.
The major averages extended first quarter losses with the S&P 500 falling below its technically significant 200-day moving average for the first time since June 2016. U.S. equities were pressured by a continued sell-off of Tech stocks as well as trade concerns after China announced tariffs on 128 varieties of U.S. agricultural imports. On the data front, a report from ISM showed manufacturing growth was still strong despite slowing in March amid declining new orders. A separate report showed February construction spending increased slightly. The March jobs report on Friday will also garner investor attention.
All 11 sectors in the S&P 500 finished lower with Consumer Discretionary and Technology sectors falling by at least 2.4% on the session. Shares of Amazon (AMZN -5.21%) fell. Intel (INTC -6.07%) tumbled on reports Apple (AAPL -0.66%) is planning to discontinue the use of the company’s chips in Mac computers. Humana (HUM + 4.42%) was a notable gainer on news the insurer is in merger talks with retailer Walmart (WMT -3.84%).
Treasury yields were little changed with the 10-year note flat at 2.74%. In commodities, NYMEX WTI crude dropped 2.7% to $63.17/barrel. COMEX gold advanced 1.3% to $1340.20/ounce. |
 Kenneth J. Gruneisen started out as a licensed stockbroker in August 1987, a couple of months prior to the historic stock market crash that took the Dow Jones Industrial Average down -22.6% in a single day. He has published daily fact-based fundamental and technical analysis on high-ranked stocks online for two decades. Through FACTBASEDINVESTING.COM, Kenneth provides educational articles, news, market commentary, and other information regarding proven investment systems that work in good times and bad.
Comments contained in the body of this report are technical opinions only and are not necessarily those of Gruneisen Growth Corp. The material herein has been obtained from sources believed to be reliable and accurate, however, its accuracy and completeness cannot be guaranteed. Our firm, employees, and customers may effect transactions, including transactions contrary to any recommendation herein, or have positions in the securities mentioned herein or options with respect thereto. Any recommendation contained in this report may not be suitable for all investors and it is not to be deemed an offer or solicitation on our part with respect to the purchase or sale of any securities. |
|
 |
Retail, Tech, and Financial Groups Led Widespread Declines
Kenneth J. Gruneisen - Passed the CAN SLIM® Master's Exam
On Monday the Retail Index ($RLX -3.88%) was a standout decliner while the Broker/Dealer Index ($XBD -1.98%) and the Bank Index ($BKX -2.01%) both also dragged the major indices lower. The Biotechnology Index ($BTK -4.88%) and Semiconductor Index ($SOX -3.90%) led the tech sector lower while the Networking Index ($NWX -1.41%) also fell. Commodity linked groups were mixed as the Gold & Silver Index ($XAU +1.10%) rose, but the Oil Services Index ($OSX -2.63%) and Integrated Oil Index ($XOI -2.02%) each ended solidly lower. Charts courtesy wwwstockcharts.com
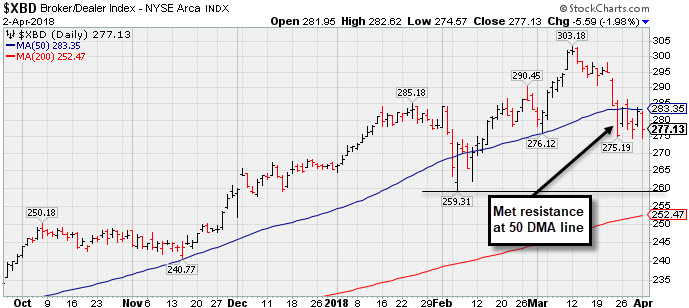 PICTURED: The Broker/Dealer Index ($XBD -1.98%) has slumped below its 50-day moving average (DMA) line and met resistance when recently trying to rebound.
| Oil Services |
$OSX |
132.13 |
-3.56 |
-2.62% |
-11.65% |
| Integrated Oil |
$XOI |
1,300.00 |
-26.80 |
-2.02% |
-2.66% |
| Semiconductor |
$SOX |
1,277.01 |
-51.89 |
-3.90% |
+1.91% |
| Networking |
$NWX |
519.26 |
-7.44 |
-1.41% |
+5.86% |
| Broker/Dealer |
$XBD |
277.13 |
-5.59 |
-1.98% |
+4.48% |
| Retail |
$RLX |
1,854.77 |
-74.83 |
-3.88% |
+6.98% |
| Gold & Silver |
$XAU |
82.01 |
+0.89 |
+1.10% |
-3.82% |
| Bank |
$BKX |
104.35 |
-2.15 |
-2.02% |
-2.21% |
| Biotech |
$BTK |
4,284.55 |
-219.68 |
-4.88% |
+1.48% |
|
|
|
 |
Slumped Back Into Prior Base Testing 50-Day Average
Kenneth J. Gruneisen - Passed the CAN SLIM® Master's Exam
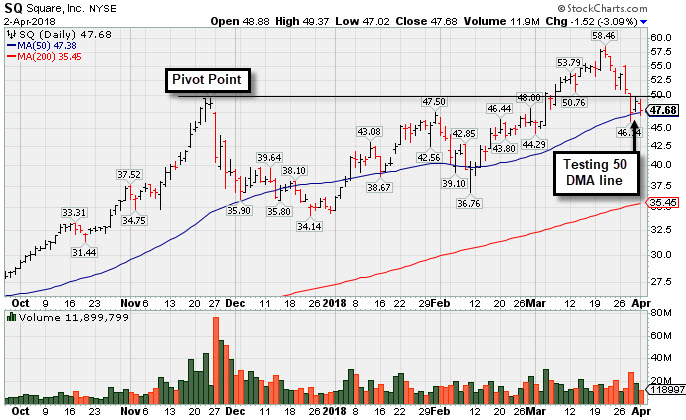
Square Inc Cl A (SQ -$1.52 or -3.09% to $47.68) suffered another big loss today but with lighter volume. More damaging losses would raise greater concerns. On 3/28/18 it was noted as it fell back into the prior base with a big loss on heavy volume, testing its 50-day moving average (DMA) line ($47.38) and prior highs in the $47-49 area defining important support.
It finished strong after highlighted in yellow with pivot point cited based on its 11/24/17 high plus 10 cents in the 3/05/18 mid-day report (read here). It hit a new all-time high and triggered a technical buy signal with +108% above average volume while rising from a choppy "late-stage" base.
Fundamentals remain strong. Recent quarterly comparisons through Dec '17 showed strong sales revenues growth acceleration and solid earnings increases versus the year-ago periods. Sales revenues rose by +21%, +22%, +26%, +33%, and +36% in the Dec 16, Mar, Jun, Sep and Dec '17 quarterly comparisons versus the year ago periods, respectively. Its limited annual earnings (A criteria) history remains a concern, yet it had a profitable FY '16 and bigger FY '17 following its $9 IPO in Nov '15.
The number of top-rated funds owning its shares rose from 314 in Mar '17 to 619 in Dec '17, a reassuring sign concerning the I criteria. Its current Up/Down Volume Ratio of 1.4 is also an unbiased indication its shares have been under accumulation over the past 50 days. It has a Timeliness Rating of A and Sponsorship rating of B.
|
|
|
Color Codes Explained :
Y - Better candidates highlighted by our
staff of experts.
G - Previously featured
in past reports as yellow but may no longer be buyable under the
guidelines.
***Last / Change / Volume data in this table is the closing quote data***
Symbol/Exchange
Company Name
Industry Group |
PRICE |
CHANGE
(%Change) |
Day High |
Volume
(% DAV)
(% 50 day avg vol) |
52 Wk Hi
% From Hi |
Featured
Date |
Price
Featured |
Pivot Featured |
|
Max Buy |
SIVB
-
NASDAQ
S V B Financial Group
BANKING - Regional - Pacific Banks
|
$233.42
|
-6.59
-2.75% |
$240.94
|
793,657
111.47% of 50 DAV
50 DAV is 712,000
|
$271.79
-14.12%
|
3/12/2018
|
$267.79
|
PP = $263.19
|
|
MB = $276.35
|
Most Recent Note - 3/28/2018 1:20:40 PM
G - Met resistance and slumped further after violating its 50 DMA line triggering a technical sell signal. Only a prompt rebound above the 50 DMA line ($252) would help its outlook improve.
>>> FEATURED STOCK ARTICLE : Endured Distributional Pressure After Wedging Higher - 3/12/2018 |
View all notes |
Set NEW NOTE alert |
Company Profile |
SEC
News |
Chart |
Request a new note
C
A
S
I |
TPL
-
NYSE
Texas Pacific Land Trust
FINANCIAL SERVICES - Diversified Investments
|
$508.50
|
+3.08
0.61% |
$515.80
|
8,804
58.69% of 50 DAV
50 DAV is 15,000
|
$569.99
-10.79%
|
2/20/2018
|
$517.00
|
PP = $569.99
|
|
MB = $598.49
|
Most Recent Note - 3/28/2018 1:26:29 PM
G - A rebound above the 50 DMA line ($520) is needed for its outlook to improve. Today's loss is testing the prior low ($480 on 2/09/18) and more damaging losses may trigger a worrisome technical sell signal. Reported earnings +29% on +118% sales revenues for the Dec '17 quarter.
>>> FEATURED STOCK ARTICLE : Slump Under 50-Day Average Line Hurt Near Term Outlook - 3/23/2018 |
View all notes |
Set NEW NOTE alert |
Company Profile |
SEC
News |
Chart |
Request a new note
C
A
S
I |
LMAT
-
NASDAQ
Lemaitre Vascular Inc
Medical-Products
|
$35.61
|
-0.62
-1.71% |
$36.19
|
135,597
104.31% of 50 DAV
50 DAV is 130,000
|
$39.88
-10.71%
|
3/19/2018
|
$36.77
|
PP = $39.98
|
|
MB = $41.98
|
 Most Recent Note - 4/2/2018 4:55:41 PM
Y - Remains consolidating near its 50 DMA line ($35.41) perched within striking distance of the new pivot point cited based on its 10/20/17 high plus 10 cents. Subsequent volume-driven gains for new highs are needed to trigger a technical buy signal.
>>> FEATURED STOCK ARTICLE : Rebounding Near High After Choppy Consolidation - 3/19/2018 |
View all notes |
Set NEW NOTE alert |
Company Profile |
SEC
News |
Chart |
Request a new note
C
A
S
I |
PETS
-
NASDAQ
Petmed Express Inc
RETAIL - Drug Stores
|
$41.22
|
-0.53
-1.27% |
$42.35
|
486,519
70.71% of 50 DAV
50 DAV is 688,000
|
$57.80
-28.69%
|
1/19/2018
|
$53.59
|
PP = $51.00
|
|
MB = $53.55
|
Most Recent Note - 4/2/2018 5:01:01 PM
It will be dropped from the Featured Stocks list tonight. Sputtering below its 200 DMA line. A rebound above the 50 DMA line ($45.24) is needed for its outlook to improve. Faces near-term resistance due to overhead supply up to the $57 level.
>>> FEATURED STOCK ARTICLE : Recently Endured Distributional Pressure - 3/15/2018 |
View all notes |
Set NEW NOTE alert |
Company Profile |
SEC
News |
Chart |
Request a new note
C
A
S
I |
DPZ
-
NYSE
Dominos Pizza Inc
WHOLESALE - Food Wholesale
|
$230.42
|
-3.14
-1.34% |
$236.93
|
731,473
72.49% of 50 DAV
50 DAV is 1,009,000
|
$236.00
-2.36%
|
2/20/2018
|
$224.86
|
PP = $222.01
|
|
MB = $233.11
|
Most Recent Note - 3/29/2018 5:31:46 PM
Y - Still quietly hovering near its high. Stalled soon after highlighted in the 2/20/18 mid-day report with pivot point cited based on its 1/25/18 high plus 10 cents.
>>> FEATURED STOCK ARTICLE : Popular Pizza Firm Perched Near All Time High - 3/21/2018 |
View all notes |
Set NEW NOTE alert |
Company Profile |
SEC
News |
Chart |
Request a new note
C
A
S
I |
Symbol/Exchange
Company Name
Industry Group |
PRICE |
CHANGE
(%Change) |
Day High |
Volume
(% DAV)
(% 50 day avg vol) |
52 Wk Hi
% From Hi |
Featured
Date |
Price
Featured |
Pivot Featured |
|
Max Buy |
FIVE
-
NASDAQ
Five Below Inc
Retail-DiscountandVariety
|
$72.27
|
-1.07
-1.46% |
$73.86
|
1,326,353
116.24% of 50 DAV
50 DAV is 1,141,000
|
$73.55
-1.74%
|
3/9/2018
|
$68.58
|
PP = $73.65
|
|
MB = $77.33
|
Most Recent Note - 4/2/2018 4:50:41 PM
Y - Touched a new high today but finished lower. Reported earnings +31% on +30% sales revenues for the Jan '18 quarter, continuing its strong earnings track record. New pivot point was cited based on its 1/05/18 high plus 10 cents. Subsequent volume-driven gains above the pivot point may trigger a new (or add-on) technical buy signal. Its 50 DMA line ($67.22) defines important near-term support to watch on pullbacks.
>>> FEATURED STOCK ARTICLE : Retailer Rebounding Within Striking Distance of Prior High - 3/9/2018 |
View all notes |
Set NEW NOTE alert |
Company Profile |
SEC
News |
Chart |
Request a new note
C
A
S
I |
SPLK
-
NASDAQ
Splunk Inc
Computer Sftwr-Database
|
$97.37
|
-1.02
-1.04% |
$99.16
|
1,622,674
80.85% of 50 DAV
50 DAV is 2,007,000
|
$112.66
-13.57%
|
2/15/2018
|
$96.06
|
PP = $93.68
|
|
MB = $98.36
|
Most Recent Note - 3/29/2018 12:51:06 PM
Y - Finding support near its 50 DMA ($96.92) line and prior high in the $97 area. Pulled back below its "max buy" level this week. Subsequent damaging losses would raise concerns and trigger a more worrisome technical sell signal.
>>> FEATURED STOCK ARTICLE : Extended After Rallying from Secondary Buy Point - 3/20/2018 |
View all notes |
Set NEW NOTE alert |
Company Profile |
SEC
News |
Chart |
Request a new note
C
A
S
I |
PAYC
-
NYSE
Paycom Software Inc
COMPUTER SOFTWARE and SERVICES - Application Software
|
$103.88
|
-3.51
-3.27% |
$107.60
|
841,526
104.67% of 50 DAV
50 DAV is 804,000
|
$115.48
-10.05%
|
2/15/2018
|
$95.01
|
PP = $93.61
|
|
MB = $98.29
|
Most Recent Note - 3/28/2018 1:11:55 PM
G - Very extended from any sound base, and there was a "negative reversal" on the prior session after hitting another new all-time high. Its 50 DMA line ($98.15) defines near-term support above prior highs in the $93 area. Fundamentals remain strong.
>>> FEATURED STOCK ARTICLE : Extended From Prior Base After Streak of Gains - 3/7/2018 |
View all notes |
Set NEW NOTE alert |
Company Profile |
SEC
News |
Chart |
Request a new note
C
A
S
I |
GRUB
-
NYSE
Grubhub Inc
COMPUTER SOFTWARE and SERVICES - Technical and System Software
|
$97.59
|
-3.88
-3.82% |
$101.97
|
1,534,025
77.20% of 50 DAV
50 DAV is 1,987,000
|
$112.41
-13.18%
|
6/21/2017
|
$47.33
|
PP = $46.94
|
|
MB = $49.29
|
Most Recent Note - 3/29/2018 5:30:53 PM
G - Posted a gain today. Enduring distributional pressure in recent weeks. Remains extended from any sound base. Its 50 DMA line ($92.38) defines near-term support. Recently reported earnings +61% on +49% sales revenues for the Dec '17 quarter. See the latest FSU analysis for more details and a new annotated graph.
>>> FEATURED STOCK ARTICLE : Very Extended and Enduring Distributional Pressure - 3/29/2018 |
View all notes |
Set NEW NOTE alert |
Company Profile |
SEC
News |
Chart |
Request a new note
C
A
S
I |
HQY
-
NASDAQ
Healthequity Inc
COMPUTER SOFTWARE and SERVICES - Healthcare Information Service
|
$60.39
|
-0.15
-0.25% |
$62.32
|
669,649
87.54% of 50 DAV
50 DAV is 765,000
|
$68.75
-12.16%
|
2/20/2018
|
$56.37
|
PP = $55.41
|
|
MB = $58.18
|
Most Recent Note - 4/2/2018 4:54:09 PM
G - Hovering near its all-time high, extended from any sound base. Prior highs in the $55 area define initial support along with its 50 DMA line. Reported earnings +57% on +29% sales revenues for the Jan '18 quarter versus the year ago period.
>>> FEATURED STOCK ARTICLE : Bullish Action Followed Latest Earnings Report - 3/22/2018 |
View all notes |
Set NEW NOTE alert |
Company Profile |
SEC
News |
Chart |
Request a new note
C
A
S
I |
Symbol/Exchange
Company Name
Industry Group |
PRICE |
CHANGE
(%Change) |
Day High |
Volume
(% DAV)
(% 50 day avg vol) |
52 Wk Hi
% From Hi |
Featured
Date |
Price
Featured |
Pivot Featured |
|
Max Buy |
LOB
-
NASDAQ
Live Oak Bancshares Inc
Banks-Southeast
|
$27.30
|
-0.50
-1.80% |
$27.95
|
102,866
69.98% of 50 DAV
50 DAV is 147,000
|
$30.05
-9.15%
|
3/16/2018
|
$28.63
|
PP = $28.30
|
|
MB = $29.72
|
Most Recent Note - 4/2/2018 5:07:34 PM
Y - Slumped further below its pivot point and tested its 50 DMA line ($26.99) with today's loss on light volume. More damaging losses would raise greater concerns.
>>> FEATURED STOCK ARTICLE : Tallied Volume-Driven Gain for New High - 3/16/2018 |
View all notes |
Set NEW NOTE alert |
Company Profile |
SEC
News |
Chart |
Request a new note
C
A
S
I |
PYPL
-
NASDAQ
Paypal Holdings Inc
Finance-CrdtCard/PmtPr
|
$75.00
|
-0.87
-1.15% |
$76.30
|
11,291,144
109.05% of 50 DAV
50 DAV is 10,354,000
|
$86.32
-13.11%
|
2/1/2018
|
$80.35
|
PP = $79.49
|
|
MB = $83.46
|
Most Recent Note - 4/2/2018 5:02:46 PM
G - Still sputtering below its 50 DMA line ($79.27). A rebound above that important short-term average is needed for its outlook to improve. The prior low ($71.63 on 2/09/18) defines the next important support level where a violation would raise concerns and trigger a more worrisome technical sell signal.
>>> FEATURED STOCK ARTICLE : Sputtering Below 50-Day Moving Average Again - 3/27/2018 |
View all notes |
Set NEW NOTE alert |
Company Profile |
SEC
News |
Chart |
Request a new note
C
A
S
I |
OLLI
-
NASDAQ
Ollie's Bargain Outlet
Retail-DiscountandVariety
|
$59.20
|
-1.10
-1.82% |
$60.30
|
507,424
104.19% of 50 DAV
50 DAV is 487,000
|
$62.05
-4.59%
|
11/21/2017
|
$46.78
|
PP = $47.00
|
|
MB = $49.35
|
Most Recent Note - 4/2/2018 4:58:25 PM
G - Consolidating in an orderly fashion near its all-time high. Its 50 DMA line ($57.85) and prior low ($54.44 on 3/09/18) define near-term support.
>>> FEATURED STOCK ARTICLE : Bargain Outlet's Shares Perched Near All-Time Price High - 3/13/2018 |
View all notes |
Set NEW NOTE alert |
Company Profile |
SEC
News |
Chart |
Request a new note
C
A
S
I |
WB
-
NASDAQ
Weibo Corp Cl A Ads
INTERNET - Content
|
$115.81
|
-3.73
-3.12% |
$119.43
|
1,630,435
80.63% of 50 DAV
50 DAV is 2,022,000
|
$142.12
-18.51%
|
1/16/2018
|
$126.33
|
PP = $122.21
|
|
MB = $128.32
|
Most Recent Note - 4/2/2018 5:09:33 PM
G - Still sputtering below its 50 DMA line ($129) after damaging volume-driven losses. A rebound above that short-term average is needed for its outlook to improve.
>>> FEATURED STOCK ARTICLE : Recent Consolidation is Not a New Base of Sufficient Length - 3/8/2018 |
View all notes |
Set NEW NOTE alert |
Company Profile |
SEC
News |
Chart |
Request a new note
C
A
S
I |
SQ
-
NYSE
Square Inc Cl A
Finance-CrdtCard/PmtPr
|
$47.68
|
-1.52
-3.09% |
$49.37
|
11,899,799
75.89% of 50 DAV
50 DAV is 15,681,000
|
$58.46
-18.44%
|
3/5/2018
|
$49.70
|
PP = $49.66
|
|
MB = $52.14
|
Most Recent Note - 4/2/2018 6:05:42 PM
Y - Still testing its 50 DMA line ($47.38) and prior highs in the $47-49 area defining important support. Suffered a big loss 3/28/18 on heavy volume falling back into the prior base, More damaging losses would raise greater concerns. See the latest FSU analysis for more details and a new annotated graph.
>>> FEATURED STOCK ARTICLE : Slumped Back Into Prior Base Testing 50-Day Average - 4/2/2018 |
View all notes |
Set NEW NOTE alert |
Company Profile |
SEC
News |
Chart |
Request a new note
C
A
S
I |
Symbol/Exchange
Company Name
Industry Group |
PRICE |
CHANGE
(%Change) |
Day High |
Volume
(% DAV)
(% 50 day avg vol) |
52 Wk Hi
% From Hi |
Featured
Date |
Price
Featured |
Pivot Featured |
|
Max Buy |
SEND
-
NYSE
Sendgrid Inc
INTERNET - Content
|
$26.68
|
-1.46
-5.19% |
$28.37
|
196,632
87.78% of 50 DAV
50 DAV is 224,000
|
$32.03
-16.69%
|
3/6/2018
|
$28.00
|
PP = $28.37
|
|
MB = $29.79
|
Most Recent Note - 4/2/2018 5:05:39 PM
Y - Undercut prior highs in the $27-28 area raising concerns and it ended near the session low with a big loss on higher (near average) volume. Disciplined investors always limit losses by selling any stock that falls more than -7% from their purchase price.
>>> FEATURED STOCK ARTICLE : Recently Profitable Internet - Content Firm Rallied to New High - 3/6/2018 |
View all notes |
Set NEW NOTE alert |
Company Profile |
SEC
News |
Chart |
Request a new note
C
A
S
I |
|
|
|
THESE ARE NOT BUY RECOMMENDATIONS!
Comments contained in the body of this report are technical
opinions only. The material herein has been obtained
from sources believed to be reliable and accurate, however,
its accuracy and completeness cannot be guaranteed.
This site is not an investment advisor, hence it does
not endorse or recommend any securities or other investments.
Any recommendation contained in this report may not
be suitable for all investors and it is not to be deemed
an offer or solicitation on our part with respect to
the purchase or sale of any securities. All trademarks,
service marks and trade names appearing in this report
are the property of their respective owners, and are
likewise used for identification purposes only.
This report is a service available
only to active Paid Premium Members.
You may opt-out of receiving report notifications
at any time. Questions or comments may be submitted
by writing to Premium Membership Services 665 S.E. 10 Street, Suite 201 Deerfield Beach, FL 33441-5634 or by calling 1-800-965-8307
or 954-785-1121.
|
|
|