Symbol/Exchange
Company Name
Industry Group |
PRICE |
CHANGE
(%Change) |
Day High |
Volume
(% DAV)
(% 50 day avg vol) |
52 Wk Hi
% From Hi |
Featured
Date |
Price
Featured |
Pivot Featured |
|
Max Buy |
THO
-
NYSE
Thor Industries Inc
AUTOMOTIVE - Recreational Vehicles
|
$108.59
|
+1.26
1.17% |
$109.91
|
627,856
75.46% of 50 DAV
50 DAV is 832,000
|
$115.74
-6.18%
|
6/7/2017
|
$102.95
|
PP = $98.92
|
|
MB = $103.87
|
Most Recent Note - 6/22/2017 8:45:57 PM
G - Stubbornly holding its ground just above its "max buy" level. Disciplined investors avoid chasing extended stocks.
>>> FEATURED STOCK ARTICLE : Some Overhead Supply Remains After Latest Technical Breakout - 6/8/2017 |
View all notes |
Set NEW NOTE alert |
Company Profile |
SEC
News |
Chart |
Request a new note
C
A
S
I |
SBCF
-
NASDAQ
Seacoast Banking Corp Fl
BANKING - Regional - Mid-Atlantic Banks
|
$23.86
|
+0.44
1.88% |
$23.92
|
344,453
104.38% of 50 DAV
50 DAV is 330,000
|
$25.88
-7.81%
|
6/9/2017
|
$24.13
|
PP = $25.98
|
|
MB = $27.28
|
Most Recent Note - 6/26/2017 6:11:33 PM
Y - Consolidating near its 50 DMA line and still within striking distance of the new pivot point cited based on its 4/25/17 high. Previously noted - "Subsequent volume-driven gains for new highs may trigger a new technical buy signal. Fundamentals remain strong."
>>> FEATURED STOCK ARTICLE : Relative Strength Rating Slumped After Lingering Below 50 DMA - 5/25/2017 |
View all notes |
Set NEW NOTE alert |
Company Profile |
SEC
News |
Chart |
Request a new note
C
A
S
I |
BLMT
-
NASDAQ
B S B Bancorp Inc
BANKING - Regional - Midwest Banks
|
$29.20
|
+0.20
0.69% |
$29.55
|
29,866
157.19% of 50 DAV
50 DAV is 19,000
|
$30.75
-5.04%
|
6/16/2017
|
$29.85
|
PP = $29.80
|
|
MB = $31.29
|
 Most Recent Note - 6/28/2017 12:15:53 PM
G - Consolidating near its 50 DMA line after encountering distributional pressure. Its Relative Strength rating has slumped to 72, below the 80+ minimum guideline for buy candidates.
>>> FEATURED STOCK ARTICLE : Perched Near High After Volume-Driven Gains - 6/16/2017 |
View all notes |
Set NEW NOTE alert |
Company Profile |
SEC
News |
Chart |
Request a new note
C
A
S
I |
BERY
-
NYSE
Berry Global Group Inc
CONSUMER NON-DURABLES - Packaging and Containers
|
$57.99
|
+0.35
0.61% |
$58.45
|
714,639
62.31% of 50 DAV
50 DAV is 1,147,000
|
$58.95
-1.63%
|
5/26/2017
|
$58.31
|
PP = $57.04
|
|
MB = $59.89
|
Most Recent Note - 6/22/2017 8:43:42 PM
Y - Still consolidating in a tight range above its pivot point, quietly holding its ground near its 52-week high. The 50 DMA line ($55.04) defines near term support.
>>> FEATURED STOCK ARTICLE : Rising From Advanced Base With Above Average Volume - 5/26/2017 |
View all notes |
Set NEW NOTE alert |
Company Profile |
SEC
News |
Chart |
Request a new note
C
A
S
I |
EW
-
NYSE
Edwards Lifesciences Cp
HEALTH SERVICES - Medical Appliances and Equipment
|
$118.39
|
+1.26
1.08% |
$118.77
|
594,694
40.96% of 50 DAV
50 DAV is 1,452,000
|
$121.75
-2.76%
|
5/16/2017
|
$114.12
|
PP = $113.04
|
|
MB = $118.69
|
Most Recent Note - 6/26/2017 6:08:30 PM
G - Perched within close striking distance of its all-time high. See the latest FSU analysis for more details and a new annotated graph.
>>> FEATURED STOCK ARTICLE : Medical Products Firm Perched Near All-Time High - 6/26/2017 |
View all notes |
Set NEW NOTE alert |
Company Profile |
SEC
News |
Chart |
Request a new note
C
A
S
I |
Symbol/Exchange
Company Name
Industry Group |
PRICE |
CHANGE
(%Change) |
Day High |
Volume
(% DAV)
(% 50 day avg vol) |
52 Wk Hi
% From Hi |
Featured
Date |
Price
Featured |
Pivot Featured |
|
Max Buy |
NTES
-
NASDAQ
Netease Inc Adr
INTERNET - Internet Information Providers
|
$317.43
|
+5.93
1.90% |
$317.76
|
1,194,846
88.05% of 50 DAV
50 DAV is 1,357,000
|
$337.55
-5.96%
|
6/8/2017
|
$310.76
|
PP = $307.62
|
|
MB = $323.00
|
Most Recent Note - 6/26/2017 6:13:58 PM
Y - There was a "negative reversal" today after hitting a new high following 6 consecutive gains, and its color code is changed to yellow after pulling back below the "max buy" level. Recent gains lacked great volume conviction. Fundamentals remain strong and it reported earnings +52% on +62% sales revenues for the Mar '17 quarter.
>>> FEATURED STOCK ARTICLE : Encountered Distributional Pressure After Hitting New Highs - 6/9/2017 |
View all notes |
Set NEW NOTE alert |
Company Profile |
SEC
News |
Chart |
Request a new note
C
A
S
I |
STMP
-
NASDAQ
Stamps.com Inc
INTERNET - Internet Software and Services
|
$153.50
|
+3.45
2.30% |
$153.90
|
285,322
42.27% of 50 DAV
50 DAV is 675,000
|
$153.25
0.16%
|
5/24/2017
|
$133.10
|
PP = $136.10
|
|
MB = $142.91
|
Most Recent Note - 6/27/2017 6:02:26 PM
G - There was a "negative reversal" today for a loss on light volume after hitting a new 52-week high. It is extended from its prior base. Prior high ($136 on 2/22/17) defines near term support to watch.
>>> FEATURED STOCK ARTICLE : Rallying From Bottom of 13-Week Cup Shaped Base - 5/24/2017 |
View all notes |
Set NEW NOTE alert |
Company Profile |
SEC
News |
Chart |
Request a new note
C
A
S
I |
MELI
-
NASDAQ
Mercadolibre Inc
INTERNET - Internet Software and; Services
|
$262.31
|
+6.53
2.55% |
$263.23
|
917,005
146.96% of 50 DAV
50 DAV is 624,000
|
$297.95
-11.96%
|
6/15/2017
|
$261.73
|
PP = $297.95
|
|
MB = $312.85
|
Most Recent Note - 6/27/2017 5:52:59 PM
G - Color code is changed to green after gapping down today, closing near the session low after violating its 50 DMA line ($264.92) with a big loss on higher (near average) volume, raising concerns. Prior reports cautioned - "More damaging losses would raise concerns and hurt its outlook.".
>>> FEATURED STOCK ARTICLE : Test of 10-Week Moving Average May Be a Secondary Buy Point - 6/15/2017 |
View all notes |
Set NEW NOTE alert |
Company Profile |
SEC
News |
Chart |
Request a new note
C
A
S
I |
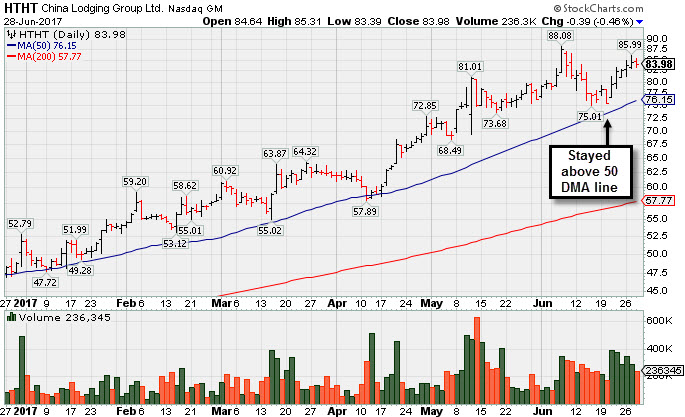
HTHT
-
NASDAQ
China Lodging Group Ads
LEISURE - Lodging
|
$83.98
|
-0.39
-0.46% |
$85.31
|
236,345
99.72% of 50 DAV
50 DAV is 237,000
|
$88.08
-4.65%
|
9/29/2016
|
$46.12
|
PP = $47.82
|
|
MB = $50.21
|
Most Recent Note - 6/28/2017 7:28:32 PM
G - Extended from any sound base and consolidating above its 50 DMA line ($76.15) defining important near-term support to watch. See the latest FSU analysis for more details and a new annotated graph.
>>> FEATURED STOCK ARTICLE : China-Based Hotel Firm is Extended From Any Sound Base - 6/28/2017 |
View all notes |
Set NEW NOTE alert |
Company Profile |
SEC
News |
Chart |
Request a new note
C
A
S
I |
BEAT
-
NASDAQ
BioTelemetry Inc
Medical-Services
|
$32.40
|
+1.30
4.18% |
$32.75
|
391,191
73.53% of 50 DAV
50 DAV is 532,000
|
$34.00
-4.71%
|
2/14/2017
|
$25.10
|
PP = $24.55
|
|
MB = $25.78
|
Most Recent Note - 6/28/2017 7:30:42 PM
G - Rebounding toward its prior high. Its 50 DMA line ($29.84) and prior lows in the $26.50 - $27.00 area define near-term support levels to waatch. Raised fundamental concerns with sub par Mar '17 earnings that were repeatedly noted.
>>> FEATURED STOCK ARTICLE : Lingering Below 50-Day Moving Average Line - 6/1/2017 |
View all notes |
Set NEW NOTE alert |
Company Profile |
SEC
News |
Chart |
Request a new note
C
A
S
I |
Symbol/Exchange
Company Name
Industry Group |
PRICE |
CHANGE
(%Change) |
Day High |
Volume
(% DAV)
(% 50 day avg vol) |
52 Wk Hi
% From Hi |
Featured
Date |
Price
Featured |
Pivot Featured |
|
Max Buy |
ULTA
-
NASDAQ
Ulta Beauty Inc
SPECIALTY RETAIL - Specialty Retail, Other
|
$285.28
|
+2.42
0.86% |
$286.97
|
526,887
69.80% of 50 DAV
50 DAV is 754,900
|
$314.86
-9.39%
|
5/5/2017
|
$293.17
|
PP = $289.37
|
|
MB = $303.84
|
Most Recent Note - 6/22/2017 1:20:45 PM
G - Slumping further today after violating its 50 DMA line and retreating below its pivot point, enduring mild distributional pressure. Its Relative Strength rating fell to 69, below the 80+ minimum guideline for buy candidates. A rebound above the 50 DMA line ($293) is needed for its outlook to improve. Prior low ($277.68 on 5/24/17) defines the next important support. See the latest FSU analysis for more details and an annotated graph.
>>> FEATURED STOCK ARTICLE : Violation of 50-Day Moving Average and Slumping Relative Strength - 6/21/2017 |
View all notes |
Set NEW NOTE alert |
Company Profile |
SEC
News |
Chart |
Request a new note
C
A
S
I |
ESNT
-
NYSE
Essent Group Ltd
Finance-MrtgandRel Svc
|
$36.49
|
+0.45
1.25% |
$36.61
|
173,333
32.34% of 50 DAV
50 DAV is 536,000
|
$39.50
-7.62%
|
4/4/2017
|
$36.38
|
PP = $36.81
|
|
MB = $38.65
|
Most Recent Note - 6/27/2017 5:50:04 PM
G - Still consolidating below its 50 DMA line ($36.66) which is now downward sloping. Subsequent losses below the prior low ($34.08 on 5/05/17) would raise greater concerns and trigger a worrisome technical sell signal.
>>> FEATURED STOCK ARTICLE : Sputtering Below its 50-Day Moving Average - 6/20/2017 |
View all notes |
Set NEW NOTE alert |
Company Profile |
SEC
News |
Chart |
Request a new note
C
A
S
I |
MTSI
-
NASDAQ
Macom Tech Solution Hldg
Elec-Semiconductor Mfg
|
$57.42
|
-0.24
-0.42% |
$58.43
|
633,499
65.65% of 50 DAV
50 DAV is 965,000
|
$62.75
-8.49%
|
5/16/2017
|
$52.52
|
PP = $53.89
|
|
MB = $56.58
|
Most Recent Note - 6/27/2017 5:44:31 PM
G - Ended near the session low with a big loss today on lighter volume following 2 gains on above average volume. Met resistance near the prior high. Recent lows and its 50 DMA line define important support in the $54-55 area where violations would raise concerns and trigger technical sell signals. See the latest FSU analysis for more details and a new annotated graph.
>>> FEATURED STOCK ARTICLE : Meeting Resistance Near Prior High - 6/27/2017 |
View all notes |
Set NEW NOTE alert |
Company Profile |
SEC
News |
Chart |
Request a new note
C
A
S
I |
VEEV
-
NYSE
Veeva Systems Inc Cl A
Computer Sftwr-Medical
|
$62.41
|
+2.22
3.69% |
$62.47
|
987,926
55.78% of 50 DAV
50 DAV is 1,771,000
|
$68.07
-8.31%
|
3/16/2017
|
$49.00
|
PP = $48.05
|
|
MB = $50.45
|
Most Recent Note - 6/27/2017 5:57:55 PM
G - Consolidating above its 50 DMA line ($58.84) which recently acted as support. That short term average and recent low ($56.94 on 6/12/17) define important near-term support to watch.
>>> FEATURED STOCK ARTICLE : Rebounding Since Testing Support at 50-Day Moving Average Line - 6/23/2017 |
View all notes |
Set NEW NOTE alert |
Company Profile |
SEC
News |
Chart |
Request a new note
C
A
S
I |
ANET
-
NYSE
Arista Networks Inc
TELECOMMUNICATIONS - Communication Equipment
|
$155.27
|
+2.45
1.60% |
$155.82
|
738,700
86.10% of 50 DAV
50 DAV is 858,000
|
$162.97
-4.72%
|
4/17/2017
|
$132.75
|
PP = $135.27
|
|
MB = $142.03
|
Most Recent Note - 6/26/2017 6:15:39 PM
G - Pulled back from its all-time high with a loss today on average volume. Very extended from any sound base. Its 50 DMA line ($146.50) and prior lows define near-term support to watch.
>>> FEATURED STOCK ARTICLE : Computer Networking Firm Very Extended From Any Sound Base - 6/6/2017 |
View all notes |
Set NEW NOTE alert |
Company Profile |
SEC
News |
Chart |
Request a new note
C
A
S
I |
Symbol/Exchange
Company Name
Industry Group |
PRICE |
CHANGE
(%Change) |
Day High |
Volume
(% DAV)
(% 50 day avg vol) |
52 Wk Hi
% From Hi |
Featured
Date |
Price
Featured |
Pivot Featured |
|
Max Buy |
GRUB
-
NYSE
Grubhub Inc
COMPUTER SOFTWARE and SERVICES - Technical and System Software
|
$44.07
|
+0.65
1.50% |
$44.26
|
1,587,206
62.76% of 50 DAV
50 DAV is 2,529,000
|
$47.84
-7.88%
|
6/21/2017
|
$47.33
|
PP = $46.94
|
|
MB = $49.29
|
Most Recent Note - 6/26/2017 12:44:33 PM
Y - Gapped down today following an analyst downgrade, abruptly retreating following a new high close. A new pivot point was cited based on its 5/08/17 high plus 10 cents. A confirming gain backed by at least +40% above average volume and strong close above the pivot point may clinch a technical buy signal.
>>> FEATURED STOCK ARTICLE : Stalled After Reaching New Highs and Encountered Mild Pressure - 5/22/2017 |
View all notes |
Set NEW NOTE alert |
Company Profile |
SEC
News |
Chart |
Request a new note
C
A
S
I |
IBP
-
NYSE
Installed Building Prod
DIVERSIFIED SERVICES - Business/Management Services
|
$53.85
|
+1.50
2.87% |
$53.90
|
83,525
50.62% of 50 DAV
50 DAV is 165,000
|
$55.45
-2.89%
|
6/13/2017
|
$54.25
|
PP = $55.55
|
|
MB = $58.33
|
Most Recent Note - 6/28/2017 7:32:30 PM
Y - Perched within close striking distance of the new pivot point cited based on its 4/27/17 high plus 10 cents. Subsequent volume-driven gains above the pivot point may trigger a new technical buy signal. Its 50 DMA line ($51.38) defines near-term support above the recent low ($46.65 on 5/09/17).
>>> FEATURED STOCK ARTICLE : Consolidating Near 50-Day Moving Average Line - 6/5/2017 |
View all notes |
Set NEW NOTE alert |
Company Profile |
SEC
News |
Chart |
Request a new note
C
A
S
I |
NCOM
-
NASDAQ
National Commerce Corp
BANKING - Regional - Southeast Banks
|
$39.60
|
+0.45
1.15% |
$39.90
|
26,728
76.37% of 50 DAV
50 DAV is 35,000
|
$40.00
-1.00%
|
4/25/2017
|
$38.95
|
PP = $40.09
|
|
MB = $42.09
|
Most Recent Note - 6/27/2017 6:11:53 PM
Y - Posted a gain today with near average volume, rising within close striking distance of its 52-week high. Its 50 DMA line and recent lows define near-term support in the $37-38 area. Subsequent gains above the pivot point backed by a minimum of +40% above average volume may trigger a technical buy signal. Prior lows in the $36-35 area define the next important support level.
>>> FEATURED STOCK ARTICLE : Sputtering Near 50-Day Moving Average After Stalling - 5/30/2017 |
View all notes |
Set NEW NOTE alert |
Company Profile |
SEC
News |
Chart |
Request a new note
C
A
S
I |
INGN
-
NASDAQ
Inogen Inc
HEALTH SERVICES - Medical Instruments and Supplies
|
$94.37
|
+2.57
2.80% |
$94.55
|
147,728
73.86% of 50 DAV
50 DAV is 200,000
|
$97.71
-3.42%
|
4/17/2017
|
$76.77
|
PP = $80.04
|
|
MB = $84.04
|
Most Recent Note - 6/27/2017 5:56:43 PM
G - Pulled back from its all-time high with a loss today marked by slightly higher volume. It is very extended from its prior base. Near-term support is its 50 DMA line ($86.75).
>>> FEATURED STOCK ARTICLE : Perched at All Time High Following Volume-Driven Gains - 5/31/2017 |
View all notes |
Set NEW NOTE alert |
Company Profile |
SEC
News |
Chart |
Request a new note
C
A
S
I |
HQY
-
NASDAQ
Healthequity Inc
COMPUTER SOFTWARE and SERVICES - Healthcare Information Service
|
$51.17
|
+0.74
1.47% |
$51.38
|
434,934
86.81% of 50 DAV
50 DAV is 501,000
|
$54.95
-6.88%
|
6/7/2017
|
$50.01
|
PP = $49.35
|
|
MB = $51.82
|
Most Recent Note - 6/27/2017 6:09:32 PM
Y - Color code is changed to yellow while quietly consolidating below its "max buy" level and above prior highs in the $49 area defining initial support.
>>> FEATURED STOCK ARTICLE : High Volume Breakout Quickly Getting Extended - 6/7/2017 |
View all notes |
Set NEW NOTE alert |
Company Profile |
SEC
News |
Chart |
Request a new note
C
A
S
I |
Symbol/Exchange
Company Name
Industry Group |
PRICE |
CHANGE
(%Change) |
Day High |
Volume
(% DAV)
(% 50 day avg vol) |
52 Wk Hi
% From Hi |
Featured
Date |
Price
Featured |
Pivot Featured |
|
Max Buy |
PLAY
-
NASDAQ
Dave & Buster's Ent Inc
Retail-Restaurants
|
$67.64
|
+0.50
0.74% |
$68.18
|
538,278
77.23% of 50 DAV
50 DAV is 697,000
|
$73.48
-7.95%
|
2/23/2017
|
$55.41
|
PP = $58.35
|
|
MB = $61.27
|
Most Recent Note - 6/27/2017 5:59:16 PM
G - Extended from any sound base, consolidating above its 50 DMA line ($66.48) and prior lows in the $64-65 area defining near-term support to watch.
>>> FEATURED STOCK ARTICLE : Perched Near Record High After Solid April '17 Quarterly Results - 6/12/2017 |
View all notes |
Set NEW NOTE alert |
Company Profile |
SEC
News |
Chart |
Request a new note
C
A
S
I |
OLLI
-
NASDAQ
Ollie's Bargain Outlet
Retail-DiscountandVariety
|
$41.60
|
+0.50
1.22% |
$41.70
|
672,381
87.44% of 50 DAV
50 DAV is 769,000
|
$44.08
-5.62%
|
3/27/2017
|
$32.80
|
PP = $33.55
|
|
MB = $35.23
|
Most Recent Note - 6/27/2017 5:47:52 PM
Y - Color code is changed to yellow after a rebound above its 50 DMA line ($40.11) today helped its outlook improve. Recent low ($37.60 on 5/16/17) defines near-term support to watch on pullbacks. Fundamentals remain strong.
>>> FEATURED STOCK ARTICLE : Retailer Rallied +25% in 2 Months Since Featured - 5/19/2017 |
View all notes |
Set NEW NOTE alert |
Company Profile |
SEC
News |
Chart |
Request a new note
C
A
S
I |
MOMO
-
NASDAQ
Momo Inc Ads Cl A
INTERNET - Content
|
$37.96
|
+0.90
2.43% |
$37.98
|
4,789,509
68.37% of 50 DAV
50 DAV is 7,005,000
|
$45.95
-17.39%
|
3/7/2017
|
$29.71
|
PP = $27.83
|
|
MB = $29.22
|
Most Recent Note - 6/27/2017 5:55:00 PM
G - Violated its 50 DMA line with a big loss today on below average hurting its outlook. Prior low ($35.02 on 6/15/17) defines the next important chart support level where a violation would raise more serious concerns.
>>> FEATURED STOCK ARTICLE : Sputtering Below 50-Day Moving Average Line - 6/14/2017 |
View all notes |
Set NEW NOTE alert |
Company Profile |
SEC
News |
Chart |
Request a new note
C
A
S
I |
HLI
-
NYSE
Houlihan Lokey Inc Cl A
Finance-Invest Bnk/Bkrs
|
$34.73
|
+0.25
0.73% |
$35.36
|
77,180
44.61% of 50 DAV
50 DAV is 173,000
|
$36.65
-5.24%
|
5/10/2017
|
$35.85
|
PP = $35.05
|
|
MB = $36.80
|
Most Recent Note - 6/26/2017 6:10:18 PM
Y - Still quietly consolidating above its 50 DMA line ($33.99) which has acted as support. Recent low ($32.72 on 5/31/17) also defines near-term support where violations would raise concerns and trigger a more worrisome technical sell signal.
>>> FEATURED STOCK ARTICLE : Gapped Up and Nearly Challenged Prior High - 6/19/2017 |
View all notes |
Set NEW NOTE alert |
Company Profile |
SEC
News |
Chart |
Request a new note
C
A
S
I |