***Last / Change / Volume data in this table is the closing quote data***
Symbol/Exchange
Company Name
Industry Group |
PRICE |
CHANGE
(%Change) |
Day High |
Volume
(% DAV)
(% 50 day avg vol) |
52 Wk Hi
% From Hi |
Featured
Date |
Price
Featured |
Pivot Featured |
|
Max Buy |
OSBC
-
NASDAQ
Old Second Bancorp Inc
BANKING - Regional - Midwest Banks
|
$15.05
|
-0.10
-0.66% |
$15.40
|
104,121
185.93% of 50 DAV
50 DAV is 56,000
|
$15.55
-3.22%
|
5/21/2018
|
$15.50
|
PP = $15.10
|
|
MB = $15.86
|
Most Recent Note - 6/6/2018 12:53:23 PM
Y - Encountered distributional pressure on the prior session yet it remains hovering near its high. Stalled after highlighted in yellow on 5/21/18 with pivot point cited based on prior highs plus 10 cents. Fundamentals remain strong.
>>> FEATURED STOCK ARTICLE : Hit New High Today After Orderly Consolidation - 5/21/2018 |
View all notes |
Set NEW NOTE alert |
Company Profile |
SEC
News |
Chart |
Request a new note
C
A
S
I |
PFBC
-
NASDAQ
Preferred Bank Los Angls
BANKING - Regional - Pacific Banks
|
$67.53
|
+0.60
0.90% |
$67.88
|
66,397
81.37% of 50 DAV
50 DAV is 81,600
|
$67.65
-0.18%
|
5/18/2018
|
$62.91
|
PP = $67.75
|
|
MB = $71.14
|
Most Recent Note - 6/4/2018 5:21:05 PM
Y - Posted a big gain today on lighter volume while rallying above its 50 DMA line ($64.36). Its Relative Strength rating is still below the 80+ minimum guideline at 69, yet it ended only -2.3% off its high and its color code was changed to yellow. Subsequent gains above the pivot point are needed to trigger a technical buy signal.
>>> FEATURED STOCK ARTICLE : Some Technical Sputtering Yet Bank is Still Only -7% Off High - 5/18/2018 |
View all notes |
Set NEW NOTE alert |
Company Profile |
SEC
News |
Chart |
Request a new note
C
A
S
I |
SIVB
-
NASDAQ
S V B Financial Group
BANKING - Regional - Pacific Banks
|
$322.40
|
-1.19
-0.37% |
$326.57
|
455,181
80.14% of 50 DAV
50 DAV is 568,000
|
$327.91
-1.68%
|
3/12/2018
|
$267.79
|
PP = $263.19
|
|
MB = $276.35
|
Most Recent Note - 6/4/2018 5:24:46 PM
G - Perched near its all-time high. still very extended from any sound base. Disciplined investors avoid chasing extended stocks. Fundamentals are strong.
>>> FEATURED STOCK ARTICLE : Wedging Higher Following Big Breakaway Gap - 5/22/2018 |
View all notes |
Set NEW NOTE alert |
Company Profile |
SEC
News |
Chart |
Request a new note
C
A
S
I |
UCFC
-
NASDAQ
United Community Finl Cp
BANKING - Savings and Loans
|
$10.80
|
-0.01
-0.09% |
$10.95
|
409,187
368.64% of 50 DAV
50 DAV is 111,000
|
$10.84
-0.37%
|
5/30/2018
|
$10.50
|
PP = $10.80
|
|
MB = $11.34
|
 Most Recent Note - 6/7/2018 12:57:39 PM
Y - Hitting another new high with today's volume-driven gain. Gain on the prior session backed by 4 times average volume triggered a technical buy signal.
>>> FEATURED STOCK ARTICLE : Small Savings & Loan Perched Near High - 5/30/2018 |
View all notes |
Set NEW NOTE alert |
Company Profile |
SEC
News |
Chart |
Request a new note
C
A
S
I |
EPAM
-
NYSE
Epam Systems Inc
COMPUTER SOFTWARE and SERVICES - Information Technology Service
|
$124.14
|
-3.24
-2.54% |
$127.18
|
508,247
184.82% of 50 DAV
50 DAV is 275,000
|
$131.75
-5.78%
|
5/9/2018
|
$120.34
|
PP = $125.98
|
|
MB = $132.28
|
Most Recent Note - 6/5/2018 12:32:55 PM
Y - Stalled after its recent breakout. Consolidating above near-term support defined by prior highs and its 50 DMA line ($118.53).
>>> FEATURED STOCK ARTICLE : Volume-Driven Gain Challenged Prior High Following Earnings - 5/9/2018 |
View all notes |
Set NEW NOTE alert |
Company Profile |
SEC
News |
Chart |
Request a new note
C
A
S
I |
Symbol/Exchange
Company Name
Industry Group |
PRICE |
CHANGE
(%Change) |
Day High |
Volume
(% DAV)
(% 50 day avg vol) |
52 Wk Hi
% From Hi |
Featured
Date |
Price
Featured |
Pivot Featured |
|
Max Buy |
MA
-
NYSE
Mastercard Inc Cl A
Finance-CrdtCard/PmtPr
|
$199.54
|
-3.67
-1.81% |
$204.00
|
4,080,325
106.76% of 50 DAV
50 DAV is 3,822,000
|
$203.29
-1.84%
|
5/2/2018
|
$184.96
|
PP = $183.83
|
|
MB = $193.02
|
Most Recent Note - 6/5/2018 5:30:50 PM
G - Color code is changed to green after rallying above its "max buy" level and hitting another new all-time high. Prior highs in the $183 area and its 50 DMA line (182.89) define support to watch on pullbacks.
>>> FEATURED STOCK ARTICLE : Gap Up and Volume Driven Gain for New High After Earnings - 5/2/2018 |
View all notes |
Set NEW NOTE alert |
Company Profile |
SEC
News |
Chart |
Request a new note
C
A
S
I |
V
-
NYSE
Visa Inc Cl A
Finance-CrdtCard/PmtPr
|
$133.84
|
-2.44
-1.79% |
$136.58
|
8,298,069
110.98% of 50 DAV
50 DAV is 7,477,000
|
$136.31
-1.81%
|
4/26/2018
|
$126.68
|
PP = $126.98
|
|
MB = $133.33
|
Most Recent Note - 6/6/2018 3:17:29 PM
G - Hitting new all-time highs above its "max buy" level with today's 6th consecutive gain and its color code is changed to green. Prior highs in the $126 area and its 50 DMA line ($126) define near-term support to watch on pullbacks.
>>> FEATURED STOCK ARTICLE : Volume-Driven Gain For New High Triggered Technical Buy Signal - 4/26/2018 |
View all notes |
Set NEW NOTE alert |
Company Profile |
SEC
News |
Chart |
Request a new note
C
A
S
I |
TPL
-
NYSE
Texas Pacific Land Trust
Real Estate Dvlpmt/Ops
|
$700.86
|
+16.07
2.35% |
$709.50
|
30,316
151.58% of 50 DAV
50 DAV is 20,000
|
$739.89
-5.28%
|
4/13/2018
|
$547.85
|
PP = $552.10
|
|
MB = $579.71
|
Most Recent Note - 6/7/2018 12:52:15 PM
G - Perched near its all-time high, still very extended from any sound base. Its 50 DMA line ($604) defines important support to watch above the prior highs in the $569-552 area.
>>> FEATURED STOCK ARTICLE : Negative Reversal on Higher Volume After Hitting New All-Time High - 6/4/2018 |
View all notes |
Set NEW NOTE alert |
Company Profile |
SEC
News |
Chart |
Request a new note
C
A
S
I |
STMP
-
NASDAQ
Stamps.com Inc
Retail-Internet
|
$261.60
|
+0.75
0.29% |
$264.00
|
191,128
63.92% of 50 DAV
50 DAV is 299,000
|
$263.40
-0.68%
|
5/4/2018
|
$234.15
|
PP = $233.23
|
|
MB = $244.89
|
Most Recent Note - 6/6/2018 3:09:35 PM
G - Wedging to new all-time highs with recent gains lacking great volume conviction. Extended from prior highs in the $233 area which define initial support above its 50 DMA line ($230).
>>> FEATURED STOCK ARTICLE : Volume-Driven Gain For New High - 5/4/2018 |
View all notes |
Set NEW NOTE alert |
Company Profile |
SEC
News |
Chart |
Request a new note
C
A
S
I |
CHDN
-
NASDAQ
Churchill Downs Inc
LEISURE - Gaming Activities
|
$306.05
|
+0.90
0.29% |
$307.88
|
59,404
53.52% of 50 DAV
50 DAV is 111,000
|
$314.60
-2.72%
|
5/14/2018
|
$285.80
|
PP = $285.80
|
|
MB = $300.09
|
Most Recent Note - 6/6/2018 3:13:49 PM
G - Color code is changed to green after rising back above its "max buy" level. Prior highs in the $285-279 area define initial support to watch above its 50 DMA line ($272).
>>> FEATURED STOCK ARTICLE : Breakout Followed New Supreme Court Ruling on Sports Betting - 5/14/2018 |
View all notes |
Set NEW NOTE alert |
Company Profile |
SEC
News |
Chart |
Request a new note
C
A
S
I |
Symbol/Exchange
Company Name
Industry Group |
PRICE |
CHANGE
(%Change) |
Day High |
Volume
(% DAV)
(% 50 day avg vol) |
52 Wk Hi
% From Hi |
Featured
Date |
Price
Featured |
Pivot Featured |
|
Max Buy |
HTHT
-
NASDAQ
China Lodging Group Ads
LEISURE - Lodging
|
$47.84
|
-1.46
-2.96% |
$49.45
|
1,872,956
80.80% of 50 DAV
50 DAV is 2,318,000
|
$49.43
-3.22%
|
5/15/2018
|
$34.52
|
PP = $41.57
|
|
MB = $43.65
|
Most Recent Note - 6/6/2018 6:19:03 PM
G - Hit another new all-time high with today's 4th consecutive gain on average or below average volume. Prior highs in the $40-41 area define initial support to watch on pullbacks. Do not be confused by the 4:1 split impacting share prices (Price Featured, Pivot Point and Max Buy were updated to account for the split).
>>> FEATURED STOCK ARTICLE : New Volume-Driven Breakout For All-Time High - 5/15/2018 |
View all notes |
Set NEW NOTE alert |
Company Profile |
SEC
News |
Chart |
Request a new note
C
A
S
I |
NFLX
-
NASDAQ
Netflix Inc
SPECIALTY RETAIL - Music and Video Stores
|
$361.40
|
-6.05
-1.65% |
$368.70
|
8,248,875
85.02% of 50 DAV
50 DAV is 9,702,000
|
$369.83
-2.28%
|
5/24/2018
|
$348.85
|
PP = $338.92
|
|
MB = $355.87
|
Most Recent Note - 6/5/2018 5:32:28 PM
G - Color code is changed to green after a 3rd consecutive small gain today on light volume for a best-ever close. Held its ground stubbornly after the 5/24/18 gain with +50% above average volume triggered a technical buy signal. Prior highs in the $338-333 area define initial support to watch above its 50 DMA line ($320).
>>> FEATURED STOCK ARTICLE : Rally From Advanced Ascending Base With Volume +50% - 5/24/2018 |
View all notes |
Set NEW NOTE alert |
Company Profile |
SEC
News |
Chart |
Request a new note
C
A
S
I |
DPZ
-
NYSE
Dominos Pizza Inc
Retail-Restaurants
|
$272.04
|
+2.41
0.89% |
$273.57
|
886,137
149.18% of 50 DAV
50 DAV is 594,000
|
$269.82
0.82%
|
5/21/2018
|
$248.13
|
PP = $255.10
|
|
MB = $267.86
|
Most Recent Note - 6/6/2018 6:20:42 PM
G - Color code is changed to green after rising above its "max buy" level with today's 4th consecutive gain. Its 50 DMA line ($243) and prior highs in the $236 area define important near-term support to watch on pullbacks.
>>> FEATURED STOCK ARTICLE : New High With Gain Backed by Above Average Volume - 6/5/2018 |
View all notes |
Set NEW NOTE alert |
Company Profile |
SEC
News |
Chart |
Request a new note
C
A
S
I |
FIVE
-
NASDAQ
Five Below Inc
Retail-DiscountandVariety
|
$99.05
|
+17.77
21.86% |
$100.97
|
9,700,762
670.87% of 50 DAV
50 DAV is 1,446,000
|
$81.77
21.13%
|
6/4/2018
|
$75.96
|
PP = $78.38
|
|
MB = $82.30
|
Most Recent Note - 6/7/2018 12:36:30 PM
G - Gapped up today hitting a new high and its color code is changed to green after getting very extended from the previously noted base. Reported earnings +133% on +27% sales revenues for the Apr '18 quarter. Volume and volatility often increase near earnings news. Disciplined investors avoid chasing stocks that are too extended from a sound base.
>>> FEATURED STOCK ARTICLE : Trading Near 50-Day Average After Falling Into Prior Base - 5/7/2018 |
View all notes |
Set NEW NOTE alert |
Company Profile |
SEC
News |
Chart |
Request a new note
C
A
S
I |
NOW
-
NYSE
Servicenow Inc
Computer Sftwr-Enterprse
|
$177.45
|
-8.97
-4.81% |
$187.00
|
2,821,493
150.64% of 50 DAV
50 DAV is 1,873,000
|
$187.39
-5.30%
|
5/8/2018
|
$174.63
|
PP = $176.66
|
|
MB = $185.49
|
Most Recent Note - 6/7/2018 5:22:22 PM
Y - Pulled back today with higher volume indicative of distributional pressure, retreating from its all-time high and its color code is changed to yellow. Its 50 DMA line ($171) and prior low define near-term support.
>>> FEATURED STOCK ARTICLE : High-Ranked Software - Enterprise Firm is Near Pivot Point - 5/8/2018 |
View all notes |
Set NEW NOTE alert |
Company Profile |
SEC
News |
Chart |
Request a new note
C
A
S
I |
Symbol/Exchange
Company Name
Industry Group |
PRICE |
CHANGE
(%Change) |
Day High |
Volume
(% DAV)
(% 50 day avg vol) |
52 Wk Hi
% From Hi |
Featured
Date |
Price
Featured |
Pivot Featured |
|
Max Buy |
NVEE
-
NASDAQ
N V 5 Global Inc
Comml Svcs-Consulting
|
$64.75
|
-0.60
-0.92% |
$65.56
|
49,660
59.83% of 50 DAV
50 DAV is 83,000
|
$71.90
-9.94%
|
4/9/2018
|
$58.35
|
PP = $59.05
|
|
MB = $62.00
|
Most Recent Note - 6/5/2018 2:01:46 PM
G - Color code is changed to green after rising above its "max buy" level. Found support at its 50 DMA line and prior highs in the $58-59 area.
>>> FEATURED STOCK ARTICLE : Encountered Distributional Pressure After Hitting New High - 5/11/2018 |
View all notes |
Set NEW NOTE alert |
Company Profile |
SEC
News |
Chart |
Request a new note
C
A
S
I |
QLYS
-
NASDAQ
Qualys Inc
Computer Sftwr-Security
|
$79.40
|
-1.25
-1.55% |
$81.20
|
323,097
113.37% of 50 DAV
50 DAV is 285,000
|
$85.00
-6.59%
|
4/17/2018
|
$82.85
|
PP = $79.50
|
|
MB = $83.48
|
Most Recent Note - 6/4/2018 5:23:07 PM
Y - Rose further above its 50 DMA line with today's gain on higher volume. Little resistance remains due to overhead supply up through the $85 level. Prior low ($68.20 on 5/02/18) defines the next important support above its 200 DMA line.
>>> FEATURED STOCK ARTICLE : Rebounded Above 50-Day Average Yet Still Faces Overhead Supply - 5/29/2018 |
View all notes |
Set NEW NOTE alert |
Company Profile |
SEC
News |
Chart |
Request a new note
C
A
S
I |
SPLK
-
NASDAQ
Splunk Inc
Computer Sftwr-Database
|
$114.65
|
-3.16
-2.68% |
$119.15
|
2,249,429
133.34% of 50 DAV
50 DAV is 1,687,000
|
$119.00
-3.66%
|
5/8/2018
|
$113.14
|
PP = $112.76
|
|
MB = $118.40
|
Most Recent Note - 6/6/2018 3:11:06 PM
Y - Quietly perched near its all-time high. Found support above its 50 DMA line ($107.28) after volume-driven losses tested the prior high in the $108 area. More damaging losses would raise greater concerns and trigger technical sell signals. Confirming gains above the stock's pivot point backed by a minimum of +40% above average would be a reassuring sign of fresh institutional buying demand and may clinch a proper technical buy signal. See the latest FSU analysis for more details and a new annotated graph.
>>> FEATURED STOCK ARTICLE : Consolidating Near High Following Latest Financial Report - 5/31/2018 |
View all notes |
Set NEW NOTE alert |
Company Profile |
SEC
News |
Chart |
Request a new note
C
A
S
I |
SUPN
-
NASDAQ
Supernus Pharmaceuticals
Medical-Biomed/Biotech
|
$54.20
|
-0.50
-0.91% |
$55.15
|
596,750
79.25% of 50 DAV
50 DAV is 753,000
|
$59.05
-8.21%
|
4/24/2018
|
$47.73
|
PP = $50.15
|
|
MB = $52.66
|
Most Recent Note - 6/6/2018 6:14:43 PM
G - Consolidating near its all-time high, extended from the previously noted base. Prior highs in the $49-50 area define support to watch along with its 50 DMA line ($49.99). See the latest FSU analysis for more details and a new annotated graph.
>>> FEATURED STOCK ARTICLE : Extended From Prior Base After Spiking Higher - 6/6/2018 |
View all notes |
Set NEW NOTE alert |
Company Profile |
SEC
News |
Chart |
Request a new note
C
A
S
I |
PAYC
-
NYSE
Paycom Software Inc
COMPUTER SOFTWARE and SERVICES - Application Software
|
$103.04
|
-6.40
-5.85% |
$109.60
|
903,670
123.28% of 50 DAV
50 DAV is 733,000
|
$118.45
-13.01%
|
2/15/2018
|
$95.01
|
PP = $93.61
|
|
MB = $98.29
|
Most Recent Note - 6/7/2018 5:24:02 PM
G - Slumped back below its 50 DMA line ($107.96) with a big loss today on higher volume raising concerns. Faces some resistance due to overhead supply up to the $118 level. Found prompt support near prior lows in the $101 area.
>>> FEATURED STOCK ARTICLE : Violation of 50-Day Average Triggered Technical Sell Signal - 5/3/2018 |
View all notes |
Set NEW NOTE alert |
Company Profile |
SEC
News |
Chart |
Request a new note
C
A
S
I |
Symbol/Exchange
Company Name
Industry Group |
PRICE |
CHANGE
(%Change) |
Day High |
Volume
(% DAV)
(% 50 day avg vol) |
52 Wk Hi
% From Hi |
Featured
Date |
Price
Featured |
Pivot Featured |
|
Max Buy |
GRUB
-
NYSE
Grubhub Inc
INTERNET - Content
|
$104.91
|
-2.87
-2.66% |
$109.31
|
1,738,138
125.14% of 50 DAV
50 DAV is 1,389,000
|
$113.61
-7.66%
|
5/30/2018
|
$107.56
|
PP = $105.68
|
|
MB = $110.96
|
Most Recent Note - 6/5/2018 5:21:54 PM
Y - Finished in the lower half of its intra-day range today after touching a new all-time high. It formed a double bottom base, however subsequent gains and a close above the pivot point backed by at least +40% above average volume is needed to trigger a convincing technical buy signal. Found support near its 50 DMA line ($101.32). Recently reported earnings +79% on +49% sales revenues for the Mar '18 quarter.
>>> FEATURED STOCK ARTICLE : Consolidating Near 50 Day Average With Earnings News Due - 4/30/2018 |
View all notes |
Set NEW NOTE alert |
Company Profile |
SEC
News |
Chart |
Request a new note
C
A
S
I |
HQY
-
NASDAQ
Healthequity Inc
COMPUTER SOFTWARE and SERVICES - Healthcare Information Service
|
$76.82
|
-3.59
-4.46% |
$80.50
|
841,682
169.01% of 50 DAV
50 DAV is 498,000
|
$80.73
-4.84%
|
5/2/2018
|
$66.31
|
PP = $68.85
|
|
MB = $72.29
|
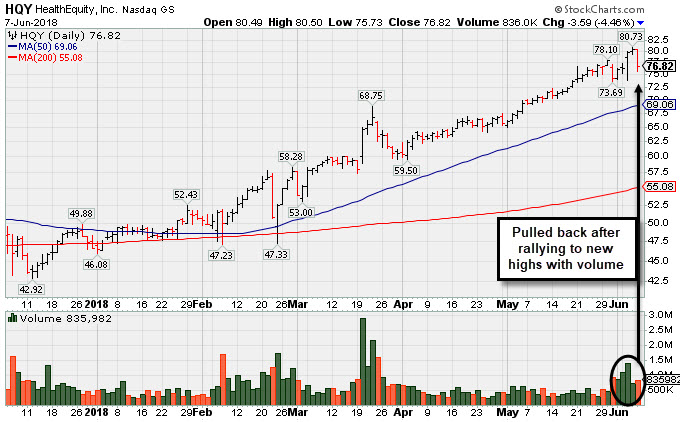
Most Recent Note - 6/7/2018 5:20:06 PM
G - Pulled back from its all-time high today following 4 consecutive volume-driven gains. Very extended from any sound base. Prior high ($68.75 on 3/22/18) and its 50 DMA line ($69.06) define near term support to watch on pullbacks. See the latest FSU analysis for more details and a new annotated graph.
>>> FEATURED STOCK ARTICLE : Pullback After Volume-Driven Gains For New Highs - 6/7/2018 |
View all notes |
Set NEW NOTE alert |
Company Profile |
SEC
News |
Chart |
Request a new note
C
A
S
I |
LOB
-
NASDAQ
Live Oak Bancshares Inc
Banks-Southeast
|
$30.40
|
+0.05
0.16% |
$30.80
|
102,152
98.22% of 50 DAV
50 DAV is 104,000
|
$31.00
-1.94%
|
5/21/2018
|
$29.35
|
PP = $30.15
|
|
MB = $31.66
|
Most Recent Note - 6/5/2018 12:42:43 PM
Y - Hovering at its all-time high. Disciplined investors may still be watching for convincing volume-driven gains above the pivot point to trigger a technical buy signal. Prior lows in the $26-27 area define important near term support. Recently reported earnings +63% on +42% for the Mar '18 quarter.
>>> FEATURED STOCK ARTICLE : Bank Perched Near High After Orderly Base - 5/23/2018 |
View all notes |
Set NEW NOTE alert |
Company Profile |
SEC
News |
Chart |
Request a new note
C
A
S
I |
PYPL
-
NASDAQ
Paypal Holdings Inc
Finance-CrdtCard/PmtPr
|
$83.27
|
-1.94
-2.28% |
$85.30
|
7,541,941
89.97% of 50 DAV
50 DAV is 8,383,000
|
$86.32
-3.53%
|
5/18/2018
|
$81.63
|
PP = $80.89
|
|
MB = $84.93
|
Most Recent Note - 6/6/2018 3:16:05 PM
Y - On track today for a 6th consecutive small gain, wedging above the pivot point cited based on its 4/18/18 high and challenging its 52-week high. Confirming gains backed by at least +40% above average volume would be a reassuring sign of fresh institutional buying demand. The 50 DMA line ($77.93) defines near-term support above its 200 DMA line and prior lows in the $71-72 area. Fundamentals remain strong.
>>> FEATURED STOCK ARTICLE : Slumping Near Important Near-Term Support - 4/27/2018 |
View all notes |
Set NEW NOTE alert |
Company Profile |
SEC
News |
Chart |
Request a new note
C
A
S
I |
OLLI
-
NASDAQ
Ollie's Bargain Outlet
Retail-DiscountandVariety
|
$73.75
|
-1.05
-1.40% |
$75.50
|
1,150,450
151.18% of 50 DAV
50 DAV is 761,000
|
$77.50
-4.84%
|
4/10/2018
|
$62.05
|
PP = $62.15
|
|
MB = $65.26
|
Most Recent Note - 6/6/2018 12:45:20 PM
G - Hitting yet another new all-time high with today's big volume-driven gain, getting very extended from any sound base. Its 50 DMA line ($64.79) and prior highs define important near-term support to watch on pullbacks.
>>> FEATURED STOCK ARTICLE : Extended From Prior Base After 8 Consecutive Gains - 5/17/2018 |
View all notes |
Set NEW NOTE alert |
Company Profile |
SEC
News |
Chart |
Request a new note
C
A
S
I |
Symbol/Exchange
Company Name
Industry Group |
PRICE |
CHANGE
(%Change) |
Day High |
Volume
(% DAV)
(% 50 day avg vol) |
52 Wk Hi
% From Hi |
Featured
Date |
Price
Featured |
Pivot Featured |
|
Max Buy |
MOMO
-
NASDAQ
Momo Inc Ads Cl A
INTERNET - Content
|
$49.37
|
-0.72
-1.44% |
$50.62
|
3,713,044
85.14% of 50 DAV
50 DAV is 4,361,000
|
$50.82
-2.85%
|
6/1/2018
|
$48.62
|
PP = $46.79
|
|
MB = $49.13
|
Most Recent Note - 6/6/2018 12:29:55 PM
G - Color code is changed to green as it hovers above its "max buy" level near its all-time high, stubbornly holding its ground after volume-driven gains. Disciplined investors avoid chasing stocks extended more than +5% from a sound base. Prior highs in the $45-46 area define initial support to watch on pullbacks.
>>> FEATURED STOCK ARTICLE : Volume-Driven Gain for New All-Time High - 6/1/2018 |
View all notes |
Set NEW NOTE alert |
Company Profile |
SEC
News |
Chart |
Request a new note
C
A
S
I |
NOVT
-
NASDAQ
Novanta Inc
Elec-Scientific/Msrng
|
$65.60
|
-1.55
-2.31% |
$67.45
|
188,874
82.48% of 50 DAV
50 DAV is 229,000
|
$68.00
-3.53%
|
4/17/2018
|
$60.55
|
PP = $60.40
|
|
MB = $63.42
|
Most Recent Note - 6/6/2018 3:12:37 PM
G - Hitting another new high with today's 8th consecutive gain. Found support near prior highs in the $58 area and stayed above its 50 DMA line ($59.60) during the recent consolidation.
>>> FEATURED STOCK ARTICLE : Quietly Hovering Near All-Time High - 5/25/2018 |
View all notes |
Set NEW NOTE alert |
Company Profile |
SEC
News |
Chart |
Request a new note
C
A
S
I |
BZUN
-
NASDAQ
Baozun Inc Cl A Ads
Computer Sftwr-Enterprse
|
$61.99
|
-0.86
-1.37% |
$63.80
|
1,793,705
70.12% of 50 DAV
50 DAV is 2,558,000
|
$64.07
-3.25%
|
5/15/2018
|
$45.38
|
PP = $52.43
|
|
MB = $55.05
|
Most Recent Note - 6/5/2018 5:29:32 PM
G - Perched at its all-time high after 5 consecutive gains backed light or average volume, getting more extended from the prior base. Prior highs in the $51-53 area define initial support to watch on pullbacks.
>>> FEATURED STOCK ARTICLE : Earnings News Due; Formed a Base-on-Base Pattern - 5/16/2018 |
View all notes |
Set NEW NOTE alert |
Company Profile |
SEC
News |
Chart |
Request a new note
C
A
S
I |
SEDG
-
NASDAQ
Solaredge Technologies
Energy-Solar
|
$53.45
|
-0.05
-0.09% |
$54.00
|
1,824,527
161.89% of 50 DAV
50 DAV is 1,127,000
|
$70.74
-24.44%
|
5/9/2018
|
$55.33
|
PP = $59.30
|
|
MB = $62.27
|
Most Recent Note - 6/5/2018 5:39:58 PM
G - Slumped further below its 50 DMA line ($57.09) with today's damaging volume-driven loss. Only a prompt rebound above the 50 DMA line would help its outlook improve. Losses below the prior low ($50.59 on 5/02/18) would raise greater concerns.
>>> FEATURED STOCK ARTICLE : Quickly Rallied Following Strong Earnings News - 5/10/2018 |
View all notes |
Set NEW NOTE alert |
Company Profile |
SEC
News |
Chart |
Request a new note
C
A
S
I |
SEND
-
NYSE
Sendgrid Inc
INTERNET - Content
|
$26.99
|
-0.41
-1.50% |
$27.49
|
473,333
97.19% of 50 DAV
50 DAV is 487,000
|
$32.03
-15.73%
|
3/6/2018
|
$28.00
|
PP = $28.37
|
|
MB = $29.79
|
Most Recent Note - 6/4/2018 12:36:15 PM
G - Today's gain above the 50 DMA line ($27.06) helps its outlook improve, however, it still faces resistance due to overhead supply up to the $32 level. The prior low ($23.77 on 4/04/18) defines the next important support to watch. Completed a new Public Offering and Secondary Offering on 4/05/18.
>>> FEATURED STOCK ARTICLE : Earnings News Continues to be Strong - 5/1/2018 |
View all notes |
Set NEW NOTE alert |
Company Profile |
SEC
News |
Chart |
Request a new note
C
A
S
I |
Symbol/Exchange
Company Name
Industry Group |
PRICE |
CHANGE
(%Change) |
Day High |
Volume
(% DAV)
(% 50 day avg vol) |
52 Wk Hi
% From Hi |
Featured
Date |
Price
Featured |
Pivot Featured |
|
Max Buy |