***Last / Change / Volume data in this table is the closing quote data***
Symbol/Exchange
Company Name
Industry Group |
PRICE |
CHANGE
(%Change) |
Day High |
Volume
(% DAV)
(% 50 day avg vol) |
52 Wk Hi
% From Hi |
Featured
Date |
Price
Featured |
Pivot Featured |
|
Max Buy |
OSBC
-
NASDAQ
Old Second Bancorp Inc
BANKING - Regional - Midwest Banks
|
$14.95
|
+0.10
0.67% |
$15.10
|
69,830
122.51% of 50 DAV
50 DAV is 57,000
|
$15.55
-3.86%
|
5/21/2018
|
$15.50
|
PP = $15.10
|
|
MB = $15.86
|
Most Recent Note - 5/29/2018 5:37:13 PM
Y - Slumped back into the prior base with a loss on light volume today raising concerns. Stalled after highlighted in yellow on 5/21/18 with pivot point cited based on prior highs plus 10 cents. Fundamentals are strong.
>>> FEATURED STOCK ARTICLE : Hit New High Today After Orderly Consolidation - 5/21/2018 |
View all notes |
Set NEW NOTE alert |
Company Profile |
SEC
News |
Chart |
Request a new note
C
A
S
I |
PFBC
-
NASDAQ
Preferred Bank Los Angls
BANKING - Regional - Pacific Banks
|
$64.35
|
+1.10
1.74% |
$64.68
|
83,668
102.91% of 50 DAV
50 DAV is 81,300
|
$67.65
-4.88%
|
5/18/2018
|
$62.91
|
PP = $67.75
|
|
MB = $71.14
|
Most Recent Note - 5/29/2018 5:31:14 PM
G - Sank below its 50 DMA line ($64.46) with higher volume behind today's loss and its color code is changed to green. Gains above the 50 DMA line are needed for its outlook to improve. Its Relative Strength rating has slumped below the 80+ minimum guideline to 71, yet it remains only -6.5% off its high. Despite concerns its color code was changed to yellow with new pivot point cited based on its 1/22/18 high plus 10 cents. Subsequent gains above the pivot point are needed to trigger a technical buy signal. See the latest FSU analysis for more details and an annotated graph.
>>> FEATURED STOCK ARTICLE : Some Technical Sputtering Yet Bank is Still Only -7% Off High - 5/18/2018 |
View all notes |
Set NEW NOTE alert |
Company Profile |
SEC
News |
Chart |
Request a new note
C
A
S
I |
SIVB
-
NASDAQ
S V B Financial Group
BANKING - Regional - Pacific Banks
|
$314.98
|
+7.99
2.60% |
$317.77
|
695,260
119.26% of 50 DAV
50 DAV is 583,000
|
$327.91
-3.94%
|
3/12/2018
|
$267.79
|
PP = $263.19
|
|
MB = $276.35
|
Most Recent Note - 5/29/2018 5:28:18 PM
G - Gapped down today retreating from its all-time high. recently noted as very extended from any sound base after a big "breakaway gap" for a new high was noted on 4/27/18. Fundamentals are strong.
>>> FEATURED STOCK ARTICLE : Wedging Higher Following Big Breakaway Gap - 5/22/2018 |
View all notes |
Set NEW NOTE alert |
Company Profile |
SEC
News |
Chart |
Request a new note
C
A
S
I |
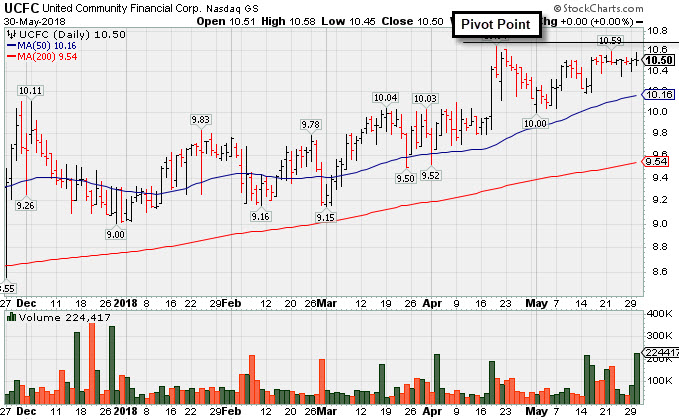
UCFC
-
NASDAQ
United Community Finl Cp
BANKING - Savings and Loans
|
$10.50
|
+0.00
0.00% |
$10.58
|
223,654
298.21% of 50 DAV
50 DAV is 75,000
|
$10.70
-1.87%
|
5/30/2018
|
$10.50
|
PP = $10.80
|
|
MB = $11.34
|
 Most Recent Note - 5/30/2018 5:41:10 PM
Y - Churned heavy volume but finished unchanged today after highlighted in yellow with pivot point cited based on its 4/19/18 high plus 10 cents. Subsequent volume-driven gains above the pivot point may trigger a technical buy signal. Thinly-traded Bank holding company is hovering near its 52-week high, still building on an orderly base-on-base pattern. Reported Mar '18 quarterly earnings +70% on +21% sales revenues, continuing its strong earnings streak above the +25% minimum guideline (C criteria) of the fact-based investment system. Annual earnings history since FY '13 has been strong. See the latest FSU analysis for more details and a new annotated graph.
>>> FEATURED STOCK ARTICLE : Small Savings & Loan Perched Near High - 5/30/2018 |
View all notes |
Set NEW NOTE alert |
Company Profile |
SEC
News |
Chart |
Request a new note
C
A
S
I |
EPAM
-
NYSE
Epam Systems Inc
COMPUTER SOFTWARE and SERVICES - Information Technology Service
|
$124.36
|
+2.28
1.87% |
$125.11
|
240,928
83.37% of 50 DAV
50 DAV is 289,000
|
$131.75
-5.61%
|
5/9/2018
|
$120.34
|
PP = $125.98
|
|
MB = $132.28
|
Most Recent Note - 5/30/2018 3:31:23 PM
Y - Stalled after its recent breakout and it is quietly consolidating near the prior high ($125.88 on 3/13/18). Additional near-term support is defined by prior highs in the $119 area and its 50 DMA line ($117.92).
>>> FEATURED STOCK ARTICLE : Volume-Driven Gain Challenged Prior High Following Earnings - 5/9/2018 |
View all notes |
Set NEW NOTE alert |
Company Profile |
SEC
News |
Chart |
Request a new note
C
A
S
I |
Symbol/Exchange
Company Name
Industry Group |
PRICE |
CHANGE
(%Change) |
Day High |
Volume
(% DAV)
(% 50 day avg vol) |
52 Wk Hi
% From Hi |
Featured
Date |
Price
Featured |
Pivot Featured |
|
Max Buy |
MA
-
NYSE
Mastercard Inc Cl A
DIVERSIFIED SERVICES - Business/Management Services
|
$191.76
|
+2.23
1.18% |
$191.93
|
2,763,321
71.31% of 50 DAV
50 DAV is 3,875,000
|
$194.72
-1.52%
|
5/2/2018
|
$184.96
|
PP = $183.83
|
|
MB = $193.02
|
Most Recent Note - 5/30/2018 3:58:20 PM
Y - Still stubbornly holding its ground near its "max buy" level and all-time high. Prior highs in the $183 area and its 50 DMA line (181.45) define support to watch on pullbacks.
>>> FEATURED STOCK ARTICLE : Gap Up and Volume Driven Gain for New High After Earnings - 5/2/2018 |
View all notes |
Set NEW NOTE alert |
Company Profile |
SEC
News |
Chart |
Request a new note
C
A
S
I |
V
-
NYSE
Visa Inc Cl A
DIVERSIFIED SERVICES - Business/Management Services
|
$130.64
|
+0.95
0.73% |
$131.10
|
10,605,948
138.04% of 50 DAV
50 DAV is 7,683,000
|
$132.50
-1.40%
|
4/26/2018
|
$126.68
|
PP = $126.98
|
|
MB = $133.33
|
Most Recent Note - 5/23/2018 4:36:24 PM
Y - Stubbornly and quietly holding its ground in a tight range near its all-time high. Reported earnings +29% on +13% sales revenues for the Mar '18 quarter, and 3 of the past 4 quarterly comparisons were above the +25% minimum earnings guideline (C criteria).
>>> FEATURED STOCK ARTICLE : Volume-Driven Gain For New High Triggered Technical Buy Signal - 4/26/2018 |
View all notes |
Set NEW NOTE alert |
Company Profile |
SEC
News |
Chart |
Request a new note
C
A
S
I |
TPL
-
NYSE
Texas Pacific Land Trust
FINANCIAL SERVICES - Diversified Investments
|
$692.92
|
+13.92
2.05% |
$694.01
|
13,959
73.47% of 50 DAV
50 DAV is 19,000
|
$707.00
-1.99%
|
4/13/2018
|
$547.85
|
PP = $552.10
|
|
MB = $579.71
|
Most Recent Note - 5/30/2018 3:51:01 PM
G - Stubbornly holding its ground near its all-time high with volume totals cooling. Very extended from the prior highs in the $569-552 area and its 50 DMA line ($580) defining important support to watch on pullbacks.
>>> FEATURED STOCK ARTICLE : Perched Near Prior High After Showing Resilience - 4/20/2018 |
View all notes |
Set NEW NOTE alert |
Company Profile |
SEC
News |
Chart |
Request a new note
C
A
S
I |
STMP
-
NASDAQ
Stamps.com Inc
INTERNET - Internet Software and Services
|
$252.10
|
+2.15
0.86% |
$253.45
|
180,024
59.22% of 50 DAV
50 DAV is 304,000
|
$252.00
0.04%
|
5/4/2018
|
$234.15
|
PP = $233.23
|
|
MB = $244.89
|
Most Recent Note - 5/23/2018 4:34:32 PM
G - Stubbornly holding its ground in a tight range with volume totals cooling while perched at its all-time high. Extended from prior highs in the $233 area which define initial support above its 50 DMA line ($220).
>>> FEATURED STOCK ARTICLE : Volume-Driven Gain For New High - 5/4/2018 |
View all notes |
Set NEW NOTE alert |
Company Profile |
SEC
News |
Chart |
Request a new note
C
A
S
I |
CHDN
-
NASDAQ
Churchill Downs Inc
LEISURE - Gaming Activities
|
$304.70
|
-0.75
-0.25% |
$309.00
|
129,981
118.16% of 50 DAV
50 DAV is 110,000
|
$314.60
-3.15%
|
5/14/2018
|
$285.80
|
PP = $285.80
|
|
MB = $300.09
|
Most Recent Note - 5/25/2018 1:07:48 PM
G - Very extended from the previously noted base, and the prior highs in the $285-279 area define initial support to watch on pullbacks. Volume totals have been cooling while stubbornly holding its ground near its all-time high, indicative that very few sellers have been headed to the ticket window.
>>> FEATURED STOCK ARTICLE : Breakout Followed New Supreme Court Ruling on Sports Betting - 5/14/2018 |
View all notes |
Set NEW NOTE alert |
Company Profile |
SEC
News |
Chart |
Request a new note
C
A
S
I |
Symbol/Exchange
Company Name
Industry Group |
PRICE |
CHANGE
(%Change) |
Day High |
Volume
(% DAV)
(% 50 day avg vol) |
52 Wk Hi
% From Hi |
Featured
Date |
Price
Featured |
Pivot Featured |
|
Max Buy |
HTHT
-
NASDAQ
China Lodging Group Ads
LEISURE - Lodging
|
$44.02
|
+1.93
4.59% |
$44.46
|
3,259,978
159.02% of 50 DAV
50 DAV is 2,050,000
|
$44.29
-0.60%
|
5/15/2018
|
$34.52
|
PP = $41.57
|
|
MB = $43.65
|
Most Recent Note - 5/29/2018 12:24:18 PM
Y - Consolidating near its all-time high. Prior highs in the $40-41 area define initial support to watch on pullbacks. Do not be confused by the 4:1 split impacting share prices (Price Featured, Pivot Point and Max Buy were updated to account for the split).
>>> FEATURED STOCK ARTICLE : New Volume-Driven Breakout For All-Time High - 5/15/2018 |
View all notes |
Set NEW NOTE alert |
Company Profile |
SEC
News |
Chart |
Request a new note
C
A
S
I |
NFLX
-
NASDAQ
Netflix Inc
SPECIALTY RETAIL - Music and Video Stores
|
$353.54
|
+3.81
1.09% |
$354.00
|
5,651,020
57.38% of 50 DAV
50 DAV is 9,848,000
|
$356.10
-0.72%
|
5/24/2018
|
$348.85
|
PP = $338.92
|
|
MB = $355.87
|
Most Recent Note - 5/30/2018 4:19:32 PM
Y - Posted a small gain today on light volume for a best-ever close. Held its ground stubbornly after the 5/24/18 gain with +50% above average volume triggered a technical buy signal. Prior highs in the $338-333 area define initial support to watch above its 50 DMA line ($316).
>>> FEATURED STOCK ARTICLE : Rally From Advanced Ascending Base With Volume +50% - 5/24/2018 |
View all notes |
Set NEW NOTE alert |
Company Profile |
SEC
News |
Chart |
Request a new note
C
A
S
I |
DPZ
-
NYSE
Dominos Pizza Inc
WHOLESALE - Food Wholesale
|
$251.70
|
+5.90
2.40% |
$253.67
|
586,841
97.97% of 50 DAV
50 DAV is 599,000
|
$255.00
-1.29%
|
5/21/2018
|
$248.13
|
PP = $255.10
|
|
MB = $267.86
|
Most Recent Note - 5/29/2018 5:32:45 PM
Y - Fell today with higher volume. Sputtered since a new pivot point was cited based on its 4/26/18 high plus 10 cents after an advanced "3-weeks tight" base. Subsequent volume-driven gains above the pivot point may trigger a new (or add-on) technical buy signal. Its 50 DMA line ($239) and prior highs in the $236 area define important near-term support to watch on pullbacks.
>>> FEATURED STOCK ARTICLE : Earnings News Due From Pizza Firm - 4/23/2018 |
View all notes |
Set NEW NOTE alert |
Company Profile |
SEC
News |
Chart |
Request a new note
C
A
S
I |
FIVE
-
NASDAQ
Five Below Inc
Retail-DiscountandVariety
|
$71.96
|
+1.27
1.80% |
$72.06
|
752,772
50.42% of 50 DAV
50 DAV is 1,493,000
|
$78.28
-8.07%
|
3/9/2018
|
$68.58
|
PP = $73.65
|
|
MB = $77.33
|
Most Recent Note - 5/30/2018 3:33:42 PM
G - Volume totals have been below average in recent weeks while sputtering below its 50 DMA line ($72.48) and its color code is changed to green. A rebound above the 50 DMA line is needed for its outlook to improve. Subsequent damaging losses below the recent low ($69.37 on 5/02/18) may trigger a more worrisome technical sell signal.
>>> FEATURED STOCK ARTICLE : Trading Near 50-Day Average After Falling Into Prior Base - 5/7/2018 |
View all notes |
Set NEW NOTE alert |
Company Profile |
SEC
News |
Chart |
Request a new note
C
A
S
I |
NOW
-
NYSE
Servicenow Inc
Computer Sftwr-Enterprse
|
$178.47
|
+2.17
1.23% |
$179.85
|
2,211,293
114.93% of 50 DAV
50 DAV is 1,924,000
|
$182.59
-2.25%
|
5/8/2018
|
$174.63
|
PP = $176.66
|
|
MB = $185.49
|
Most Recent Note - 5/30/2018 4:21:50 PM
Y - Posted a gain with near average volume today nearly challenging its all-time high. Volume totals were light in recent weeks while consolidating above its 50 DMA line ($169.50). Stalled soon after highlighted in yellow with pivot point cited based on its 3/14/18 high plus 10 cents in the 5/08/18 mid-day report. Members are again reminded to follow proper discipline and always watch for strength indicative of fresh institutional buying demand - "Subsequent gains backed by at least +40% above average volume while rising above the pivot point may trigger a technical buy signal."
>>> FEATURED STOCK ARTICLE : High-Ranked Software - Enterprise Firm is Near Pivot Point - 5/8/2018 |
View all notes |
Set NEW NOTE alert |
Company Profile |
SEC
News |
Chart |
Request a new note
C
A
S
I |
Symbol/Exchange
Company Name
Industry Group |
PRICE |
CHANGE
(%Change) |
Day High |
Volume
(% DAV)
(% 50 day avg vol) |
52 Wk Hi
% From Hi |
Featured
Date |
Price
Featured |
Pivot Featured |
|
Max Buy |
NVEE
-
NASDAQ
N V 5 Global Inc
Comml Svcs-Consulting
|
$63.60
|
+3.00
4.95% |
$63.80
|
107,794
136.45% of 50 DAV
50 DAV is 79,000
|
$71.90
-11.54%
|
4/9/2018
|
$58.35
|
PP = $59.05
|
|
MB = $62.00
|
Most Recent Note - 5/30/2018 3:42:06 PM
Y - Posting a big gain today with near average volume. Found support recently when quietly consolidating near its 50 DMA line and prior highs in the $58-59 area. More damaging losses would raise greater concerns. Fundamentals remain strong.
>>> FEATURED STOCK ARTICLE : Encountered Distributional Pressure After Hitting New High - 5/11/2018 |
View all notes |
Set NEW NOTE alert |
Company Profile |
SEC
News |
Chart |
Request a new note
C
A
S
I |
QLYS
-
NASDAQ
Qualys Inc
Computer Sftwr-Security
|
$78.10
|
+1.40
1.83% |
$78.90
|
316,666
110.72% of 50 DAV
50 DAV is 286,000
|
$85.00
-8.12%
|
4/17/2018
|
$82.85
|
PP = $79.50
|
|
MB = $83.48
|
Most Recent Note - 5/29/2018 5:34:30 PM
Y - Color code is changed to yellow after rebounding above its 50 DMA line. Still faces resistance due to overhead supply up through the $85 level. Prior low ($68.20 on 5/02/18) defines the next important support above its 200 DMA line. See the latest FSU analysis for more details and a new annotated graph.
>>> FEATURED STOCK ARTICLE : Rebounded Above 50-Day Average Yet Still Faces Overhead Supply - 5/29/2018 |
View all notes |
Set NEW NOTE alert |
Company Profile |
SEC
News |
Chart |
Request a new note
C
A
S
I |
SPLK
-
NASDAQ
Splunk Inc
Computer Sftwr-Database
|
$111.50
|
+3.08
2.84% |
$111.92
|
2,251,809
130.01% of 50 DAV
50 DAV is 1,732,000
|
$119.00
-6.30%
|
5/8/2018
|
$113.14
|
PP = $112.76
|
|
MB = $118.40
|
Most Recent Note - 5/29/2018 12:44:39 PM
Y - Pulling back toward its 50 DMA line ($106.34) with 3 consecutive volume-driven losses, enduring distributional pressure. Prior high in the $108 area also defines near term support where more damaging losses would raise greater concerns. Last week it reported a loss of 7 cents per share on +37% sales revenues versus a loss of 9 cents per share for the year ago period ended April 30th. Wedging gains above the stock's pivot point recently were noted when below the +40% above average volume needed to trigger a proper technical buy signal.
>>> FEATURED STOCK ARTICLE : Found Support Near 50-Day Average on Pullbacks - 4/19/2018 |
View all notes |
Set NEW NOTE alert |
Company Profile |
SEC
News |
Chart |
Request a new note
C
A
S
I |
SUPN
-
NASDAQ
Supernus Pharmaceuticals
Medical-Biomed/Biotech
|
$57.35
|
+1.30
2.32% |
$57.55
|
571,377
78.38% of 50 DAV
50 DAV is 729,000
|
$59.05
-2.88%
|
4/24/2018
|
$47.73
|
PP = $50.15
|
|
MB = $52.66
|
Most Recent Note - 5/29/2018 5:29:20 PM
G - Hovering near its all-time high, still extended from the previously noted base. Prior highs in the $49-50 area define initial support to watch along with its 50 DMA line.
>>> FEATURED STOCK ARTICLE : Pharmaceutical Firm Perched Near Record High - 4/24/2018 |
View all notes |
Set NEW NOTE alert |
Company Profile |
SEC
News |
Chart |
Request a new note
C
A
S
I |
PAYC
-
NYSE
Paycom Software Inc
COMPUTER SOFTWARE and SERVICES - Application Software
|
$105.02
|
+0.97
0.93% |
$107.38
|
512,445
68.51% of 50 DAV
50 DAV is 748,000
|
$118.45
-11.34%
|
2/15/2018
|
$95.01
|
PP = $93.61
|
|
MB = $98.29
|
Most Recent Note - 5/30/2018 3:46:45 PM
G - Posting a 5th consecutive small gain today on light volume but still remains below its 50 DMA line. Halted its slide last week after undercutting prior lows in the $101 area. More damaging losses would raise greater concerns. A rebound above the 50 DMA line ($108.40) is needed for its outlook to improve.
>>> FEATURED STOCK ARTICLE : Violation of 50-Day Average Triggered Technical Sell Signal - 5/3/2018 |
View all notes |
Set NEW NOTE alert |
Company Profile |
SEC
News |
Chart |
Request a new note
C
A
S
I |
Symbol/Exchange
Company Name
Industry Group |
PRICE |
CHANGE
(%Change) |
Day High |
Volume
(% DAV)
(% 50 day avg vol) |
52 Wk Hi
% From Hi |
Featured
Date |
Price
Featured |
Pivot Featured |
|
Max Buy |
GRUB
-
NYSE
Grubhub Inc
COMPUTER SOFTWARE and SERVICES - Technical and System Software
|
$107.54
|
+6.41
6.34% |
$108.22
|
1,828,742
127.53% of 50 DAV
50 DAV is 1,434,000
|
$112.41
-4.33%
|
5/30/2018
|
$107.56
|
PP = $105.68
|
|
MB = $110.96
|
Most Recent Note - 5/30/2018 3:40:06 PM
Y - Color code is changed to yellow with new pivot point cited based on its 4/23/18 high. It formed a double bottom base, however subsequent gains and a close above the pivot point backed by at least +40% above average volume is needed to trigger a convincing technical buy signal. Posting a solid gain today on near average volume and little resistance remains due to overhead supply up to the $112 level. Found support near its 50 DMA line ($101.29). Recently reported earnings +79% on +49% sales revenues for the Mar '18 quarter.
>>> FEATURED STOCK ARTICLE : Consolidating Near 50 Day Average With Earnings News Due - 4/30/2018 |
View all notes |
Set NEW NOTE alert |
Company Profile |
SEC
News |
Chart |
Request a new note
C
A
S
I |
HQY
-
NASDAQ
Healthequity Inc
COMPUTER SOFTWARE and SERVICES - Healthcare Information Service
|
$78.00
|
+1.24
1.62% |
$78.10
|
446,012
76.37% of 50 DAV
50 DAV is 584,000
|
$77.19
1.05%
|
5/2/2018
|
$66.31
|
PP = $68.85
|
|
MB = $72.29
|
Most Recent Note - 5/30/2018 3:54:09 PM
G - Volume totals still have been below average while wedging into new all-time high territory, getting very extended above the "max buy" level. Prior high ($68.75 on 3/22/18) and its 50 DMA line ($67.49) define near term support to watch on pullbacks.
>>> FEATURED STOCK ARTICLE : Perched Near All-Time High Building a Short New Base - 4/25/2018 |
View all notes |
Set NEW NOTE alert |
Company Profile |
SEC
News |
Chart |
Request a new note
C
A
S
I |
LOB
-
NASDAQ
Live Oak Bancshares Inc
Banks-Southeast
|
$30.05
|
+0.55
1.86% |
$30.05
|
122,819
113.72% of 50 DAV
50 DAV is 108,000
|
$30.05
0.00%
|
5/21/2018
|
$29.35
|
PP = $30.15
|
|
MB = $31.66
|
Most Recent Note - 5/30/2018 3:56:54 PM
Y - Matched its all-time high with today's gain on near average volume, poised for its best-ever close. Subsequent volume-driven gains above the pivot point may trigger a technical buy signal. Prior lows in the $26-27 area define important near term support. Recently reported earnings +63% on +42% for the Mar '18 quarter.
>>> FEATURED STOCK ARTICLE : Bank Perched Near High After Orderly Base - 5/23/2018 |
View all notes |
Set NEW NOTE alert |
Company Profile |
SEC
News |
Chart |
Request a new note
C
A
S
I |
PYPL
-
NASDAQ
Paypal Holdings Inc
Finance-CrdtCard/PmtPr
|
$81.60
|
+0.87
1.08% |
$82.06
|
5,470,781
64.36% of 50 DAV
50 DAV is 8,500,000
|
$86.32
-5.47%
|
5/18/2018
|
$81.63
|
PP = $80.89
|
|
MB = $84.93
|
Most Recent Note - 5/25/2018 1:14:07 PM
Y - This week it rose above the pivot point cited based on its 4/18/18 high after forming a "double bottom" base, however gains were lacking the +40% above average volume necessary to clinch a convincing technical buy signal. Confirming volume-driven gains would be a reassuring sign of fresh institutional buying demand. The 50 DMA line ($77.45) defines near-term support above its 200 DMA line and prior lows in the $71-72 area. Fundamentals remain strong.
>>> FEATURED STOCK ARTICLE : Slumping Near Important Near-Term Support - 4/27/2018 |
View all notes |
Set NEW NOTE alert |
Company Profile |
SEC
News |
Chart |
Request a new note
C
A
S
I |
OLLI
-
NASDAQ
Ollie's Bargain Outlet
Retail-DiscountandVariety
|
$71.15
|
+0.35
0.49% |
$71.70
|
495,733
73.55% of 50 DAV
50 DAV is 674,000
|
$71.45
-0.42%
|
4/10/2018
|
$62.05
|
PP = $62.15
|
|
MB = $65.26
|
Most Recent Note - 5/30/2018 3:44:39 PM
G - Quietly inching to yet another new all-time high with today's 15th gain in the span of 16 sessions. Very extended from any sound base and the prior high in the $64 area defines initial support along with its 50 DMA line ($63.39).
>>> FEATURED STOCK ARTICLE : Extended From Prior Base After 8 Consecutive Gains - 5/17/2018 |
View all notes |
Set NEW NOTE alert |
Company Profile |
SEC
News |
Chart |
Request a new note
C
A
S
I |
Symbol/Exchange
Company Name
Industry Group |
PRICE |
CHANGE
(%Change) |
Day High |
Volume
(% DAV)
(% 50 day avg vol) |
52 Wk Hi
% From Hi |
Featured
Date |
Price
Featured |
Pivot Featured |
|
Max Buy |
NOVT
-
NASDAQ
Novanta Inc
Elec-Scientific/Msrng
|
$63.65
|
+0.65
1.03% |
$63.90
|
252,447
116.34% of 50 DAV
50 DAV is 217,000
|
$66.25
-3.92%
|
4/17/2018
|
$60.55
|
PP = $60.40
|
|
MB = $63.42
|
Most Recent Note - 5/25/2018 6:11:29 PM
Y - Sputtering after a noted "negative reversal" on 5/15/18 at its 52-week high. Found support near prior highs in the $58 area and stayed above its 50 DMA line ($58.16) during the recent consolidation. See the latest FSU analysis for more details and a new annotated graph.
>>> FEATURED STOCK ARTICLE : Quietly Hovering Near All-Time High - 5/25/2018 |
View all notes |
Set NEW NOTE alert |
Company Profile |
SEC
News |
Chart |
Request a new note
C
A
S
I |
BZUN
-
NASDAQ
Baozun Inc Cl A Ads
Computer Sftwr-Enterprse
|
$59.86
|
+2.24
3.89% |
$60.00
|
2,157,755
79.62% of 50 DAV
50 DAV is 2,710,000
|
$59.80
0.10%
|
5/15/2018
|
$45.38
|
PP = $52.43
|
|
MB = $55.05
|
Most Recent Note - 5/30/2018 4:05:18 PM
G - Hit yet another new all-time high with today's gain backed by lighter than average volume, getting more extended from the prior base. Prior highs in the $51-53 area define initial support to watch on pullbacks.
>>> FEATURED STOCK ARTICLE : Earnings News Due; Formed a Base-on-Base Pattern - 5/16/2018 |
View all notes |
Set NEW NOTE alert |
Company Profile |
SEC
News |
Chart |
Request a new note
C
A
S
I |
SEDG
-
NASDAQ
Solaredge Technologies
Energy-Solar
|
$58.65
|
-1.55
-2.57% |
$61.00
|
1,723,169
178.75% of 50 DAV
50 DAV is 964,000
|
$70.74
-17.09%
|
5/9/2018
|
$55.33
|
PP = $59.30
|
|
MB = $62.27
|
Most Recent Note - 5/25/2018 1:16:34 PM
Y - Finding prompt support today after briefly undercutting prior highs and its 50 DMA line ($56.95) with 2 consecutive big volume-driven losses. More damaging losses would trigger a worrisome technical sell signal.
>>> FEATURED STOCK ARTICLE : Quickly Rallied Following Strong Earnings News - 5/10/2018 |
View all notes |
Set NEW NOTE alert |
Company Profile |
SEC
News |
Chart |
Request a new note
C
A
S
I |
SEND
-
NYSE
Sendgrid Inc
INTERNET - Content
|
$26.85
|
+0.44
1.67% |
$26.91
|
572,408
130.09% of 50 DAV
50 DAV is 440,000
|
$32.03
-16.16%
|
3/6/2018
|
$28.00
|
PP = $28.37
|
|
MB = $29.79
|
Most Recent Note - 5/30/2018 3:48:15 PM
G - Met resistance in recent weeks, and a convincing rebound above the 50 DMA line ($27.27) is still needed for its outlook to improve. The prior low ($23.77 on 4/04/18) defines the next important support to watch. Completed a new Public Offering and Secondary Offering on 4/05/18.
>>> FEATURED STOCK ARTICLE : Earnings News Continues to be Strong - 5/1/2018 |
View all notes |
Set NEW NOTE alert |
Company Profile |
SEC
News |
Chart |
Request a new note
C
A
S
I |