***Last / Change / Volume data in this table is the closing quote data***
Symbol/Exchange
Company Name
Industry Group |
PRICE |
CHANGE
(%Change) |
Day High |
Volume
(% DAV)
(% 50 day avg vol) |
52 Wk Hi
% From Hi |
Featured
Date |
Price
Featured |
Pivot Featured |
|
Max Buy |
OSBC
-
NASDAQ
Old Second Bancorp Inc
BANKING - Regional - Midwest Banks
|
$15.20
|
+0.25
1.67% |
$15.20
|
68,122
123.86% of 50 DAV
50 DAV is 55,000
|
$15.55
-2.25%
|
5/21/2018
|
$15.50
|
PP = $15.10
|
|
MB = $15.86
|
Most Recent Note - 5/29/2018 5:37:13 PM
Y - Slumped back into the prior base with a loss on light volume today raising concerns. Stalled after highlighted in yellow on 5/21/18 with pivot point cited based on prior highs plus 10 cents. Fundamentals are strong.
>>> FEATURED STOCK ARTICLE : Hit New High Today After Orderly Consolidation - 5/21/2018 |
View all notes |
Set NEW NOTE alert |
Company Profile |
SEC
News |
Chart |
Request a new note
C
A
S
I |
PFBC
-
NASDAQ
Preferred Bank Los Angls
BANKING - Regional - Pacific Banks
|
$64.17
|
+0.47
0.74% |
$64.61
|
81,650
98.97% of 50 DAV
50 DAV is 82,500
|
$67.65
-5.14%
|
5/18/2018
|
$62.91
|
PP = $67.75
|
|
MB = $71.14
|
Most Recent Note - 5/29/2018 5:31:14 PM
G - Sank below its 50 DMA line ($64.46) with higher volume behind today's loss and its color code is changed to green. Gains above the 50 DMA line are needed for its outlook to improve. Its Relative Strength rating has slumped below the 80+ minimum guideline to 71, yet it remains only -6.5% off its high. Despite concerns its color code was changed to yellow with new pivot point cited based on its 1/22/18 high plus 10 cents. Subsequent gains above the pivot point are needed to trigger a technical buy signal. See the latest FSU analysis for more details and an annotated graph.
>>> FEATURED STOCK ARTICLE : Some Technical Sputtering Yet Bank is Still Only -7% Off High - 5/18/2018 |
View all notes |
Set NEW NOTE alert |
Company Profile |
SEC
News |
Chart |
Request a new note
C
A
S
I |
SIVB
-
NASDAQ
S V B Financial Group
BANKING - Regional - Pacific Banks
|
$317.73
|
+5.60
1.79% |
$319.70
|
673,876
115.59% of 50 DAV
50 DAV is 583,000
|
$327.91
-3.10%
|
3/12/2018
|
$267.79
|
PP = $263.19
|
|
MB = $276.35
|
Most Recent Note - 5/29/2018 5:28:18 PM
G - Gapped down today retreating from its all-time high. recently noted as very extended from any sound base after a big "breakaway gap" for a new high was noted on 4/27/18. Fundamentals are strong.
>>> FEATURED STOCK ARTICLE : Wedging Higher Following Big Breakaway Gap - 5/22/2018 |
View all notes |
Set NEW NOTE alert |
Company Profile |
SEC
News |
Chart |
Request a new note
C
A
S
I |
UCFC
-
NASDAQ
United Community Finl Cp
BANKING - Savings and Loans
|
$10.57
|
+0.11
1.05% |
$10.59
|
143,386
155.18% of 50 DAV
50 DAV is 92,400
|
$10.70
-1.21%
|
5/30/2018
|
$10.50
|
PP = $10.80
|
|
MB = $11.34
|
Most Recent Note - 5/31/2018 4:17:06 PM
Y - There was a "negative reversal" today after challenging its all-time high. Churned heavy volume but finished unchanged on the prior session after highlighted in yellow with pivot point cited based on its 4/19/18 high plus 10 cents. Subsequent volume-driven gains above the pivot point may trigger a technical buy signal. Thinly-traded Bank holding company is hovering near its 52-week high, still building on an orderly base-on-base pattern. Reported Mar '18 quarterly earnings +70% on +21% sales revenues, continuing its strong earnings streak above the +25% minimum guideline (C criteria) of the fact-based investment system. Annual earnings history since FY '13 has been strong. See the latest FSU analysis for more details and an annotated graph.
>>> FEATURED STOCK ARTICLE : Small Savings & Loan Perched Near High - 5/30/2018 |
View all notes |
Set NEW NOTE alert |
Company Profile |
SEC
News |
Chart |
Request a new note
C
A
S
I |
EPAM
-
NYSE
Epam Systems Inc
COMPUTER SOFTWARE and SERVICES - Information Technology Service
|
$124.00
|
+0.82
0.67% |
$124.50
|
144,609
51.10% of 50 DAV
50 DAV is 283,000
|
$131.75
-5.88%
|
5/9/2018
|
$120.34
|
PP = $125.98
|
|
MB = $132.28
|
Most Recent Note - 5/30/2018 3:31:23 PM
Y - Stalled after its recent breakout and it is quietly consolidating near the prior high ($125.88 on 3/13/18). Additional near-term support is defined by prior highs in the $119 area and its 50 DMA line ($117.92).
>>> FEATURED STOCK ARTICLE : Volume-Driven Gain Challenged Prior High Following Earnings - 5/9/2018 |
View all notes |
Set NEW NOTE alert |
Company Profile |
SEC
News |
Chart |
Request a new note
C
A
S
I |
Symbol/Exchange
Company Name
Industry Group |
PRICE |
CHANGE
(%Change) |
Day High |
Volume
(% DAV)
(% 50 day avg vol) |
52 Wk Hi
% From Hi |
Featured
Date |
Price
Featured |
Pivot Featured |
|
Max Buy |
MA
-
NYSE
Mastercard Inc Cl A
DIVERSIFIED SERVICES - Business/Management Services
|
$195.37
|
+5.25
2.76% |
$195.37
|
4,193,844
107.81% of 50 DAV
50 DAV is 3,890,000
|
$194.72
0.33%
|
5/2/2018
|
$184.96
|
PP = $183.83
|
|
MB = $193.02
|
Most Recent Note - 5/30/2018 3:58:20 PM
Y - Still stubbornly holding its ground near its "max buy" level and all-time high. Prior highs in the $183 area and its 50 DMA line (181.45) define support to watch on pullbacks.
>>> FEATURED STOCK ARTICLE : Gap Up and Volume Driven Gain for New High After Earnings - 5/2/2018 |
View all notes |
Set NEW NOTE alert |
Company Profile |
SEC
News |
Chart |
Request a new note
C
A
S
I |
V
-
NYSE
Visa Inc Cl A
DIVERSIFIED SERVICES - Business/Management Services
|
$130.85
|
+0.13
0.10% |
$132.51
|
8,305,008
109.08% of 50 DAV
50 DAV is 7,614,000
|
$132.50
-1.25%
|
4/26/2018
|
$126.68
|
PP = $126.98
|
|
MB = $133.33
|
Most Recent Note - 5/31/2018 4:06:13 PM
Y - Endured distributional pressure this week while still stubbornly holding its ground in a tight range near its all-time high. Prior highs in the $126 area and its 50 DMA line ($125) define near-term support to watch on pullbacks.
>>> FEATURED STOCK ARTICLE : Volume-Driven Gain For New High Triggered Technical Buy Signal - 4/26/2018 |
View all notes |
Set NEW NOTE alert |
Company Profile |
SEC
News |
Chart |
Request a new note
C
A
S
I |
TPL
-
NYSE
Texas Pacific Land Trust
FINANCIAL SERVICES - Diversified Investments
|
$716.04
|
+9.34
1.32% |
$716.78
|
15,573
81.96% of 50 DAV
50 DAV is 19,000
|
$707.99
1.14%
|
4/13/2018
|
$547.85
|
PP = $552.10
|
|
MB = $579.71
|
Most Recent Note - 5/30/2018 3:51:01 PM
G - Stubbornly holding its ground near its all-time high with volume totals cooling. Very extended from the prior highs in the $569-552 area and its 50 DMA line ($580) defining important support to watch on pullbacks.
>>> FEATURED STOCK ARTICLE : Perched Near Prior High After Showing Resilience - 4/20/2018 |
View all notes |
Set NEW NOTE alert |
Company Profile |
SEC
News |
Chart |
Request a new note
C
A
S
I |
STMP
-
NASDAQ
Stamps.com Inc
INTERNET - Internet Software and Services
|
$257.60
|
+6.80
2.71% |
$261.45
|
266,310
88.18% of 50 DAV
50 DAV is 302,000
|
$254.69
1.14%
|
5/4/2018
|
$234.15
|
PP = $233.23
|
|
MB = $244.89
|
Most Recent Note - 5/31/2018 4:03:03 PM
G - Still stubbornly holding its ground in a very tight range with volume totals cooling while perched at its all-time high. Extended from prior highs in the $233 area which define initial support above its 50 DMA line ($220).
>>> FEATURED STOCK ARTICLE : Volume-Driven Gain For New High - 5/4/2018 |
View all notes |
Set NEW NOTE alert |
Company Profile |
SEC
News |
Chart |
Request a new note
C
A
S
I |
CHDN
-
NASDAQ
Churchill Downs Inc
LEISURE - Gaming Activities
|
$296.25
|
-3.15
-1.05% |
$302.15
|
122,992
110.80% of 50 DAV
50 DAV is 111,000
|
$314.60
-5.83%
|
5/14/2018
|
$285.80
|
PP = $285.80
|
|
MB = $300.09
|
Most Recent Note - 5/31/2018 4:09:00 PM
Y - Color code is changed to yellow after quietly consolidating below its "max buy" level. Prior highs in the $285-279 area define initial support to watch above its 50 DMA line ($268).
>>> FEATURED STOCK ARTICLE : Breakout Followed New Supreme Court Ruling on Sports Betting - 5/14/2018 |
View all notes |
Set NEW NOTE alert |
Company Profile |
SEC
News |
Chart |
Request a new note
C
A
S
I |
Symbol/Exchange
Company Name
Industry Group |
PRICE |
CHANGE
(%Change) |
Day High |
Volume
(% DAV)
(% 50 day avg vol) |
52 Wk Hi
% From Hi |
Featured
Date |
Price
Featured |
Pivot Featured |
|
Max Buy |
HTHT
-
NASDAQ
China Lodging Group Ads
LEISURE - Lodging
|
$45.36
|
+1.35
3.07% |
$45.69
|
2,027,196
86.78% of 50 DAV
50 DAV is 2,336,000
|
$45.10
0.58%
|
5/15/2018
|
$34.52
|
PP = $41.57
|
|
MB = $43.65
|
Most Recent Note - 5/31/2018 12:46:52 PM
Y - Erased early gains after trading above its "max buy" level and touching a new all-time high today. Prior highs in the $40-41 area define initial support to watch on pullbacks. Do not be confused by the 4:1 split impacting share prices (Price Featured, Pivot Point and Max Buy were updated to account for the split).
>>> FEATURED STOCK ARTICLE : New Volume-Driven Breakout For All-Time High - 5/15/2018 |
View all notes |
Set NEW NOTE alert |
Company Profile |
SEC
News |
Chart |
Request a new note
C
A
S
I |
NFLX
-
NASDAQ
Netflix Inc
SPECIALTY RETAIL - Music and Video Stores
|
$359.93
|
+8.33
2.37% |
$359.99
|
7,072,801
72.30% of 50 DAV
50 DAV is 9,782,000
|
$356.10
1.08%
|
5/24/2018
|
$348.85
|
PP = $338.92
|
|
MB = $355.87
|
Most Recent Note - 5/30/2018 4:19:32 PM
Y - Posted a small gain today on light volume for a best-ever close. Held its ground stubbornly after the 5/24/18 gain with +50% above average volume triggered a technical buy signal. Prior highs in the $338-333 area define initial support to watch above its 50 DMA line ($316).
>>> FEATURED STOCK ARTICLE : Rally From Advanced Ascending Base With Volume +50% - 5/24/2018 |
View all notes |
Set NEW NOTE alert |
Company Profile |
SEC
News |
Chart |
Request a new note
C
A
S
I |
DPZ
-
NYSE
Dominos Pizza Inc
WHOLESALE - Food Wholesale
|
$252.85
|
+1.37
0.54% |
$257.43
|
557,392
93.21% of 50 DAV
50 DAV is 598,000
|
$255.00
-0.84%
|
5/21/2018
|
$248.13
|
PP = $255.10
|
|
MB = $267.86
|
Most Recent Note - 5/29/2018 5:32:45 PM
Y - Fell today with higher volume. Sputtered since a new pivot point was cited based on its 4/26/18 high plus 10 cents after an advanced "3-weeks tight" base. Subsequent volume-driven gains above the pivot point may trigger a new (or add-on) technical buy signal. Its 50 DMA line ($239) and prior highs in the $236 area define important near-term support to watch on pullbacks.
>>> FEATURED STOCK ARTICLE : Earnings News Due From Pizza Firm - 4/23/2018 |
View all notes |
Set NEW NOTE alert |
Company Profile |
SEC
News |
Chart |
Request a new note
C
A
S
I |
FIVE
-
NASDAQ
Five Below Inc
Retail-DiscountandVariety
|
$71.39
|
+0.68
0.96% |
$72.07
|
1,135,065
77.01% of 50 DAV
50 DAV is 1,474,000
|
$78.28
-8.80%
|
3/9/2018
|
$68.58
|
PP = $73.65
|
|
MB = $77.33
|
Most Recent Note - 5/30/2018 3:33:42 PM
G - Volume totals have been below average in recent weeks while sputtering below its 50 DMA line ($72.48) and its color code is changed to green. A rebound above the 50 DMA line is needed for its outlook to improve. Subsequent damaging losses below the recent low ($69.37 on 5/02/18) may trigger a more worrisome technical sell signal.
>>> FEATURED STOCK ARTICLE : Trading Near 50-Day Average After Falling Into Prior Base - 5/7/2018 |
View all notes |
Set NEW NOTE alert |
Company Profile |
SEC
News |
Chart |
Request a new note
C
A
S
I |
NOW
-
NYSE
Servicenow Inc
Computer Sftwr-Enterprse
|
$181.51
|
+3.90
2.20% |
$181.57
|
1,271,575
66.61% of 50 DAV
50 DAV is 1,909,000
|
$182.59
-0.59%
|
5/8/2018
|
$174.63
|
PP = $176.66
|
|
MB = $185.49
|
Most Recent Note - 5/30/2018 4:21:50 PM
Y - Posted a gain with near average volume today nearly challenging its all-time high. Volume totals were light in recent weeks while consolidating above its 50 DMA line ($169.50). Stalled soon after highlighted in yellow with pivot point cited based on its 3/14/18 high plus 10 cents in the 5/08/18 mid-day report. Members are again reminded to follow proper discipline and always watch for strength indicative of fresh institutional buying demand - "Subsequent gains backed by at least +40% above average volume while rising above the pivot point may trigger a technical buy signal."
>>> FEATURED STOCK ARTICLE : High-Ranked Software - Enterprise Firm is Near Pivot Point - 5/8/2018 |
View all notes |
Set NEW NOTE alert |
Company Profile |
SEC
News |
Chart |
Request a new note
C
A
S
I |
Symbol/Exchange
Company Name
Industry Group |
PRICE |
CHANGE
(%Change) |
Day High |
Volume
(% DAV)
(% 50 day avg vol) |
52 Wk Hi
% From Hi |
Featured
Date |
Price
Featured |
Pivot Featured |
|
Max Buy |
NVEE
-
NASDAQ
N V 5 Global Inc
Comml Svcs-Consulting
|
$63.75
|
+0.95
1.51% |
$64.70
|
91,202
112.60% of 50 DAV
50 DAV is 81,000
|
$71.90
-11.34%
|
4/9/2018
|
$58.35
|
PP = $59.05
|
|
MB = $62.00
|
Most Recent Note - 5/30/2018 3:42:06 PM
Y - Posting a big gain today with near average volume. Found support recently when quietly consolidating near its 50 DMA line and prior highs in the $58-59 area. More damaging losses would raise greater concerns. Fundamentals remain strong.
>>> FEATURED STOCK ARTICLE : Encountered Distributional Pressure After Hitting New High - 5/11/2018 |
View all notes |
Set NEW NOTE alert |
Company Profile |
SEC
News |
Chart |
Request a new note
C
A
S
I |
QLYS
-
NASDAQ
Qualys Inc
Computer Sftwr-Security
|
$78.10
|
+1.15
1.49% |
$78.60
|
195,863
69.45% of 50 DAV
50 DAV is 282,000
|
$85.00
-8.12%
|
4/17/2018
|
$82.85
|
PP = $79.50
|
|
MB = $83.48
|
Most Recent Note - 5/29/2018 5:34:30 PM
Y - Color code is changed to yellow after rebounding above its 50 DMA line. Still faces resistance due to overhead supply up through the $85 level. Prior low ($68.20 on 5/02/18) defines the next important support above its 200 DMA line. See the latest FSU analysis for more details and a new annotated graph.
>>> FEATURED STOCK ARTICLE : Rebounded Above 50-Day Average Yet Still Faces Overhead Supply - 5/29/2018 |
View all notes |
Set NEW NOTE alert |
Company Profile |
SEC
News |
Chart |
Request a new note
C
A
S
I |
SPLK
-
NASDAQ
Splunk Inc
Computer Sftwr-Database
|
$113.95
|
+3.14
2.83% |
$113.97
|
1,461,727
83.72% of 50 DAV
50 DAV is 1,746,000
|
$119.00
-4.24%
|
5/8/2018
|
$113.14
|
PP = $112.76
|
|
MB = $118.40
|
Most Recent Note - 5/31/2018 5:50:38 PM
Y - Consolidating above its 50 DMA line ($106.45) after volume-driven losses tested the prior high in the $108 area. More damaging losses would raise greater concerns and trigger technical sell signals. Confirming gains above the stock's pivot point backed by a minimum of +40% above average would be a reassuring sign of fresh institutional buying demand and may clinch a proper technical buy signal. See the latest FSU analysis for more details and a new annotated graph.
>>> FEATURED STOCK ARTICLE : Consolidating Near High Following Latest Financial Report - 5/31/2018 |
View all notes |
Set NEW NOTE alert |
Company Profile |
SEC
News |
Chart |
Request a new note
C
A
S
I |
SUPN
-
NASDAQ
Supernus Pharmaceuticals
Medical-Biomed/Biotech
|
$57.70
|
+1.35
2.40% |
$57.75
|
766,158
104.95% of 50 DAV
50 DAV is 730,000
|
$59.05
-2.29%
|
4/24/2018
|
$47.73
|
PP = $50.15
|
|
MB = $52.66
|
Most Recent Note - 5/29/2018 5:29:20 PM
G - Hovering near its all-time high, still extended from the previously noted base. Prior highs in the $49-50 area define initial support to watch along with its 50 DMA line.
>>> FEATURED STOCK ARTICLE : Pharmaceutical Firm Perched Near Record High - 4/24/2018 |
View all notes |
Set NEW NOTE alert |
Company Profile |
SEC
News |
Chart |
Request a new note
C
A
S
I |
PAYC
-
NYSE
Paycom Software Inc
COMPUTER SOFTWARE and SERVICES - Application Software
|
$105.57
|
+0.10
0.09% |
$106.56
|
658,768
87.60% of 50 DAV
50 DAV is 752,000
|
$118.45
-10.87%
|
2/15/2018
|
$95.01
|
PP = $93.61
|
|
MB = $98.29
|
Most Recent Note - 5/30/2018 3:46:45 PM
G - Posting a 5th consecutive small gain today on light volume but still remains below its 50 DMA line. Halted its slide last week after undercutting prior lows in the $101 area. More damaging losses would raise greater concerns. A rebound above the 50 DMA line ($108.40) is needed for its outlook to improve.
>>> FEATURED STOCK ARTICLE : Violation of 50-Day Average Triggered Technical Sell Signal - 5/3/2018 |
View all notes |
Set NEW NOTE alert |
Company Profile |
SEC
News |
Chart |
Request a new note
C
A
S
I |
Symbol/Exchange
Company Name
Industry Group |
PRICE |
CHANGE
(%Change) |
Day High |
Volume
(% DAV)
(% 50 day avg vol) |
52 Wk Hi
% From Hi |
Featured
Date |
Price
Featured |
Pivot Featured |
|
Max Buy |
GRUB
-
NYSE
Grubhub Inc
COMPUTER SOFTWARE and SERVICES - Technical and System Software
|
$107.77
|
+0.56
0.52% |
$109.95
|
1,427,664
98.80% of 50 DAV
50 DAV is 1,445,000
|
$112.41
-4.13%
|
5/30/2018
|
$107.56
|
PP = $105.68
|
|
MB = $110.96
|
Most Recent Note - 5/30/2018 3:40:06 PM
Y - Color code is changed to yellow with new pivot point cited based on its 4/23/18 high. It formed a double bottom base, however subsequent gains and a close above the pivot point backed by at least +40% above average volume is needed to trigger a convincing technical buy signal. Posting a solid gain today on near average volume and little resistance remains due to overhead supply up to the $112 level. Found support near its 50 DMA line ($101.29). Recently reported earnings +79% on +49% sales revenues for the Mar '18 quarter.
>>> FEATURED STOCK ARTICLE : Consolidating Near 50 Day Average With Earnings News Due - 4/30/2018 |
View all notes |
Set NEW NOTE alert |
Company Profile |
SEC
News |
Chart |
Request a new note
C
A
S
I |
HQY
-
NASDAQ
Healthequity Inc
COMPUTER SOFTWARE and SERVICES - Healthcare Information Service
|
$76.09
|
+1.78
2.40% |
$76.24
|
863,094
160.73% of 50 DAV
50 DAV is 537,000
|
$78.10
-2.57%
|
5/2/2018
|
$66.31
|
PP = $68.85
|
|
MB = $72.29
|
 Most Recent Note - 6/1/2018 5:36:02 PM
G - Posted a volume-driven gain today and it finished near its all-time high, very extended above the "max buy" level. Prior high ($68.75 on 3/22/18) and its 50 DMA line ($67.90) define near term support to watch on pullbacks.
>>> FEATURED STOCK ARTICLE : Perched Near All-Time High Building a Short New Base - 4/25/2018 |
View all notes |
Set NEW NOTE alert |
Company Profile |
SEC
News |
Chart |
Request a new note
C
A
S
I |
LOB
-
NASDAQ
Live Oak Bancshares Inc
Banks-Southeast
|
$30.05
|
+0.50
1.69% |
$30.25
|
69,199
65.28% of 50 DAV
50 DAV is 106,000
|
$30.45
-1.31%
|
5/21/2018
|
$29.35
|
PP = $30.15
|
|
MB = $31.66
|
Most Recent Note - 5/30/2018 3:56:54 PM
Y - Matched its all-time high with today's gain on near average volume, poised for its best-ever close. Subsequent volume-driven gains above the pivot point may trigger a technical buy signal. Prior lows in the $26-27 area define important near term support. Recently reported earnings +63% on +42% for the Mar '18 quarter.
>>> FEATURED STOCK ARTICLE : Bank Perched Near High After Orderly Base - 5/23/2018 |
View all notes |
Set NEW NOTE alert |
Company Profile |
SEC
News |
Chart |
Request a new note
C
A
S
I |
PYPL
-
NASDAQ
Paypal Holdings Inc
Finance-CrdtCard/PmtPr
|
$83.25
|
+1.18
1.44% |
$83.46
|
7,055,790
83.53% of 50 DAV
50 DAV is 8,447,000
|
$86.32
-3.56%
|
5/18/2018
|
$81.63
|
PP = $80.89
|
|
MB = $84.93
|
Most Recent Note - 5/31/2018 4:14:27 PM
Y - Recent gains lacked great volume conviction as it wedged above the pivot point cited based on its 4/18/18 high. Confirming gains backed by at least +40% above average volume would be a reassuring sign of fresh institutional buying demand. The 50 DMA line ($77.47) defines near-term support above its 200 DMA line and prior lows in the $71-72 area. Fundamentals remain strong.
>>> FEATURED STOCK ARTICLE : Slumping Near Important Near-Term Support - 4/27/2018 |
View all notes |
Set NEW NOTE alert |
Company Profile |
SEC
News |
Chart |
Request a new note
C
A
S
I |
OLLI
-
NASDAQ
Ollie's Bargain Outlet
Retail-DiscountandVariety
|
$70.55
|
-0.15
-0.21% |
$71.50
|
833,664
123.51% of 50 DAV
50 DAV is 675,000
|
$71.70
-1.60%
|
4/10/2018
|
$62.05
|
PP = $62.15
|
|
MB = $65.26
|
Most Recent Note - 5/30/2018 3:44:39 PM
G - Quietly inching to yet another new all-time high with today's 15th gain in the span of 16 sessions. Very extended from any sound base and the prior high in the $64 area defines initial support along with its 50 DMA line ($63.39).
>>> FEATURED STOCK ARTICLE : Extended From Prior Base After 8 Consecutive Gains - 5/17/2018 |
View all notes |
Set NEW NOTE alert |
Company Profile |
SEC
News |
Chart |
Request a new note
C
A
S
I |
Symbol/Exchange
Company Name
Industry Group |
PRICE |
CHANGE
(%Change) |
Day High |
Volume
(% DAV)
(% 50 day avg vol) |
52 Wk Hi
% From Hi |
Featured
Date |
Price
Featured |
Pivot Featured |
|
Max Buy |
MOMO
-
NASDAQ
Momo Inc Ads Cl A
INTERNET - Content
|
$49.60
|
+3.68
8.01% |
$49.91
|
11,641,985
272.45% of 50 DAV
50 DAV is 4,273,000
|
$46.69
6.23%
|
6/1/2018
|
$48.62
|
PP = $46.79
|
|
MB = $49.13
|
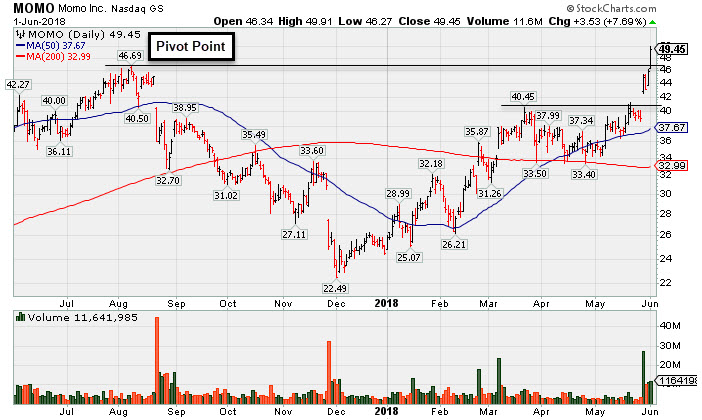
Most Recent Note - 6/1/2018 5:30:13 PM
Y - Finished strong today after highlighted in yellow in the earlier mid-day report (read here) with pivot point cited based on its 8/08/17 high plus 10 cents after a 9-month base. Gapped up today hitting a new all-time high with a 3rd volume-driven gain in the span of 4 sessions. Reported earnings +57% on +64% sales revenues for the Mar '18 quarter. The Dec '17 quarter showed earnings +20%, however, three of the past 4 quarterly comparisons were well above the +25% minimum earnings guideline (C criteria). Since dropped from the Featured Stocks list on 8/25/17 it went through a deep consolidation below its 200 DMA then rebounded impressively. See the latest FSU analysis for more details and a new annotated graph
>>> FEATURED STOCK ARTICLE : Volume-Driven Gain for New All-Time High - 6/1/2018 |
View all notes |
Set NEW NOTE alert |
Company Profile |
SEC
News |
Chart |
Request a new note
C
A
S
I |
NOVT
-
NASDAQ
Novanta Inc
Elec-Scientific/Msrng
|
$65.60
|
+0.75
1.16% |
$66.55
|
239,696
107.01% of 50 DAV
50 DAV is 224,000
|
$66.25
-0.97%
|
4/17/2018
|
$60.55
|
PP = $60.40
|
|
MB = $63.42
|
Most Recent Note - 5/31/2018 4:11:11 PM
G - Color code is changed to green after rising above its "max buy" level with today's 4th consecutive gain on ever-increasing volume. Found support near prior highs in the $58 area and stayed above its 50 DMA line ($58.61) during the recent consolidation.
>>> FEATURED STOCK ARTICLE : Quietly Hovering Near All-Time High - 5/25/2018 |
View all notes |
Set NEW NOTE alert |
Company Profile |
SEC
News |
Chart |
Request a new note
C
A
S
I |
BZUN
-
NASDAQ
Baozun Inc Cl A Ads
Computer Sftwr-Enterprse
|
$61.77
|
+0.46
0.75% |
$63.19
|
2,517,643
94.33% of 50 DAV
50 DAV is 2,669,000
|
$62.06
-0.47%
|
5/15/2018
|
$45.38
|
PP = $52.43
|
|
MB = $55.05
|
Most Recent Note - 5/30/2018 4:05:18 PM
G - Hit yet another new all-time high with today's gain backed by lighter than average volume, getting more extended from the prior base. Prior highs in the $51-53 area define initial support to watch on pullbacks.
>>> FEATURED STOCK ARTICLE : Earnings News Due; Formed a Base-on-Base Pattern - 5/16/2018 |
View all notes |
Set NEW NOTE alert |
Company Profile |
SEC
News |
Chart |
Request a new note
C
A
S
I |
SEDG
-
NASDAQ
Solaredge Technologies
Energy-Solar
|
$54.70
|
-1.15
-2.06% |
$56.74
|
1,839,906
183.08% of 50 DAV
50 DAV is 1,005,000
|
$70.74
-22.67%
|
5/9/2018
|
$55.33
|
PP = $59.30
|
|
MB = $62.27
|
Most Recent Note - 6/1/2018 5:34:52 PM
G - Slumped further below its 50 DMA line ($57.08) with today's 3rd consecutive volume-driven loss triggering a technical sell signal and raising concerns as it dipped intra-day below the prior low ($54.60 on 5/24/18). Only a prompt rebound above the 50 DMA line would help its outlook improve. More damaging losses would raise greater concerns.
>>> FEATURED STOCK ARTICLE : Quickly Rallied Following Strong Earnings News - 5/10/2018 |
View all notes |
Set NEW NOTE alert |
Company Profile |
SEC
News |
Chart |
Request a new note
C
A
S
I |
SEND
-
NYSE
Sendgrid Inc
INTERNET - Content
|
$26.97
|
+0.43
1.62% |
$27.40
|
532,316
118.56% of 50 DAV
50 DAV is 449,000
|
$32.03
-15.79%
|
3/6/2018
|
$28.00
|
PP = $28.37
|
|
MB = $29.79
|
Most Recent Note - 5/30/2018 3:48:15 PM
G - Met resistance in recent weeks, and a convincing rebound above the 50 DMA line ($27.27) is still needed for its outlook to improve. The prior low ($23.77 on 4/04/18) defines the next important support to watch. Completed a new Public Offering and Secondary Offering on 4/05/18.
>>> FEATURED STOCK ARTICLE : Earnings News Continues to be Strong - 5/1/2018 |
View all notes |
Set NEW NOTE alert |
Company Profile |
SEC
News |
Chart |
Request a new note
C
A
S
I |
Symbol/Exchange
Company Name
Industry Group |
PRICE |
CHANGE
(%Change) |
Day High |
Volume
(% DAV)
(% 50 day avg vol) |
52 Wk Hi
% From Hi |
Featured
Date |
Price
Featured |
Pivot Featured |
|
Max Buy |