***Last / Change / Volume data in this table is the closing quote data***
Symbol/Exchange
Company Name
Industry Group |
PRICE |
CHANGE
(%Change) |
Day High |
Volume
(% DAV)
(% 50 day avg vol) |
52 Wk Hi
% From Hi |
Featured
Date |
Price
Featured |
Pivot Featured |
|
Max Buy |
OSBC
-
NASDAQ
Old Second Bancorp Inc
BANKING - Regional - Midwest Banks
|
$15.10
|
-0.25
-1.63% |
$15.31
|
46,795
77.99% of 50 DAV
50 DAV is 60,000
|
$15.55
-2.89%
|
5/21/2018
|
$15.50
|
PP = $15.10
|
|
MB = $15.86
|
Most Recent Note - 5/21/2018 5:01:14 PM
Y - Color code was changed to yellow with pivot point cited based on prior highs plus 10 cents. Hit a new 52-week high with today's big gain backed by +60% above average volume. Found support above its 200 DMA line during its long and orderly consolidation. Reported earnings +69% on +15% sales revenues for the Mar '18 quarter, its 5th consecutive quarterly comparison with earnings above the +25% minimum guideline (C criteria). Annual earnings history has been a good match with the fact-based investment system's guidelines (A criteria). See the latest FSU analysis for more details and a new annotated graph.
>>> FEATURED STOCK ARTICLE : Hit New High Today After Orderly Consolidation - 5/21/2018 |
View all notes |
Set NEW NOTE alert |
Company Profile |
SEC
News |
Chart |
Request a new note
C
A
S
I |
PFBC
-
NASDAQ
Preferred Bank Los Angls
BANKING - Regional - Pacific Banks
|
$65.18
|
-0.08
-0.12% |
$65.56
|
46,268
55.34% of 50 DAV
50 DAV is 83,600
|
$67.65
-3.65%
|
5/18/2018
|
$62.91
|
PP = $67.75
|
|
MB = $71.14
|
Most Recent Note - 5/21/2018 3:53:43 PM
Y - Rising near its 50 DMA line ($64.60) with today's gain backed by below average volume. Gain above the 50 DMA line are needed for its outlook to improve. Its Relative Strength rating has slumped below the 80+ minimum guideline to 66, yet it remains only -4.9% off its high. Despite concerns its color code was changed to yellow with new pivot point cited based on its 1/22/18 high plus 10 cents. Subsequent gains above the pivot point are needed to trigger a technical buy signal. See the latest FSU analysis for more details and an annotated graph.
>>> FEATURED STOCK ARTICLE : Some Technical Sputtering Yet Bank is Still Only -7% Off High - 5/18/2018 |
View all notes |
Set NEW NOTE alert |
Company Profile |
SEC
News |
Chart |
Request a new note
C
A
S
I |
SIVB
-
NASDAQ
S V B Financial Group
BANKING - Regional - Pacific Banks
|
$319.46
|
-2.83
-0.88% |
$322.21
|
330,570
41.74% of 50 DAV
50 DAV is 792,000
|
$327.91
-2.58%
|
3/12/2018
|
$267.79
|
PP = $263.19
|
|
MB = $276.35
|
Most Recent Note - 5/22/2018 5:33:00 PM
G - Still stubbornly holding its ground and quietly edging higher. Very extended from any sound base after a big "breakaway gap" for a new high was noted on 4/27/18. Fundamentals are strong. See the latest FSU analysis for more details and a new annotated graph.
>>> FEATURED STOCK ARTICLE : Wedging Higher Following Big Breakaway Gap - 5/22/2018 |
View all notes |
Set NEW NOTE alert |
Company Profile |
SEC
News |
Chart |
Request a new note
C
A
S
I |
EPAM
-
NYSE
Epam Systems Inc
COMPUTER SOFTWARE and SERVICES - Information Technology Service
|
$122.46
|
-1.36
-1.10% |
$123.79
|
138,294
46.56% of 50 DAV
50 DAV is 297,000
|
$131.75
-7.05%
|
5/9/2018
|
$120.34
|
PP = $125.98
|
|
MB = $132.28
|
Most Recent Note - 5/21/2018 3:35:47 PM
Y - Following a breakout marked by 3 consecutive volume-driven gains it is quietly consolidating near the prior high ($125.88 on 3/13/18). Additional near-term support is defined by prior highs in the $119 area and its 50 DMA line ($117.67).
>>> FEATURED STOCK ARTICLE : Volume-Driven Gain Challenged Prior High Following Earnings - 5/9/2018 |
View all notes |
Set NEW NOTE alert |
Company Profile |
SEC
News |
Chart |
Request a new note
C
A
S
I |
MA
-
NYSE
Mastercard Inc Cl A
DIVERSIFIED SERVICES - Business/Management Services
|
$191.17
|
-0.74
-0.39% |
$191.89
|
2,431,697
62.80% of 50 DAV
50 DAV is 3,872,000
|
$194.72
-1.82%
|
5/2/2018
|
$184.96
|
PP = $183.83
|
|
MB = $193.02
|
Most Recent Note - 5/23/2018 4:30:22 PM
Y - Volume totals have been cooling in recent weeks while stubbornly holding its ground near its "max buy" level and all-time high. Tallied an impressive streak of gains since breaking out on 5/02/18 from a riskier "late stage" base. Prior highs in the $183 area define initial support to watch on pullbacks.
>>> FEATURED STOCK ARTICLE : Gap Up and Volume Driven Gain for New High After Earnings - 5/2/2018 |
View all notes |
Set NEW NOTE alert |
Company Profile |
SEC
News |
Chart |
Request a new note
C
A
S
I |
Symbol/Exchange
Company Name
Industry Group |
PRICE |
CHANGE
(%Change) |
Day High |
Volume
(% DAV)
(% 50 day avg vol) |
52 Wk Hi
% From Hi |
Featured
Date |
Price
Featured |
Pivot Featured |
|
Max Buy |
V
-
NYSE
Visa Inc Cl A
DIVERSIFIED SERVICES - Business/Management Services
|
$131.28
|
-0.61
-0.46% |
$132.10
|
7,445,227
97.57% of 50 DAV
50 DAV is 7,631,000
|
$132.50
-0.92%
|
4/26/2018
|
$126.68
|
PP = $126.98
|
|
MB = $133.33
|
Most Recent Note - 5/23/2018 4:36:24 PM
Y - Stubbornly and quietly holding its ground in a tight range near its all-time high. Reported earnings +29% on +13% sales revenues for the Mar '18 quarter, and 3 of the past 4 quarterly comparisons were above the +25% minimum earnings guideline (C criteria).
>>> FEATURED STOCK ARTICLE : Volume-Driven Gain For New High Triggered Technical Buy Signal - 4/26/2018 |
View all notes |
Set NEW NOTE alert |
Company Profile |
SEC
News |
Chart |
Request a new note
C
A
S
I |
TPL
-
NYSE
Texas Pacific Land Trust
FINANCIAL SERVICES - Diversified Investments
|
$684.20
|
-11.70
-1.68% |
$691.25
|
21,186
111.51% of 50 DAV
50 DAV is 19,000
|
$707.00
-3.22%
|
4/13/2018
|
$547.85
|
PP = $552.10
|
|
MB = $579.71
|
Most Recent Note - 5/21/2018 3:55:03 PM
G - Hitting another new all-time high today, very extended from the prior base. Prior highs in the $569-552 area define initial support to watch along with its 50 DMA line ($560).
>>> FEATURED STOCK ARTICLE : Perched Near Prior High After Showing Resilience - 4/20/2018 |
View all notes |
Set NEW NOTE alert |
Company Profile |
SEC
News |
Chart |
Request a new note
C
A
S
I |
STMP
-
NASDAQ
Stamps.com Inc
INTERNET - Internet Software and Services
|
$248.35
|
+0.85
0.34% |
$249.95
|
143,025
46.59% of 50 DAV
50 DAV is 307,000
|
$252.00
-1.45%
|
5/4/2018
|
$234.15
|
PP = $233.23
|
|
MB = $244.89
|
Most Recent Note - 5/23/2018 4:34:32 PM
G - Stubbornly holding its ground in a tight range with volume totals cooling while perched at its all-time high. Extended from prior highs in the $233 area which define initial support above its 50 DMA line ($220).
>>> FEATURED STOCK ARTICLE : Volume-Driven Gain For New High - 5/4/2018 |
View all notes |
Set NEW NOTE alert |
Company Profile |
SEC
News |
Chart |
Request a new note
C
A
S
I |
CHDN
-
NASDAQ
Churchill Downs Inc
LEISURE - Gaming Activities
|
$306.60
|
-1.75
-0.57% |
$309.54
|
68,911
62.08% of 50 DAV
50 DAV is 111,000
|
$314.60
-2.54%
|
5/14/2018
|
$285.80
|
PP = $285.80
|
|
MB = $300.09
|
 Most Recent Note - 5/25/2018 1:07:48 PM
G - Very extended from the previously noted base, and the prior highs in the $285-279 area define initial support to watch on pullbacks. Volume totals have been cooling while stubbornly holding its ground near its all-time high, indicative that very few sellers have been headed to the ticket window.
>>> FEATURED STOCK ARTICLE : Breakout Followed New Supreme Court Ruling on Sports Betting - 5/14/2018 |
View all notes |
Set NEW NOTE alert |
Company Profile |
SEC
News |
Chart |
Request a new note
C
A
S
I |
HTHT
-
NASDAQ
China Lodging Group Ads
LEISURE - Lodging
|
$42.81
|
-0.41
-0.94% |
$43.52
|
1,532,445
72.70% of 50 DAV
50 DAV is 2,108,000
|
$44.29
-3.34%
|
5/15/2018
|
$138.07
|
PP = $166.29
|
|
MB = $174.60
|
Most Recent Note - 5/23/2018 4:28:57 PM
Y - Stubbornly holding its ground near its "max buy" level after inching higher following a noted streak of 9 consecutive gains with ever increasing volume. Prior highs in the $166-160 area define initial support to watch on pullbacks.
>>> FEATURED STOCK ARTICLE : New Volume-Driven Breakout For All-Time High - 5/15/2018 |
View all notes |
Set NEW NOTE alert |
Company Profile |
SEC
News |
Chart |
Request a new note
C
A
S
I |
Symbol/Exchange
Company Name
Industry Group |
PRICE |
CHANGE
(%Change) |
Day High |
Volume
(% DAV)
(% 50 day avg vol) |
52 Wk Hi
% From Hi |
Featured
Date |
Price
Featured |
Pivot Featured |
|
Max Buy |
NFLX
-
NASDAQ
Netflix Inc
SPECIALTY RETAIL - Music and Video Stores
|
$351.29
|
+2.00
0.57% |
$354.36
|
7,776,755
79.70% of 50 DAV
50 DAV is 9,757,000
|
$354.00
-0.77%
|
5/24/2018
|
$348.85
|
PP = $338.92
|
|
MB = $355.87
|
Most Recent Note - 5/24/2018 5:40:21 PM
Y - Hit a new high with +50% above average volume and closed above the new pivot point cited based on its 4/18/18 high plus 10 cents triggering a technical buy signal. Rallied from an advanced "ascending base" marked by 3 pullbacks of 10-20% since breaking out in January. Found prompt support near its 50 DMA line in recent months. Reported earnings +60% on +40% sales revenues for the Mar '18 quarter, its 7th consecutive strong quarter. The number of top-rated funds owning its shares (I criteria) rose from 1,534 in Mar '17 to 1,808 in Mar '18. Downturn in FY '15 earnings (A criteria) has been followed by very strong growth. See the latest FSU analysis for more details and a new annotated graph.
>>> FEATURED STOCK ARTICLE : Rally From Advanced Ascending Base With Volume +50% - 5/24/2018 |
View all notes |
Set NEW NOTE alert |
Company Profile |
SEC
News |
Chart |
Request a new note
C
A
S
I |
DPZ
-
NYSE
Dominos Pizza Inc
WHOLESALE - Food Wholesale
|
$250.34
|
-1.90
-0.75% |
$254.22
|
281,528
45.85% of 50 DAV
50 DAV is 614,000
|
$255.00
-1.83%
|
5/21/2018
|
$248.13
|
PP = $255.10
|
|
MB = $267.86
|
Most Recent Note - 5/21/2018 3:31:43 PM
Y - Color code is changed to yellow with new pivot point cited based on its 4/26/18 high plus 10 cents after an advanced "3-weeks tight" base. Subsequent volume-driven gains above the pivot point may trigger a new (or add-on) technical buy signal. Its 50 DMA line ($237) and prior highs in the $236 area define important near-term support to watch on pullbacks.
>>> FEATURED STOCK ARTICLE : Earnings News Due From Pizza Firm - 4/23/2018 |
View all notes |
Set NEW NOTE alert |
Company Profile |
SEC
News |
Chart |
Request a new note
C
A
S
I |
FIVE
-
NASDAQ
Five Below Inc
Retail-DiscountandVariety
|
$71.41
|
-1.78
-2.43% |
$73.11
|
866,487
57.88% of 50 DAV
50 DAV is 1,497,000
|
$78.28
-8.78%
|
3/9/2018
|
$68.58
|
PP = $73.65
|
|
MB = $77.33
|
Most Recent Note - 5/21/2018 3:38:56 PM
Y - Volume totals have been below average in recent weeks while consolidating near its 50 DMA line ($72.06) which acted as support after noted distributional pressure. Subsequent damaging losses below the recent low ($69.37 on 5/02/18) may trigger a more worrisome technical sell signal.
>>> FEATURED STOCK ARTICLE : Trading Near 50-Day Average After Falling Into Prior Base - 5/7/2018 |
View all notes |
Set NEW NOTE alert |
Company Profile |
SEC
News |
Chart |
Request a new note
C
A
S
I |
NOW
-
NYSE
Servicenow Inc
Computer Sftwr-Enterprse
|
$176.72
|
+1.20
0.68% |
$177.49
|
1,288,731
66.05% of 50 DAV
50 DAV is 1,951,000
|
$182.59
-3.21%
|
5/8/2018
|
$174.63
|
PP = $176.66
|
|
MB = $185.49
|
Most Recent Note - 5/23/2018 4:38:14 PM
Y - Volume totals have cooled in recent weeks while consolidating above its 50 DMA line ($169.13). Stalled soon after highlighted in yellow with pivot point cited based on its 3/14/18 high plus 10 cents in the 5/08/18 mid-day report. Members are again reminded to follow proper discipline and always watch for strength indicative of fresh institutional buying demand - "Subsequent gains backed by at least +40% above average volume while rising above the pivot point may trigger a technical buy signal."
>>> FEATURED STOCK ARTICLE : High-Ranked Software - Enterprise Firm is Near Pivot Point - 5/8/2018 |
View all notes |
Set NEW NOTE alert |
Company Profile |
SEC
News |
Chart |
Request a new note
C
A
S
I |
NVEE
-
NASDAQ
N V 5 Global Inc
Comml Svcs-Consulting
|
$60.25
|
+0.20
0.33% |
$60.30
|
43,714
53.97% of 50 DAV
50 DAV is 81,000
|
$71.90
-16.20%
|
4/9/2018
|
$58.35
|
PP = $59.05
|
|
MB = $62.00
|
Most Recent Note - 5/23/2018 4:32:30 PM
Y - Found support recently when quietly consolidating near its 50 DMA line and prior highs in the $58-59 area. More damaging losses would raise greater concerns. Fundamentals remain strong.
>>> FEATURED STOCK ARTICLE : Encountered Distributional Pressure After Hitting New High - 5/11/2018 |
View all notes |
Set NEW NOTE alert |
Company Profile |
SEC
News |
Chart |
Request a new note
C
A
S
I |
Symbol/Exchange
Company Name
Industry Group |
PRICE |
CHANGE
(%Change) |
Day High |
Volume
(% DAV)
(% 50 day avg vol) |
52 Wk Hi
% From Hi |
Featured
Date |
Price
Featured |
Pivot Featured |
|
Max Buy |
QLYS
-
NASDAQ
Qualys Inc
Computer Sftwr-Security
|
$74.60
|
-0.50
-0.67% |
$75.50
|
174,984
57.37% of 50 DAV
50 DAV is 305,000
|
$85.00
-12.24%
|
4/17/2018
|
$82.85
|
PP = $79.50
|
|
MB = $83.48
|
Most Recent Note - 5/22/2018 4:03:25 PM
G - Color code is changed to green after again slumping below its 50 DMA line. Prior low ($68.20 on 5/02/18) defines the next important support above its 200 DMA line
>>> FEATURED STOCK ARTICLE : Quickly Rallied More Than 5% Above Prior High - 4/18/2018 |
View all notes |
Set NEW NOTE alert |
Company Profile |
SEC
News |
Chart |
Request a new note
C
A
S
I |
SPLK
-
NASDAQ
Splunk Inc
Computer Sftwr-Database
|
$110.26
|
-6.05
-5.20% |
$117.71
|
5,495,767
335.11% of 50 DAV
50 DAV is 1,640,000
|
$119.00
-7.34%
|
5/8/2018
|
$113.14
|
PP = $112.76
|
|
MB = $118.40
|
Most Recent Note - 5/25/2018 12:53:48 PM
Y - Pulling back today after reporting a loss of 7 cents per share on +37% sales revenues versus a loss of 9 cents per share for the year ago period ended April 30th. Volume and volatility often increase near earnings news. This week it touched a new all-time high but endured distributional pressure. Wedging gains above the stock's pivot point recently were noted when below the +40% above average volume needed to trigger a proper technical buy signal. Prior highs and its 50 DMA line ($106.36) define near term support to watch.
>>> FEATURED STOCK ARTICLE : Found Support Near 50-Day Average on Pullbacks - 4/19/2018 |
View all notes |
Set NEW NOTE alert |
Company Profile |
SEC
News |
Chart |
Request a new note
C
A
S
I |
SUPN
-
NASDAQ
Supernus Pharmaceuticals
Medical-Biomed/Biotech
|
$57.25
|
+1.60
2.88% |
$58.00
|
742,437
97.82% of 50 DAV
50 DAV is 759,000
|
$59.05
-3.05%
|
4/24/2018
|
$47.73
|
PP = $50.15
|
|
MB = $52.66
|
Most Recent Note - 5/21/2018 12:55:19 PM
G - Pulling back from its all-time high with today's 3rd consecutive loss after getting extended from the previously noted base. Prior highs in the $49-50 area define initial support to watch.
>>> FEATURED STOCK ARTICLE : Pharmaceutical Firm Perched Near Record High - 4/24/2018 |
View all notes |
Set NEW NOTE alert |
Company Profile |
SEC
News |
Chart |
Request a new note
C
A
S
I |
PAYC
-
NYSE
Paycom Software Inc
COMPUTER SOFTWARE and SERVICES - Application Software
|
$104.02
|
+0.97
0.94% |
$104.96
|
673,541
89.33% of 50 DAV
50 DAV is 754,000
|
$118.45
-12.18%
|
2/15/2018
|
$95.01
|
PP = $93.61
|
|
MB = $98.29
|
Most Recent Note - 5/21/2018 3:48:47 PM
G - Halted its slide last week after undercutting prior lows in the $101 area, but more damaging losses would raise greater concerns. A rebound above the 50 DMA line ($109.19) is needed for its outlook to improve.
>>> FEATURED STOCK ARTICLE : Violation of 50-Day Average Triggered Technical Sell Signal - 5/3/2018 |
View all notes |
Set NEW NOTE alert |
Company Profile |
SEC
News |
Chart |
Request a new note
C
A
S
I |
GRUB
-
NYSE
Grubhub Inc
COMPUTER SOFTWARE and SERVICES - Technical and System Software
|
$101.78
|
-1.31
-1.27% |
$103.87
|
746,132
51.04% of 50 DAV
50 DAV is 1,462,000
|
$112.41
-9.46%
|
6/21/2017
|
$47.33
|
PP = $46.94
|
|
MB = $49.29
|
Most Recent Note - 5/22/2018 4:09:44 PM
G - Quietly consolidating above its 50 DMA line ($101.98). Faces some resistance due to overhead supply up to the $112 level. Recently reported earnings +79% on +49% sales revenues for the Mar '18 quarter.
>>> FEATURED STOCK ARTICLE : Consolidating Near 50 Day Average With Earnings News Due - 4/30/2018 |
View all notes |
Set NEW NOTE alert |
Company Profile |
SEC
News |
Chart |
Request a new note
C
A
S
I |
Symbol/Exchange
Company Name
Industry Group |
PRICE |
CHANGE
(%Change) |
Day High |
Volume
(% DAV)
(% 50 day avg vol) |
52 Wk Hi
% From Hi |
Featured
Date |
Price
Featured |
Pivot Featured |
|
Max Buy |
HQY
-
NASDAQ
Healthequity Inc
COMPUTER SOFTWARE and SERVICES - Healthcare Information Service
|
$76.94
|
+1.23
1.62% |
$77.19
|
295,415
49.99% of 50 DAV
50 DAV is 591,000
|
$76.76
0.24%
|
5/2/2018
|
$66.31
|
PP = $68.85
|
|
MB = $72.29
|
Most Recent Note - 5/23/2018 4:25:05 PM
G - Volume totals still have been below average while wedging into new all-time high territory with 7 consecutive gains, and its color code is changed to green after rallying above the "max buy" level. Prior high ($68.75 on 3/22/18) and its 50 DMA line ($66.08) define near term support to watch on pullbacks.
>>> FEATURED STOCK ARTICLE : Perched Near All-Time High Building a Short New Base - 4/25/2018 |
View all notes |
Set NEW NOTE alert |
Company Profile |
SEC
News |
Chart |
Request a new note
C
A
S
I |
LOB
-
NASDAQ
Live Oak Bancshares Inc
Banks-Southeast
|
$29.60
|
+0.03
0.10% |
$29.75
|
153,856
133.79% of 50 DAV
50 DAV is 115,000
|
$30.05
-1.50%
|
5/21/2018
|
$29.35
|
PP = $30.15
|
|
MB = $31.66
|
Most Recent Note - 5/23/2018 5:54:40 PM
Y - Perched within close striking distance of the new pivot point cited based on its 3/21/18 high plus 10 cents. Subsequent volume-driven gains for a new high may trigger a technical buy signal. Prior lows in the $26-27 area define important near term support. Recently reported earnings +63% on +42% for the Mar '18 quarter. See the latest FSU analysis for more details and a new annotated graph.
>>> FEATURED STOCK ARTICLE : Bank Perched Near High After Orderly Base - 5/23/2018 |
View all notes |
Set NEW NOTE alert |
Company Profile |
SEC
News |
Chart |
Request a new note
C
A
S
I |
PYPL
-
NASDAQ
Paypal Holdings Inc
Finance-CrdtCard/PmtPr
|
$80.96
|
-0.59
-0.72% |
$82.72
|
9,381,581
109.91% of 50 DAV
50 DAV is 8,536,000
|
$86.32
-6.21%
|
5/18/2018
|
$81.63
|
PP = $80.89
|
|
MB = $84.93
|
Most Recent Note - 5/25/2018 1:14:07 PM
Y - This week it rose above the pivot point cited based on its 4/18/18 high after forming a "double bottom" base, however gains were lacking the +40% above average volume necessary to clinch a convincing technical buy signal. Confirming volume-driven gains would be a reassuring sign of fresh institutional buying demand. The 50 DMA line ($77.45) defines near-term support above its 200 DMA line and prior lows in the $71-72 area. Fundamentals remain strong.
>>> FEATURED STOCK ARTICLE : Slumping Near Important Near-Term Support - 4/27/2018 |
View all notes |
Set NEW NOTE alert |
Company Profile |
SEC
News |
Chart |
Request a new note
C
A
S
I |
OLLI
-
NASDAQ
Ollie's Bargain Outlet
Retail-DiscountandVariety
|
$70.35
|
+0.35
0.50% |
$70.40
|
343,032
49.86% of 50 DAV
50 DAV is 688,000
|
$71.45
-1.54%
|
4/10/2018
|
$62.05
|
PP = $62.15
|
|
MB = $65.26
|
Most Recent Note - 5/21/2018 3:46:02 PM
G - Perched at its all-time high and on track today for a 10th consecutive gain, very extended from any sound base. Prior high in the $64 area defines initial support along with its 50 DMA line ($62.15).
>>> FEATURED STOCK ARTICLE : Extended From Prior Base After 8 Consecutive Gains - 5/17/2018 |
View all notes |
Set NEW NOTE alert |
Company Profile |
SEC
News |
Chart |
Request a new note
C
A
S
I |
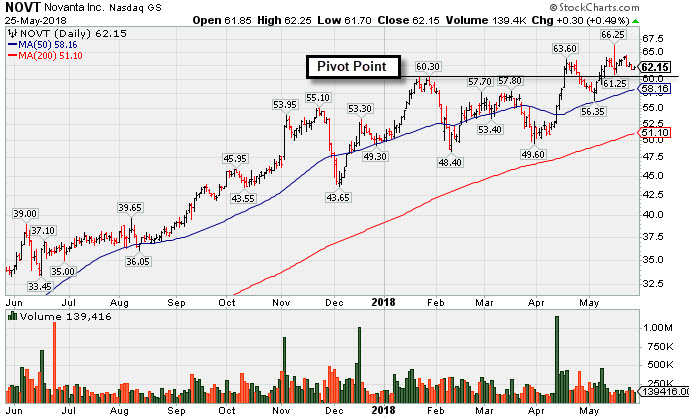
NOVT
-
NASDAQ
Novanta Inc
Elec-Scientific/Msrng
|
$62.15
|
+0.30
0.49% |
$62.25
|
139,086
63.80% of 50 DAV
50 DAV is 218,000
|
$66.25
-6.18%
|
4/17/2018
|
$60.55
|
PP = $60.40
|
|
MB = $63.42
|
Most Recent Note - 5/25/2018 6:11:29 PM
Y - Sputtering after a noted "negative reversal" on 5/15/18 at its 52-week high. Found support near prior highs in the $58 area and stayed above its 50 DMA line ($58.16) during the recent consolidation. See the latest FSU analysis for more details and a new annotated graph.
>>> FEATURED STOCK ARTICLE : Quietly Hovering Near All-Time High - 5/25/2018 |
View all notes |
Set NEW NOTE alert |
Company Profile |
SEC
News |
Chart |
Request a new note
C
A
S
I |
Symbol/Exchange
Company Name
Industry Group |
PRICE |
CHANGE
(%Change) |
Day High |
Volume
(% DAV)
(% 50 day avg vol) |
52 Wk Hi
% From Hi |
Featured
Date |
Price
Featured |
Pivot Featured |
|
Max Buy |
BZUN
-
NASDAQ
Baozun Inc Cl A Ads
Computer Sftwr-Enterprse
|
$58.05
|
-0.45
-0.77% |
$59.80
|
2,576,921
94.88% of 50 DAV
50 DAV is 2,716,000
|
$59.28
-2.07%
|
5/15/2018
|
$45.38
|
PP = $52.43
|
|
MB = $55.05
|
Most Recent Note - 5/24/2018 12:20:35 PM
G - Hitting yet another new all-time high with today's volume-driven gain following through on prior bullish action. Color code was changed to green after rallying above the "max buy" level. Reported earnings +29% on +25% sales revenues for the Mar '18 quarter. Featured in the 5/15/18 mid-day report (read here) and then more detailed analysis with an annotated graph on 5/16/18 in the FSU section of the evening report.
>>> FEATURED STOCK ARTICLE : Earnings News Due; Formed a Base-on-Base Pattern - 5/16/2018 |
View all notes |
Set NEW NOTE alert |
Company Profile |
SEC
News |
Chart |
Request a new note
C
A
S
I |
SEDG
-
NASDAQ
Solaredge Technologies
Energy-Solar
|
$58.95
|
+2.50
4.43% |
$60.10
|
2,326,297
253.13% of 50 DAV
50 DAV is 919,000
|
$70.74
-16.66%
|
5/9/2018
|
$55.33
|
PP = $59.30
|
|
MB = $62.27
|
Most Recent Note - 5/25/2018 1:16:34 PM
Y - Finding prompt support today after briefly undercutting prior highs and its 50 DMA line ($56.95) with 2 consecutive big volume-driven losses. More damaging losses would trigger a worrisome technical sell signal.
>>> FEATURED STOCK ARTICLE : Quickly Rallied Following Strong Earnings News - 5/10/2018 |
View all notes |
Set NEW NOTE alert |
Company Profile |
SEC
News |
Chart |
Request a new note
C
A
S
I |
SEND
-
NYSE
Sendgrid Inc
INTERNET - Content
|
$26.10
|
-0.24
-0.91% |
$26.49
|
320,083
71.45% of 50 DAV
50 DAV is 448,000
|
$32.03
-18.50%
|
3/6/2018
|
$28.00
|
PP = $28.37
|
|
MB = $29.79
|
Most Recent Note - 5/21/2018 3:50:28 PM
G - After trading higher today it again met resistance, whereas a convincing rebound above the 50 DMA line ($27.77) is needed for its outlook to improve. The prior low ($23.77 on 4/04/18) defines the next important support to watch. Completed a new Public Offering and Secondary Offering on 4/05/18.
>>> FEATURED STOCK ARTICLE : Earnings News Continues to be Strong - 5/1/2018 |
View all notes |
Set NEW NOTE alert |
Company Profile |
SEC
News |
Chart |
Request a new note
C
A
S
I |