You are not logged in.
This means you
CAN ONLY VIEW reports that were published prior to Thursday, March 20, 2025.
You
MUST UPGRADE YOUR MEMBERSHIP if you want to see any current reports.
AFTER MARKET UPDATE - THURSDAY, AUGUST 24TH, 2017
Previous After Market Report Next After Market Report >>>
|
|
|
|
DOW |
-28.69 |
21,783.40 |
-0.13% |
|
Volume |
718,829,780 |
+5% |
|
Volume |
1,604,811,810 |
+5% |
|
NASDAQ |
-7.08 |
6,271.33 |
-0.11% |
|
Advancers |
1,450 |
51% |
|
Advancers |
1,604 |
56% |
|
S&P 500 |
-5.07 |
2,438.97 |
-0.21% |
|
Decliners |
1,409 |
49% |
|
Decliners |
1,252 |
44% |
|
Russell 2000 |
+4.14 |
1,373.88 |
+0.30% |
|
52 Wk Highs |
96 |
|
|
52 Wk Highs |
61 |
|
|
S&P 600 |
+1.12 |
823.97 |
+0.14% |
|
52 Wk Lows |
33 |
|
|
52 Wk Lows |
41 |
|
|
 |
Indices Ended Lower With Higher Volume
Kenneth J. Gruneisen - Passed the CAN SLIM® Master's Exam
Stocks closed mildly lower on Thursday. The Dow was down 28 points to 21783. The S&P 500 lost 5 points to 2438 and the Nasdaq Composite was off 7 points to 6271. Volume totals reported were higher than the prior session total on the NYSE and on the Nasdaq exchange. Breadth was slightly positive as advancers led decliners by a 4-3 margin on the Nasdaq exchange while the mix was nearly even on the NYSE. There were 28 high-ranked companies from the Leaders List that made new 52-week highs and were listed on the BreakOuts Page, versus the total of 35 on the prior session. New 52-week highs outnumbered shrinking new 52-week lows totals on both the NYSE and the Nasdaq exchange. The Featured Stocks Page provides the latest analysis on noteworthy high-ranked leaders. Charts used courtesy of www.stockcharts.com
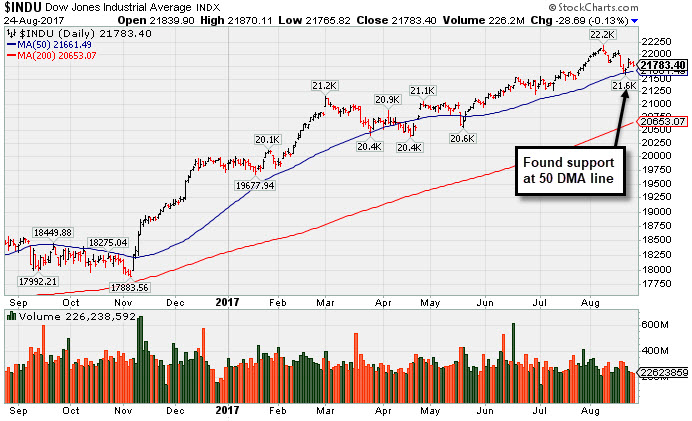 PICTURED: The Dow Jones Industrial Average recently found support at its 50-day moving average (DMA) line. Recent lows define the important support to watch. The major averages' (M criteria) prior uptrend has been under pressure while leadership has been thinning. Investors should be ready to raise cash and reduce exposure to stocks by selling individual issues on a case-by-case basis as they trigger technical sell signals.
The major averages fluctuated amid economic and earnings news and fresh investor concern regarding the debt ceiling. Monetary policy was also on the forefront of investors’ minds as leaders of global central banks began their annual Jackson Hole symposium in Wyoming. On the data front, initial jobless claims came in at 234,000, below expectations of 238,000. Separately, existing home sales unexpectedly dipped 1.3% in July to the lowest level in 11 months.
10 of 11 sectors in the S&P 500 Index finished in negative territory. Consumer Staples names lagged with Hormel Foods (HRL -5.40%) fell while J.M. Smucker (SJM -9.5%) fell after each company posted lackluster earnings results and lowered forward guidance. Kroger (KR -8.10%) fell following news Amazon (AMZN -0.58%) plans to lower prices at Whole Foods (WFM +0.72%), since its 6/16/17 announced plan to acquire. Conversely, Discretionary names outperformed with Dollar Tree (DLTR +5.62%) as earnings and full-year guidance topped analyst projections.
Treasuries moved lower with the benchmark 10-year note off 7/32 to yield 2.19%. In commodities, NYMEX WTI crude was off 1.7% at $47.60/barrel. COMEX gold lost 0.2% to $1286.50/ounce while the U.S. Dollar index gained 0.2%. |
 Kenneth J. Gruneisen started out as a licensed stockbroker in August 1987, a couple of months prior to the historic stock market crash that took the Dow Jones Industrial Average down -22.6% in a single day. He has published daily fact-based fundamental and technical analysis on high-ranked stocks online for two decades. Through FACTBASEDINVESTING.COM, Kenneth provides educational articles, news, market commentary, and other information regarding proven investment systems that work in good times and bad.
Comments contained in the body of this report are technical opinions only and are not necessarily those of Gruneisen Growth Corp. The material herein has been obtained from sources believed to be reliable and accurate, however, its accuracy and completeness cannot be guaranteed. Our firm, employees, and customers may effect transactions, including transactions contrary to any recommendation herein, or have positions in the securities mentioned herein or options with respect thereto. Any recommendation contained in this report may not be suitable for all investors and it is not to be deemed an offer or solicitation on our part with respect to the purchase or sale of any securities. |
|
 |
Biotech, Networking and Bank Indexes Rose
Kenneth J. Gruneisen - Passed the CAN SLIM® Master's Exam
On Thursday the Bank Index ($BKX +0.29%) edged higher but the Broker/Dealer Index ($XBD -0.12%) finished slightly lower and the Retail Index ($RLX -0.36%) also created a drag on the major indices. The tech sector was led by the Biotechnology Index ($BTK +1.36%) while the Networking Index ($NWX +0.30%) eked out a smaller gain but the Semiconductor Index ($SOX 0.04%) finished flat. Commodity-linked groups were mixed as the Gold & Silver Index ($XAU +0.56%) and Integrated Oil Index ($XOI +0.36%) posted modest gains but the Oil Services Index ($OSX -0.42%) fell. Charts courtesy www.stockcharts.com
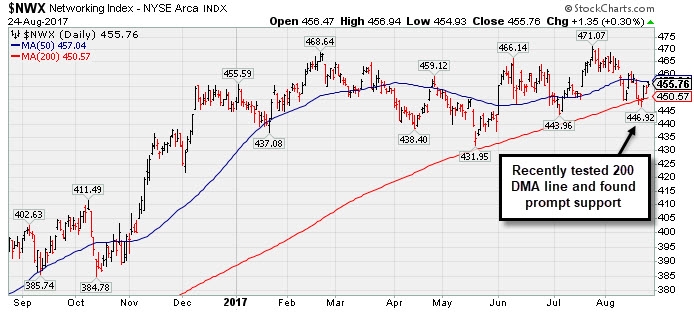 PICTURED: The Networking Index ($NWX +0.30%) recently and bounced at its 200-day moving average (DMA) line. More damaging losses would raise greater concerns.
| Oil Services |
$OSX |
119.76 |
-0.51 |
-0.42% |
-34.84% |
| Integrated Oil |
$XOI |
1,099.50 |
+3.90 |
+0.36% |
-13.29% |
| Semiconductor |
$SOX |
1,085.93 |
-0.48 |
-0.04% |
+19.80% |
| Networking |
$NWX |
455.76 |
+1.35 |
+0.30% |
+2.17% |
| Broker/Dealer |
$XBD |
226.45 |
-0.27 |
-0.12% |
+10.31% |
| Retail |
$RLX |
1,447.82 |
-5.28 |
-0.36% |
+7.81% |
| Gold & Silver |
$XAU |
86.13 |
+0.49 |
+0.57% |
+9.22% |
| Bank |
$BKX |
94.15 |
+0.27 |
+0.29% |
+2.57% |
| Biotech |
$BTK |
3,909.07 |
+52.45 |
+1.36% |
+27.12% |
|
|
|
 |
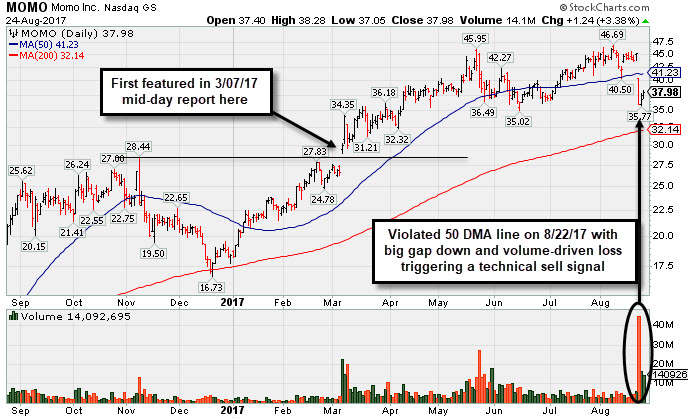
Gap Down Violation of 50-Day Average Triggered Technical Sell Signal
Kenneth J. Gruneisen - Passed the CAN SLIM® Master's Exam
Momo Inc Ads (MOMO +$1.24 or +3.38% to $37.98) posted a second consecutive small gain with above average volume. On 8/22/17 it violated its 50-day moving average (DMA) line triggering a technical sell signal with a damaging volume-driven loss and its color code was changed to green. It halted its slide near prior low ($35.02 on 6/15/17), however, more damaging losses would raise serious concerns and trigger a more worrisome technical sell signal. Only a prompt rebound above the 50 DMA line would help its outlook improve.
Recent weakness came after it reported earnings +192% on +215% sales revenues for the Jun '17 quarter versus the year ago period. Members were reminded - "Volume and volatility often increase near earnings news." MOMO was last shown in this FSU section on 7/25/17 with an annotated graph under the headline, "Perched Within Striking Distance of Prior High". It traded up as much as +57.15% since first highlighted in yellow in the 3/07/17 mid-day report (read here) with pivot point cited based on its 2/21/17 high after a cup-with-handle base.
Limited history remains of some concern for this Chinese Internet - Content firm that completed its $14 IPO in Dec '14. The number of top-rated funds owning its shares rose from 46 in Jun '16 to 259 in Jun '17, a reassuring sign concerning the I criteria. However, its current Up/Down Volume Ratio of 0.9 is an unbiased indication its shares have been under distributional pressure over the past 50 days. It has a small supply (S criteria) of only 43.4 million shares in the public float which can tribute to greater volatility in the event of institutional buying or selling.
|
|
|
Color Codes Explained :
Y - Better candidates highlighted by our
staff of experts.
G - Previously featured
in past reports as yellow but may no longer be buyable under the
guidelines.
***Last / Change / Volume data in this table is the closing quote data***
Symbol/Exchange
Company Name
Industry Group |
PRICE |
CHANGE
(%Change) |
Day High |
Volume
(% DAV)
(% 50 day avg vol) |
52 Wk Hi
% From Hi |
Featured
Date |
Price
Featured |
Pivot Featured |
|
Max Buy |
THO
-
NYSE
Thor Industries Inc
AUTOMOTIVE - Recreational Vehicles
|
$103.44
|
-0.24
-0.23% |
$104.62
|
189,185
38.30% of 50 DAV
50 DAV is 493,900
|
$115.74
-10.63%
|
8/14/2017
|
$106.67
|
PP = $110.01
|
|
MB = $115.51
|
Most Recent Note - 8/21/2017 5:55:27 PM
G - Still sputtering below its 50 DMA line ($105). A rebound above the 50 DMA line is needed for its outlook improve. Subsequent volume-driven gains above the pivot point may trigger a new (or add-on) technical buy signal. See the latest FSU analysis for more details and a new annotated graph.
>>> FEATURED STOCK ARTICLE : Slump Below 50-Day Average Hurt Technical Stance - 8/21/2017 |
View all notes |
Set NEW NOTE alert |
Company Profile |
SEC
News |
Chart |
Request a new note
C
A
S
I |
BERY
-
NYSE
Berry Global Group Inc
CONSUMER NON-DURABLES - Packaging and Containers
|
$56.64
|
-0.47
-0.82% |
$57.42
|
388,596
45.24% of 50 DAV
50 DAV is 859,000
|
$58.95
-3.92%
|
7/14/2017
|
$57.67
|
PP = $59.05
|
|
MB = $62.00
|
Most Recent Note - 8/21/2017 6:02:19 PM
G - Slumped below its 50 DMA line ($57.45) with today's loss on lighter volume. The recent low defines important near-term support ($55.60 on 8/03/17). Reported Jun '17 quarterly earnings +13% on +16% sales revenues, below the +25% minimum earnings guideline (C criteria), raising fundamental concerns.
>>> FEATURED STOCK ARTICLE : Fundamental Concerns Yet Rebound Helped Technical Stance - 8/14/2017 |
View all notes |
Set NEW NOTE alert |
Company Profile |
SEC
News |
Chart |
Request a new note
C
A
S
I |
HSKA
-
NASDAQ
Heska Corporation
DRUGS - Biotechnology
|
$99.02
|
-1.36
-1.35% |
$101.54
|
61,991
95.37% of 50 DAV
50 DAV is 65,000
|
$115.00
-13.90%
|
7/31/2017
|
$114.27
|
PP = $110.35
|
|
MB = $115.87
|
Most Recent Note - 8/21/2017 6:07:50 PM
G - Rebounded near its 50 DMA line ($99.91) with today's gain on higher (near average) volume. Encountered distributional pressure since highlighted in yellow in the 7/31/17 mid-day report with pivot point cited based on its high hit on 5/01/17 plus 10 cents. Failed to produce confirming gains since repeatedly noted - "Subsequent gains and a strong finish above its pivot point may clinch a convincing technical buy signal. Small supply of only 6 million shares in the public float (S criteria) can contribute to greater price volatility in the event of institutional buying or selling."
>>> FEATURED STOCK ARTICLE : Small Supply of Shares and Closed In Lower Half of Intra-day Range - 7/31/2017 |
View all notes |
Set NEW NOTE alert |
Company Profile |
SEC
News |
Chart |
Request a new note
C
A
S
I |
AVGO
-
NASDAQ
Broadcom Limited
ELECTRONICS - Semiconductor - Broad Line
|
$255.05
|
-1.87
-0.73% |
$259.36
|
5,067,344
213.81% of 50 DAV
50 DAV is 2,370,000
|
$258.91
-1.49%
|
8/24/2017
|
$252.44
|
PP = $256.89
|
|
MB = $269.73
|
 Most Recent Note - 8/24/2017 12:17:46 PM
Y - Color code is changed to yellow with pivot point cited based on its 6/05/17 high plus 10 cents. Subsequent volume-driven gains above the pivot and for new highs may trigger a technical buy signal. Due to report July '17 quarterly results. Volume and volatility often increase near earnings news. Reported Apr '17 earnings +46% on +18% sales revenues. Meeting resistance recently in the $256-258 area and pulling back from its all-time high, slumping toward its 50 DMA line where it recently found prompt support. Prior quarterly and annual earnings history (C and A criteria) is a good match with the fact-based investment system's fundamental guidelines.
>>> FEATURED STOCK ARTICLE : Volume Totals Cooling During Consolidation After Breakout - 6/18/2015 |
View all notes |
Set NEW NOTE alert |
Company Profile |
SEC
News |
Chart |
Request a new note
C
A
S
I |
EW
-
NYSE
Edwards Lifesciences Cp
HEALTH SERVICES - Medical Appliances and Equipment
|
$112.75
|
+0.04
0.04% |
$113.46
|
1,265,534
104.68% of 50 DAV
50 DAV is 1,208,900
|
$121.75
-7.39%
|
7/11/2017
|
$117.23
|
PP = $121.85
|
|
MB = $127.94
|
Most Recent Note - 8/23/2017 1:04:26 PM
G - Sputtering yet still perched only -7.2% off its 52-week and all-time high. Relative Strength Rating has slumped to 77, below the 80+ minimum guideline for buy candidates. A rebound above its 50 DMA line ($116.53) is needed for its outlook to improve. Fundamentals remain strong.
>>> FEATURED STOCK ARTICLE : Near 50-Day Moving Average Line, Yet Not Far Off High - 8/7/2017 |
View all notes |
Set NEW NOTE alert |
Company Profile |
SEC
News |
Chart |
Request a new note
C
A
S
I |
Symbol/Exchange
Company Name
Industry Group |
PRICE |
CHANGE
(%Change) |
Day High |
Volume
(% DAV)
(% 50 day avg vol) |
52 Wk Hi
% From Hi |
Featured
Date |
Price
Featured |
Pivot Featured |
|
Max Buy |
STMP
-
NASDAQ
Stamps.com Inc
INTERNET - Internet Software and Services
|
$194.90
|
-11.35
-5.50% |
$207.18
|
782,758
165.49% of 50 DAV
50 DAV is 473,000
|
$220.25
-11.51%
|
5/24/2017
|
$133.10
|
PP = $136.10
|
|
MB = $142.91
|
Most Recent Note - 8/24/2017 6:27:39 PM
G - Slumped with higher volume today while retreating from its all-time high. It is very extended from any sound base. Its 50 DMA line ($167) and prior highs define important near-term support in the $156 area. Fundamentals remain strong.
>>> FEATURED STOCK ARTICLE : Blasted Higher After Latest Strong Earnings Report - 8/11/2017 |
View all notes |
Set NEW NOTE alert |
Company Profile |
SEC
News |
Chart |
Request a new note
C
A
S
I |
HTHT
-
NASDAQ
China Lodging Group Ads
LEISURE - Lodging
|
$112.10
|
-1.70
-1.49% |
$115.60
|
276,788
92.57% of 50 DAV
50 DAV is 299,000
|
$118.00
-5.00%
|
9/29/2016
|
$46.12
|
PP = $47.82
|
|
MB = $50.21
|
Most Recent Note - 8/23/2017 1:07:51 PM
G - Perched at its all-time high following volume-driven gains, very extended from any sound base. Last week it reported earnings +19% on +18% sales revenues for the Jun '17 quarter, below the +25% minimum earnings guideline (C criteria). Its 50 DMA line ($91.34) defines support above prior highs in the $88 area.
>>> FEATURED STOCK ARTICLE : Extended From Sound Base With Earnings News Due Next Week - 8/9/2017 |
View all notes |
Set NEW NOTE alert |
Company Profile |
SEC
News |
Chart |
Request a new note
C
A
S
I |
LMAT
-
NASDAQ
Lemaitre Vascular Inc
Medical-Products
|
$34.21
|
+0.24
0.71% |
$34.32
|
168,950
84.48% of 50 DAV
50 DAV is 200,000
|
$36.09
-5.21%
|
7/28/2017
|
$33.50
|
PP = $33.32
|
|
MB = $34.99
|
Most Recent Note - 8/21/2017 6:10:25 PM
Y - Volume totals have been cooling since its breakout while stubbornly holding its ground above prior highs in the $32-33 area previously noted as initial support to watch. Disciplined investors avoid chasing extended stocks more than +5% above prior highs, and they always limit losses by selling any stock that falls more than -7% from their purchase price.
>>> FEATURED STOCK ARTICLE : Big Volume-Driven Gain Following Strong Earnings News - 7/28/2017 |
View all notes |
Set NEW NOTE alert |
Company Profile |
SEC
News |
Chart |
Request a new note
C
A
S
I |
BEAT
-
NASDAQ
BioTelemetry Inc
Medical-Services
|
$35.80
|
-0.75
-2.05% |
$36.80
|
296,727
68.66% of 50 DAV
50 DAV is 432,200
|
$37.50
-4.53%
|
2/14/2017
|
$25.10
|
PP = $24.55
|
|
MB = $25.78
|
Most Recent Note - 8/17/2017 5:53:05 PM
G - Retreating from its all-time high. Fundamental concerns remain. Jun '17 quarterly earnings rose +10% on +10% sales revenues, its 2nd consecutive quarterly comparison below the +25% minimum earnings guideline (C criteria). Its 50 DMA line ($32.88) defines near-term support along with prior lows. See the latest FSU analysis for more details and a new annotated graph.
>>> FEATURED STOCK ARTICLE : Technically Strong Despite Recent Fundamental Concerns - 8/17/2017 |
View all notes |
Set NEW NOTE alert |
Company Profile |
SEC
News |
Chart |
Request a new note
C
A
S
I |
ESNT
-
NYSE
Essent Group Ltd
Finance-MrtgandRel Svc
|
$39.21
|
-0.49
-1.23% |
$40.02
|
473,560
79.59% of 50 DAV
50 DAV is 595,000
|
$41.44
-5.38%
|
7/3/2017
|
$38.05
|
PP = $39.60
|
|
MB = $41.58
|
Most Recent Note - 8/23/2017 1:01:58 PM
Y - Today's volume-driven gain has it nearly challenging its prior high. Completed a new Public Offering on 8/08/17. Recently found prompt support near its 50 DMA line ($38). Its 200 DMA line and prior lows define the next important support in the $34-35 area.
>>> FEATURED STOCK ARTICLE : Perched Within Close Striking Distance of a New High - 8/1/2017 |
View all notes |
Set NEW NOTE alert |
Company Profile |
SEC
News |
Chart |
Request a new note
C
A
S
I |
Symbol/Exchange
Company Name
Industry Group |
PRICE |
CHANGE
(%Change) |
Day High |
Volume
(% DAV)
(% 50 day avg vol) |
52 Wk Hi
% From Hi |
Featured
Date |
Price
Featured |
Pivot Featured |
|
Max Buy |
VEEV
-
NYSE
Veeva Systems Inc Cl A
Computer Sftwr-Medical
|
$64.59
|
+0.21
0.33% |
$65.30
|
1,876,623
159.31% of 50 DAV
50 DAV is 1,178,000
|
$68.07
-5.11%
|
7/24/2017
|
$65.91
|
PP = $68.17
|
|
MB = $71.58
|
Most Recent Note - 8/22/2017 6:16:57 PM
Y - Rose from near its 50 DMA line ($62.59) with higher volume behind today's gain challenging its prior highs. Very little resistance remains due to overhead supply up through the $68 level. Volume-driven gains above prior highs are still needed to trigger a new (or add-on) technical buy signal. Due to report Jul '17 earnings after market close on Thursday, August 24, 2017. Volume and volatility often increase near earnings news.
>>> FEATURED STOCK ARTICLE : Slump Below 50-Day Moving Average Line Raises Concerns - 8/2/2017 |
View all notes |
Set NEW NOTE alert |
Company Profile |
SEC
News |
Chart |
Request a new note
C
A
S
I |
ANET
-
NYSE
Arista Networks Inc
TELECOMMUNICATIONS - Communication Equipment
|
$175.11
|
+1.60
0.92% |
$176.38
|
633,145
73.45% of 50 DAV
50 DAV is 862,000
|
$176.50
-0.79%
|
8/4/2017
|
$173.31
|
PP = $163.07
|
|
MB = $171.22
|
Most Recent Note - 8/23/2017 6:26:58 PM
G - Recently wedged above its "max buy" level with small gains lacking great volume conviction and its color code was changed to green. Prior highs in the $162 area define initial support to watch above its 50 DMA line ($158). Fundamentals remain strong. See the latest FSU analysis for more details and a new annotated graph.
>>> FEATURED STOCK ARTICLE : Gapped Up After Earnings Repairing 50-Day Moving Average Violation - 8/23/2017 |
View all notes |
Set NEW NOTE alert |
Company Profile |
SEC
News |
Chart |
Request a new note
C
A
S
I |
GRUB
-
NYSE
Grubhub Inc
COMPUTER SOFTWARE and SERVICES - Technical and System Software
|
$54.53
|
-0.05
-0.09% |
$55.69
|
1,145,672
57.06% of 50 DAV
50 DAV is 2,008,000
|
$57.26
-4.77%
|
6/21/2017
|
$47.33
|
PP = $46.94
|
|
MB = $49.29
|
Most Recent Note - 8/17/2017 5:57:22 PM
G - Pulling back from its all-time high after getting very extended from any sound base. Prior highs and its 50 DMA line define near-term support in the $47-48 area. Recently reported earnings +13% on +32% sales revenues for the Jun '17 quarter, below the +25% minimum earnings guideline (C criteria) raising fundamental concerns.
>>> FEATURED STOCK ARTICLE : Spiked Into New High Territory Despite Sub Par Earnings News - 8/8/2017 |
View all notes |
Set NEW NOTE alert |
Company Profile |
SEC
News |
Chart |
Request a new note
C
A
S
I |
IBP
-
NYSE
Installed Building Prod
DIVERSIFIED SERVICES - Business/Management Services
|
$54.85
|
-0.50
-0.90% |
$55.67
|
76,525
62.22% of 50 DAV
50 DAV is 123,000
|
$60.00
-8.58%
|
6/13/2017
|
$54.25
|
PP = $55.55
|
|
MB = $58.33
|
Most Recent Note - 8/23/2017 6:29:00 PM
Y - Pulled back today with lighter volume, consolidating near prior highs in the $55 area defining initial support above its 50 DMA line ($54.17).
>>> FEATURED STOCK ARTICLE : Consolidating Near Prior High Following Breakout - 8/18/2017 |
View all notes |
Set NEW NOTE alert |
Company Profile |
SEC
News |
Chart |
Request a new note
C
A
S
I |
NCOM
-
NASDAQ
National Commerce Corp
BANKING - Regional - Southeast Banks
|
$40.10
|
+0.55
1.39% |
$40.40
|
35,728
119.09% of 50 DAV
50 DAV is 30,000
|
$41.25
-2.79%
|
4/25/2017
|
$38.95
|
PP = $40.09
|
|
MB = $42.09
|
Most Recent Note - 8/17/2017 12:11:58 PM
G - Slumped further below its 50 DMA line ($39.60) and its color code was changed to green. Early weakness undercut the recent low ($38.75 on 7/20/17) raising concerns and triggering a more worrisome technical sell signal. Reported Jun '17 earnings +23% on +45% sales revenues, below the +25% minimum earnings guideline (C criteria), raising fundamental concerns. See the latest FSU analysis for more details and an annotated graph.
>>> FEATURED STOCK ARTICLE : Consolidating Near 50-day Moving Average Line - 8/16/2017 |
View all notes |
Set NEW NOTE alert |
Company Profile |
SEC
News |
Chart |
Request a new note
C
A
S
I |
Symbol/Exchange
Company Name
Industry Group |
PRICE |
CHANGE
(%Change) |
Day High |
Volume
(% DAV)
(% 50 day avg vol) |
52 Wk Hi
% From Hi |
Featured
Date |
Price
Featured |
Pivot Featured |
|
Max Buy |
OLLI
-
NASDAQ
Ollie's Bargain Outlet
Retail-DiscountandVariety
|
$43.55
|
-0.50
-1.14% |
$45.20
|
587,271
88.05% of 50 DAV
50 DAV is 667,000
|
$46.08
-5.48%
|
7/17/2017
|
$43.96
|
PP = $44.18
|
|
MB = $46.39
|
Most Recent Note - 8/18/2017 5:37:21 PM
Y - Consolidating above support at its 50 DMA line ($42.91). Confirming gains and a strong close above the pivot point backed by at least +40% above average volume may trigger a new (or add-on) technical buy signal.
>>> FEATURED STOCK ARTICLE : Quietly Consolidating Above 50 Day Moving Average Near High - 8/10/2017 |
View all notes |
Set NEW NOTE alert |
Company Profile |
SEC
News |
Chart |
Request a new note
C
A
S
I |
MOMO
-
NASDAQ
Momo Inc Ads Cl A
INTERNET - Content
|
$37.98
|
+1.24
3.38% |
$38.28
|
14,080,498
267.08% of 50 DAV
50 DAV is 5,272,000
|
$46.69
-18.65%
|
7/25/2017
|
$44.05
|
PP = $46.05
|
|
MB = $48.35
|
Most Recent Note - 8/24/2017 6:26:15 PM
G - Posted a a 2nd small gain with above average volume today. On 8/22/17 it violated its 50 DMA line triggering a technical sell signal with a damaging volume-driven loss and its color code was changed to green. Only a prompt rebound above the 50 DMA line would help its outlook improve. Reported earnings +192% on +215% sales revenues for the Jun '17 quarter versus the year ago period. Volume and volatility often increase near earnings news. See the latest FSU analysis for additional details and an annotated graph.
>>> FEATURED STOCK ARTICLE : Gap Down Violation of 50-Day Average Triggered Technical Sell Signal - 8/24/2017 |
View all notes |
Set NEW NOTE alert |
Company Profile |
SEC
News |
Chart |
Request a new note
C
A
S
I |
HLI
-
NYSE
Houlihan Lokey Inc Cl A
Finance-Invest Bnk/Bkrs
|
$35.99
|
+0.30
0.84% |
$36.12
|
144,668
81.27% of 50 DAV
50 DAV is 178,000
|
$39.68
-9.30%
|
5/10/2017
|
$35.85
|
PP = $35.05
|
|
MB = $36.80
|
Most Recent Note - 8/21/2017 6:06:27 PM
Y - Managed a positive reversal on the prior session, finding support while consolidating near its 50 DMA line ($35.84). Damaging losses below the recent low ($34.41 on 8/18/17) would raise serious concerns and trigger a technical sell signal.
>>> FEATURED STOCK ARTICLE : Extended Leader Encounters Distributional Pressure - 7/27/2017 |
View all notes |
Set NEW NOTE alert |
Company Profile |
SEC
News |
Chart |
Request a new note
C
A
S
I |
|
|
|
THESE ARE NOT BUY RECOMMENDATIONS!
Comments contained in the body of this report are technical
opinions only. The material herein has been obtained
from sources believed to be reliable and accurate, however,
its accuracy and completeness cannot be guaranteed.
This site is not an investment advisor, hence it does
not endorse or recommend any securities or other investments.
Any recommendation contained in this report may not
be suitable for all investors and it is not to be deemed
an offer or solicitation on our part with respect to
the purchase or sale of any securities. All trademarks,
service marks and trade names appearing in this report
are the property of their respective owners, and are
likewise used for identification purposes only.
This report is a service available
only to active Paid Premium Members.
You may opt-out of receiving report notifications
at any time. Questions or comments may be submitted
by writing to Premium Membership Services 665 S.E. 10 Street, Suite 201 Deerfield Beach, FL 33441-5634 or by calling 1-800-965-8307
or 954-785-1121.
|
|
|