You are not logged in.
This means you
CAN ONLY VIEW reports that were published prior to Wednesday, March 19, 2025.
You
MUST UPGRADE YOUR MEMBERSHIP if you want to see any current reports.
AFTER MARKET UPDATE - WEDNESDAY, APRIL 11TH, 2018
Previous After Market Report Next After Market Report >>>
|
|
|
|
DOW |
-218.55 |
24,189.45 |
-0.90% |
|
Volume |
727,514,540 |
-18% |
|
Volume |
1,842,126,190 |
-17% |
|
NASDAQ |
-25.27 |
7,069.03 |
-0.36% |
|
Advancers |
1,468 |
51% |
|
Advancers |
1,390 |
48% |
|
S&P 500 |
-14.68 |
2,642.19 |
-0.55% |
|
Decliners |
1,416 |
49% |
|
Decliners |
1,482 |
52% |
|
Russell 2000 |
+3.26 |
1,546.70 |
+0.21% |
|
52 Wk Highs |
47 |
|
|
52 Wk Highs |
57 |
|
|
S&P 600 |
+1.90 |
951.53 |
+0.20% |
|
52 Wk Lows |
35 |
|
|
52 Wk Lows |
24 |
|
|
 |
Major Indices Fell With Less Volume and Leadership Waned
Kenneth J. Gruneisen - Passed the CAN SLIM® Master's Exam
Stocks finished lower Wednesday. The Dow was down 218 points to 24186 while the S&P 500 declined 14 points to 2642. The Nasdaq Composite lost 25 points to 7069. The volume totals reported were lighter than the prior session totals on the NYSE and on the Nasdaq exchange, indicative of lighter institutional selling pressure. Advancers and decliners were evenly mixed on both the Nasdaq exchange and the NYSE. Leadership waned as there were 13 high-ranked companies from the Leaders List that made new 52-week highs and were listed on the BreakOuts Page, versus the total of 19 on the prior session. New 52-week higher totals outnumbered new 52-week lows totals on both the NYSE and the Nasdaq exchange. Tuesday's big gains for all three major indices (M criteria) came with higher volume totals coupled with more stocks hitting new highs. The strong action met the definition of a follow-through day on Day 6 of the rally effort. With the new confirmed rally, buying efforts are justified when all key criteria of the fact-based investment system are satisfied. The Featured Stocks Page provides the most timely analysis on high-ranked leaders. Charts used courtesy of www.stockcharts.com
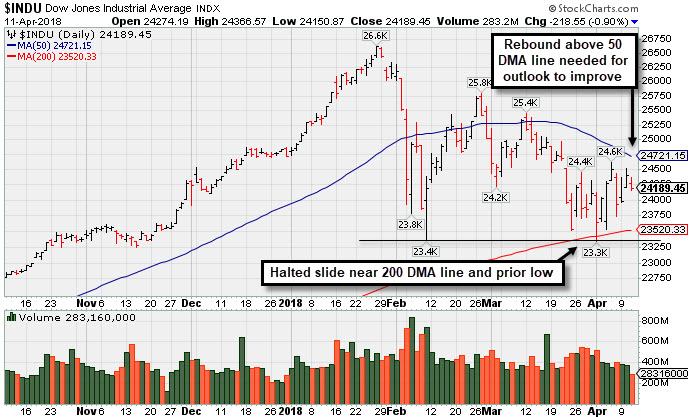 PICTURED: The Dow Jones Industrial Average halted its slide near the 200-day moving average (DMA) line and prior low which define important near-term support. Technically, more damaging losses would signal for investors to reduce market exposure.
The major averages fell amid rising geopolitical unrest following a series of tweets from President Trump related to Syria and Russia. NYMEX WTI crude climbed 1.9% to $66.73/barrel, touching its highest level since December 2014, in sympathy with the rising tensions in the Middle East. On the data front, the core Consumer Price Index (ex-food and energy) increased 2.1% year-over-year in March, up from last month’s 1.8% reading. A separate report showed weekly mortgage applications dipped 1.9% to a seven-week low. In central bank news, the minutes from the Fed’s latest meeting showed officials leaned towards a slightly faster pace of tightening.
Nine of 11 S&P 500 sectors ended lower with Financial and Telecomm companies leading the decline. Morgan Stanley (MS -2.59%) and Bank of America (BAC -1.90%) both fell. The Energy sector bucked the downward trend and gained 1%, in sympathy with surging oil prices. Fastenal Company (FAST -6.19%) was a notable decliner despite releasing earning results that met analyst expectations.
Treasuries strengthened across the curve with the yield on the benchmark 10-year note down two basis points to 2.78%. In commodities, COMEX Gold gained 1.1% to $1356.50/ounce amid a weaker dollar. |
 Kenneth J. Gruneisen started out as a licensed stockbroker in August 1987, a couple of months prior to the historic stock market crash that took the Dow Jones Industrial Average down -22.6% in a single day. He has published daily fact-based fundamental and technical analysis on high-ranked stocks online for two decades. Through FACTBASEDINVESTING.COM, Kenneth provides educational articles, news, market commentary, and other information regarding proven investment systems that work in good times and bad.
Comments contained in the body of this report are technical opinions only and are not necessarily those of Gruneisen Growth Corp. The material herein has been obtained from sources believed to be reliable and accurate, however, its accuracy and completeness cannot be guaranteed. Our firm, employees, and customers may effect transactions, including transactions contrary to any recommendation herein, or have positions in the securities mentioned herein or options with respect thereto. Any recommendation contained in this report may not be suitable for all investors and it is not to be deemed an offer or solicitation on our part with respect to the purchase or sale of any securities. |
|
 |
Commodity-Linked Groups Led Gainers
Kenneth J. Gruneisen - Passed the CAN SLIM® Master's Exam
On Wednesday the Bank Index ($BKX -1.15%) and Broker/Dealer Index ($XBD -0.58%) fell along with the Retail Index ($RLX -0.33%). The tech sector was mixed as the Biotech Index ($BTK -0.30%) edged lower, the Semiconductor Index ($SOX +0.04%) was unchanged, and the Networking Index ($NWX +0.30%) eked out a small gain. The Oil Services Index ($OSX +3.23%) was a standout gainer while both the Integrated Oil Index ($XOI +1.47%) and the Gold & Silver Index ($XAU +2.14%) also rose. Charts courtesy wwwstockcharts.com
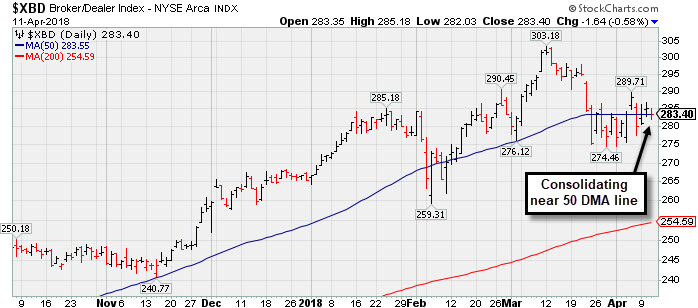 PICTURED: The Broker/Dealer Index ($XBD -0.58%) is consolidating near its 50-day moving average (DMA) line. The prior low and its 200 DMA line define important near-term support.
| Oil Services |
$OSX |
148.32 |
+4.64 |
+3.23% |
-0.82% |
| Integrated Oil |
$XOI |
1,404.17 |
+20.30 |
+1.47% |
+5.14% |
| Semiconductor |
$SOX |
1,315.06 |
+0.52 |
+0.04% |
+4.95% |
| Networking |
$NWX |
534.18 |
+1.62 |
+0.30% |
+8.90% |
| Broker/Dealer |
$XBD |
283.40 |
-1.64 |
-0.58% |
+6.85% |
| Retail |
$RLX |
1,913.97 |
-6.39 |
-0.33% |
+10.39% |
| Gold & Silver |
$XAU |
83.69 |
+1.75 |
+2.14% |
-1.85% |
| Bank |
$BKX |
106.29 |
-1.23 |
-1.14% |
-0.39% |
| Biotech |
$BTK |
4,586.67 |
-13.87 |
-0.30% |
+8.63% |
|
|
|
 |
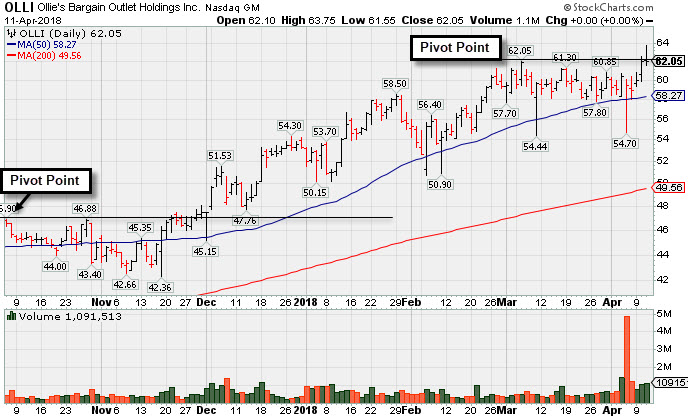
Encountered Distribution, Finished Below Pivot Point After Early Gain
Kenneth J. Gruneisen - Passed the CAN SLIM® Master's Exam
Ollie's Bargain Outlet (OLLI +$62.05) encountered distributional pressure today and ended the session below the pivot point and unchanged after early gains helped it hit a new all-time high. It posted a big gain for a new high backed by +66% above average volume on the prior session. Still, confirming volume-driven gains above the pivot point are needed to clinch a convincing new technical buy signal.
Its color code was recently changed to yellow and a new pivot point was cited based on its 3/06/18 high. OLLI found prompt support on 4/05/18 after undercutting its 50-day moving average (DMA) line ($58.27) and nearly testing the prior low ($54.44 on 3/09/18). Fundamentals remain very strong. Recently it reported earnings +31% on +26% sales revenues for the Jan '18 quarter, continuing its strong earnings track record and meeting the +25% minimum earnings guideline (C criteria). It has earned a very strong 97 Earnings Per Share (EPS) rating.
OLLI was last shown in this FSU section on 3/13/18 with an annotated graph under the headline, "Bargain Outlet's Shares Perched Near All-Time Price High". The Retail - Discount & Variety firm traded up as much as +141.2% since highlighted in yellow with a pivot point based on its 4/28/16 high plus 10 cents in 7/19/16 mid-day report (read here).
OLLI completed its $16 IPO on 7/16/15. It completed a Secondary Offerings on 6/06/16 and 2/18/16. The number of top-rated funds owning its shares rose from 98 in Sep '15 to 417 in Mar '18, a reassuring sign concerning the I criteria. Its current Up/Down Volume ratio of 0.9 is an unbiased indication its shares have been under slight distributional pressure over the past 50 days. The small supply of only 62.2 million shares outstanding (S criteria) can contribute to greater price volatility in the event of institutional buying or selling.
|
|
|
Color Codes Explained :
Y - Better candidates highlighted by our
staff of experts.
G - Previously featured
in past reports as yellow but may no longer be buyable under the
guidelines.
***Last / Change / Volume data in this table is the closing quote data***
Symbol/Exchange
Company Name
Industry Group |
PRICE |
CHANGE
(%Change) |
Day High |
Volume
(% DAV)
(% 50 day avg vol) |
52 Wk Hi
% From Hi |
Featured
Date |
Price
Featured |
Pivot Featured |
|
Max Buy |
PFBC
-
NASDAQ
Preferred Bank Los Angls
BANKING - Regional - Pacific Banks
|
$63.83
|
-0.67
-1.04% |
$64.24
|
67,075
77.99% of 50 DAV
50 DAV is 86,000
|
$67.65
-5.65%
|
4/10/2018
|
$64.56
|
PP = $67.75
|
|
MB = $71.14
|
Most Recent Note - 4/10/2018 1:13:30 PM
Y - Color code is changed to yellow with pivot point cited based on its 1/22/18 high plus 10 cents. Subsequent volume-driven gains for new highs may trigger a technical buy signal. Fundamentals through Dec '17 have remained strong. Consolidating near its 50 DMA line ($64.12). It made gradual progress since dropped from the Featured Stocks list on 1/03/18.
>>> FEATURED STOCK ARTICLE : Bank Stock Hovering Within Striking Distance of Prior High - 4/10/2018 |
View all notes |
Set NEW NOTE alert |
Company Profile |
SEC
News |
Chart |
Request a new note
C
A
S
I |
SIVB
-
NASDAQ
S V B Financial Group
BANKING - Regional - Pacific Banks
|
$243.59
|
-2.07
-0.84% |
$245.76
|
356,082
48.58% of 50 DAV
50 DAV is 733,000
|
$271.79
-10.38%
|
3/12/2018
|
$267.79
|
PP = $263.19
|
|
MB = $276.35
|
Most Recent Note - 4/10/2018 5:39:21 PM
G - Found support when recently sputtering near the prior low ($226.61 on 2/06/18). A rebound above the downward sloping 50 DMA line ($249.25) is needed to help its outlook improve.
>>> FEATURED STOCK ARTICLE : Endured Distributional Pressure After Wedging Higher - 3/12/2018 |
View all notes |
Set NEW NOTE alert |
Company Profile |
SEC
News |
Chart |
Request a new note
C
A
S
I |
TPL
-
NYSE
Texas Pacific Land Trust
FINANCIAL SERVICES - Diversified Investments
|
$525.01
|
+4.04
0.78% |
$531.15
|
17,238
123.13% of 50 DAV
50 DAV is 14,000
|
$569.99
-7.89%
|
2/20/2018
|
$517.00
|
PP = $569.99
|
|
MB = $598.49
|
Most Recent Note - 4/10/2018 5:40:43 PM
G - Rebounded above the 50 DMA line ($515.75) helping its outlook to improve. Recent lows ($480) define important support where damaging losses may trigger a worrisome technical sell signal.
>>> FEATURED STOCK ARTICLE : Slump Under 50-Day Average Line Hurt Near Term Outlook - 3/23/2018 |
View all notes |
Set NEW NOTE alert |
Company Profile |
SEC
News |
Chart |
Request a new note
C
A
S
I |
LMAT
-
NASDAQ
Lemaitre Vascular Inc
Medical-Products
|
$40.24
|
+2.03
5.31% |
$40.75
|
263,081
192.03% of 50 DAV
50 DAV is 137,000
|
$39.88
0.90%
|
3/19/2018
|
$36.77
|
PP = $39.98
|
|
MB = $41.98
|
 Most Recent Note - 4/11/2018 6:25:16 PM
Y - Triggered a technical buy signal as it posted a solid gain today with +92% above average volume, rising above the new pivot point cited based on its 10/20/17 high plus 10 cents. Found support recently near its 50 DMA line ($35.95).
>>> FEATURED STOCK ARTICLE : Rebounding Near High After Choppy Consolidation - 3/19/2018 |
View all notes |
Set NEW NOTE alert |
Company Profile |
SEC
News |
Chart |
Request a new note
C
A
S
I |
DPZ
-
NYSE
Dominos Pizza Inc
WHOLESALE - Food Wholesale
|
$231.00
|
-0.70
-0.30% |
$232.80
|
326,701
33.27% of 50 DAV
50 DAV is 982,000
|
$236.93
-2.50%
|
2/20/2018
|
$224.86
|
PP = $222.01
|
|
MB = $233.11
|
Most Recent Note - 4/11/2018 6:27:27 PM
Y - Volume totals have been cooling while hovering near its all-time high. Made limited headway since highlighted in the 2/20/18 mid-day report with pivot point cited based on its 1/25/18 high plus 10 cents. Its 50 DMA line ($223) defines near-term support to watch.
>>> FEATURED STOCK ARTICLE : Popular Pizza Firm Perched Near All Time High - 3/21/2018 |
View all notes |
Set NEW NOTE alert |
Company Profile |
SEC
News |
Chart |
Request a new note
C
A
S
I |
Symbol/Exchange
Company Name
Industry Group |
PRICE |
CHANGE
(%Change) |
Day High |
Volume
(% DAV)
(% 50 day avg vol) |
52 Wk Hi
% From Hi |
Featured
Date |
Price
Featured |
Pivot Featured |
|
Max Buy |
FIVE
-
NASDAQ
Five Below Inc
Retail-DiscountandVariety
|
$76.49
|
+2.40
3.24% |
$77.03
|
1,976,940
165.43% of 50 DAV
50 DAV is 1,195,000
|
$74.35
2.88%
|
3/9/2018
|
$68.58
|
PP = $73.65
|
|
MB = $77.33
|
Most Recent Note - 4/11/2018 12:02:12 PM
Y - Trading further into new high territory today after a big gain on the prior session backed by only +18% above average volume. New pivot point recently was cited based on its 1/05/18 high plus 10 cents. Disciplined investors know that gains above a stock's pivot point must have a minimum +40% above average volume to trigger a proper technical buy signal. See the latest FSU analysis for more details and an annotated graph.
>>> FEATURED STOCK ARTICLE : Quietly Hovering Near All-Time High - 4/5/2018 |
View all notes |
Set NEW NOTE alert |
Company Profile |
SEC
News |
Chart |
Request a new note
C
A
S
I |
NVEE
-
NASDAQ
N V 5 Global Inc
Comml Svcs-Consulting
|
$58.15
|
-0.73
-1.23% |
$59.30
|
84,406
108.21% of 50 DAV
50 DAV is 78,000
|
$59.65
-2.51%
|
4/9/2018
|
$58.35
|
PP = $59.05
|
|
MB = $62.00
|
Most Recent Note - 4/10/2018 5:53:20 PM
Y - Posted a 2nd consecutive gain today with above average volume and it hit a new high. Highlighted in yellow with new pivot point cited based on its 10/31/17 high plus 10 cents in the 4/09/18 mid-day report. Subsequent gains for a new all-time high backed by at least +40% above average volume may trigger a technical buy signal. See the latest FSU analysis for more details and an annotated graph.
>>> FEATURED STOCK ARTICLE : Perched Near High After 3 Strong Quarterly Comparisons - 4/9/2018 |
View all notes |
Set NEW NOTE alert |
Company Profile |
SEC
News |
Chart |
Request a new note
C
A
S
I |
SPLK
-
NASDAQ
Splunk Inc
Computer Sftwr-Database
|
$102.13
|
+0.34
0.33% |
$103.73
|
1,500,600
73.02% of 50 DAV
50 DAV is 2,055,000
|
$112.66
-9.35%
|
2/15/2018
|
$96.06
|
PP = $93.68
|
|
MB = $98.36
|
Most Recent Note - 4/10/2018 5:30:18 PM
G - Found prompt support near its 50 DMA ($97.93) line and the prior high in the $97 area. More damaging losses would raise greater concerns. It has not formed a sound base.
>>> FEATURED STOCK ARTICLE : Extended After Rallying from Secondary Buy Point - 3/20/2018 |
View all notes |
Set NEW NOTE alert |
Company Profile |
SEC
News |
Chart |
Request a new note
C
A
S
I |
PAYC
-
NYSE
Paycom Software Inc
COMPUTER SOFTWARE and SERVICES - Application Software
|
$112.27
|
+1.23
1.11% |
$113.72
|
443,416
58.27% of 50 DAV
50 DAV is 761,000
|
$115.48
-2.78%
|
2/15/2018
|
$95.01
|
PP = $93.61
|
|
MB = $98.29
|
Most Recent Note - 4/10/2018 5:44:14 PM
G - Its 50 DMA line ($100.78) defines near-term support above prior highs in the $93 area. Fundamentals remain strong.
>>> FEATURED STOCK ARTICLE : Pulling Back After Negative Reversal at All-Time High Last Week - 4/4/2018 |
View all notes |
Set NEW NOTE alert |
Company Profile |
SEC
News |
Chart |
Request a new note
C
A
S
I |
GRUB
-
NYSE
Grubhub Inc
COMPUTER SOFTWARE and SERVICES - Technical and System Software
|
$98.32
|
-1.55
-1.55% |
$100.96
|
968,161
48.31% of 50 DAV
50 DAV is 2,004,000
|
$112.41
-12.53%
|
6/21/2017
|
$47.33
|
PP = $46.94
|
|
MB = $49.29
|
Most Recent Note - 4/10/2018 5:42:47 PM
G - Found support at its 50 DMA line ($96.06) recently. More damaging losses below the 50 DMA line and recent low ($94.08 on 4/04/18) would raise greater concerns.
>>> FEATURED STOCK ARTICLE : Very Extended and Enduring Distributional Pressure - 3/29/2018 |
View all notes |
Set NEW NOTE alert |
Company Profile |
SEC
News |
Chart |
Request a new note
C
A
S
I |
Symbol/Exchange
Company Name
Industry Group |
PRICE |
CHANGE
(%Change) |
Day High |
Volume
(% DAV)
(% 50 day avg vol) |
52 Wk Hi
% From Hi |
Featured
Date |
Price
Featured |
Pivot Featured |
|
Max Buy |
HQY
-
NASDAQ
Healthequity Inc
COMPUTER SOFTWARE and SERVICES - Healthcare Information Service
|
$63.43
|
-0.40
-0.63% |
$64.19
|
314,181
40.33% of 50 DAV
50 DAV is 779,000
|
$68.75
-7.74%
|
2/20/2018
|
$56.37
|
PP = $55.41
|
|
MB = $58.18
|
Most Recent Note - 4/10/2018 5:37:17 PM
G - Volume totals have been cooling while still hovering near its all-time high, extended from any sound base. Its 50 DMA line ($57.30) defines near term support above prior highs.
>>> FEATURED STOCK ARTICLE : Bullish Action Followed Latest Earnings Report - 3/22/2018 |
View all notes |
Set NEW NOTE alert |
Company Profile |
SEC
News |
Chart |
Request a new note
C
A
S
I |
LOB
-
NASDAQ
Live Oak Bancshares Inc
Banks-Southeast
|
$28.70
|
-0.20
-0.69% |
$29.00
|
85,812
61.29% of 50 DAV
50 DAV is 140,000
|
$30.05
-4.49%
|
3/16/2018
|
$28.63
|
PP = $28.30
|
|
MB = $29.72
|
Most Recent Note - 4/5/2018 5:10:05 PM
Y - Posted a 3rd consecutive gain today with +25% above average volume, rising above its pivot point. After testing its 50 DMA line ($27.24) any more damaging losses would raise greater concerns.
>>> FEATURED STOCK ARTICLE : Tallied Volume-Driven Gain for New High - 3/16/2018 |
View all notes |
Set NEW NOTE alert |
Company Profile |
SEC
News |
Chart |
Request a new note
C
A
S
I |
PYPL
-
NASDAQ
Paypal Holdings Inc
Finance-CrdtCard/PmtPr
|
$76.50
|
-0.29
-0.38% |
$77.40
|
4,501,618
43.23% of 50 DAV
50 DAV is 10,413,000
|
$86.32
-11.38%
|
2/1/2018
|
$80.35
|
PP = $79.49
|
|
MB = $83.46
|
Most Recent Note - 4/5/2018 5:08:17 PM
G - Gapped up today, however a rebound above its 50 DMA line ($78.75) is still needed for its outlook to improve. Halted its slide above the prior low ($71.63 on 2/09/18) which defines the next important support level.
>>> FEATURED STOCK ARTICLE : Sputtering Below 50-Day Moving Average Again - 3/27/2018 |
View all notes |
Set NEW NOTE alert |
Company Profile |
SEC
News |
Chart |
Request a new note
C
A
S
I |
OLLI
-
NASDAQ
Ollie's Bargain Outlet
Retail-DiscountandVariety
|
$62.05
|
+0.00
0.00% |
$63.75
|
1,091,513
173.81% of 50 DAV
50 DAV is 628,000
|
$62.55
-0.80%
|
4/10/2018
|
$62.05
|
PP = $62.15
|
|
MB = $65.26
|
Most Recent Note - 4/11/2018 6:23:32 PM
Y - Encountered distributional pressure and finished unchanged after hitting a new all-time high today. Posted a big gain for a new high backed by +66% above average volume on the prior session. See the latest FSU analysis for more details and a new annotated graph.
>>> FEATURED STOCK ARTICLE : Encountered Distribution, Finished Below Pivot Point After Early Gain - 4/11/2018 |
View all notes |
Set NEW NOTE alert |
Company Profile |
SEC
News |
Chart |
Request a new note
C
A
S
I |
WB
-
NASDAQ
Weibo Corp Cl A Ads
INTERNET - Content
|
$123.91
|
+0.34
0.28% |
$125.19
|
1,215,687
59.53% of 50 DAV
50 DAV is 2,042,000
|
$142.12
-12.81%
|
1/16/2018
|
$126.33
|
PP = $122.21
|
|
MB = $128.32
|
Most Recent Note - 4/10/2018 5:35:02 PM
G - Stayed well above the 200 DMA line. It has rebounded toward its 50 DMA line ($127.30), but gains above that short-term average are still needed for its outlook to improve. See the latest FSU analysis for more details and an annotated graph.
>>> FEATURED STOCK ARTICLE : Quietly Slumping Near Prior Low - 4/6/2018 |
View all notes |
Set NEW NOTE alert |
Company Profile |
SEC
News |
Chart |
Request a new note
C
A
S
I |
Symbol/Exchange
Company Name
Industry Group |
PRICE |
CHANGE
(%Change) |
Day High |
Volume
(% DAV)
(% 50 day avg vol) |
52 Wk Hi
% From Hi |
Featured
Date |
Price
Featured |
Pivot Featured |
|
Max Buy |
SQ
-
NYSE
Square Inc Cl A
Finance-CrdtCard/PmtPr
|
$47.76
|
-0.04
-0.08% |
$48.99
|
7,802,854
52.60% of 50 DAV
50 DAV is 14,835,000
|
$58.46
-18.30%
|
3/5/2018
|
$49.70
|
PP = $49.66
|
|
MB = $52.14
|
Most Recent Note - 4/10/2018 5:32:06 PM
G - Quietly rebounded above the 50 DMA line ($47.67) today helping its outlook improve. It has not formed a sound base.
>>> FEATURED STOCK ARTICLE : Slumped Back Into Prior Base Testing 50-Day Average - 4/2/2018 |
View all notes |
Set NEW NOTE alert |
Company Profile |
SEC
News |
Chart |
Request a new note
C
A
S
I |
SEND
-
NYSE
Sendgrid Inc
INTERNET - Content
|
$26.35
|
+0.23
0.88% |
$26.55
|
521,703
152.10% of 50 DAV
50 DAV is 343,000
|
$32.03
-17.72%
|
3/6/2018
|
$28.00
|
PP = $28.37
|
|
MB = $29.79
|
Most Recent Note - 4/10/2018 5:27:26 PM
G - Rebounded near its 50 DMA line ($26.33) with a big gain today on average volume. Priced a new Public Offering and Secondary Offering on 4/05/18.
>>> FEATURED STOCK ARTICLE : Slumped Into Prior Base Testing 50-Day Average - 4/3/2018 |
View all notes |
Set NEW NOTE alert |
Company Profile |
SEC
News |
Chart |
Request a new note
C
A
S
I |
|
|
|
THESE ARE NOT BUY RECOMMENDATIONS!
Comments contained in the body of this report are technical
opinions only. The material herein has been obtained
from sources believed to be reliable and accurate, however,
its accuracy and completeness cannot be guaranteed.
This site is not an investment advisor, hence it does
not endorse or recommend any securities or other investments.
Any recommendation contained in this report may not
be suitable for all investors and it is not to be deemed
an offer or solicitation on our part with respect to
the purchase or sale of any securities. All trademarks,
service marks and trade names appearing in this report
are the property of their respective owners, and are
likewise used for identification purposes only.
This report is a service available
only to active Paid Premium Members.
You may opt-out of receiving report notifications
at any time. Questions or comments may be submitted
by writing to Premium Membership Services 665 S.E. 10 Street, Suite 201 Deerfield Beach, FL 33441-5634 or by calling 1-800-965-8307
or 954-785-1121.
|
|
|