***Last / Change / Volume data in this table is the closing quote data***
Symbol/Exchange
Company Name
Industry Group |
PRICE |
CHANGE
(%Change) |
Day High |
Volume
(% DAV)
(% 50 day avg vol) |
52 Wk Hi
% From Hi |
Featured
Date |
Price
Featured |
Pivot Featured |
|
Max Buy |
 SIVB
-
NASDAQ
SIVB
-
NASDAQ
S V B Financial Group
BANKING - Regional - Pacific Banks
|
$741.97
|
+0.05
0.01% |
$749.60
|
136,153
38.90% of 50 DAV
50 DAV is 350,000
|
$762.95
-2.75%
|
8/6/2021
|
$589.70
|
PP = $608.94
|
|
MB = $639.39
|
Most Recent Note - 11/5/2021 1:14:43 PM
G - Hovering near its all-time high, extended from the previously noted base. Recently reported Sep '21 quarterly earnings -14% on +43% sales revenues versus the year ago period, below the +25% minimum earnings guideline (C criteria), raising fundamental concerns. Its 50 DMA line ($654) defines important near-term support to watch on pullbacks. Completed a new Public Offering on 8/11/21.
>>> FEATURED STOCK ARTICLE : Latest Quarter Raised Fundamental Concerns - 10/29/2021 |
View all notes |
Set NEW NOTE alert |
Company Profile |
SEC
News |
Chart |
Request a new note
C
A
S
I |
BLDR
-
NYSE
Builders Firstsource Inc
Bldg-Constr Prds/Misc
|
$67.46
|
+0.54
0.81% |
$68.39
|
1,219,366
64.28% of 50 DAV
50 DAV is 1,897,000
|
$68.92
-2.12%
|
8/12/2021
|
$52.38
|
PP = $54.09
|
|
MB = $56.79
|
 Most Recent Note - 11/11/2021 5:08:35 PM
G - Volume totals have been cooling while hovering near its all-time high, very extended from any sound base. Bullish action came after it reported Sep '21 quarterly earnings +308% on +140% sales revenues versus the year ago period. Its 50 DMA line ($56.71) and prior highs in the $55 area define important near-term support to watch on pullbacks.
>>> FEATURED STOCK ARTICLE : Earnings News Due Thursday for High-Ranked Building Products Firm - 11/2/2021 |
View all notes |
Set NEW NOTE alert |
Company Profile |
SEC
News |
Chart |
Request a new note
C
A
S
I |
KFRC
-
NASDAQ
Kforce Inc
Comml Svcs-Staffing
|
$77.46
|
+0.77
1.00% |
$78.44
|
128,946
122.81% of 50 DAV
50 DAV is 105,000
|
$76.75
0.93%
|
9/10/2021
|
$59.53
|
PP = $64.48
|
|
MB = $67.70
|
Most Recent Note - 11/5/2021 1:11:18 PM
G - Extended from any sound base and hitting a new all-time high with today's 7th consecutive gain. Fundamentals remain strong. Its 50 DMA line ($63) and recent low define important near-term support to watch on pullbacks.
>>> FEATURED STOCK ARTICLE : Pulling Back Near Prior Highs Following Technical Breakout - 10/15/2021 |
View all notes |
Set NEW NOTE alert |
Company Profile |
SEC
News |
Chart |
Request a new note
C
A
S
I |
GNRC
-
NYSE
Generac Hldgs Inc
Electrical-Power/Equipmt
|
$450.03
|
+9.64
2.19% |
$450.76
|
519,229
78.91% of 50 DAV
50 DAV is 658,000
|
$524.31
-14.17%
|
8/30/2021
|
$449.36
|
PP = $457.10
|
|
MB = $479.96
|
Most Recent Note - 11/8/2021 6:09:29 PM
G - Halted its slide at its 50 DMA line ($444) with a gain today on light volume. Churned above average volume after a "negative reversal" last week at its all-time high. Weak action came after it reported Sep '21 quarterly earnings +13% on +34% sales revenues versus the year ago period, below the +25% minimum earnings guideline (C criteria), raising fundamental concerns. See the latest FSU analysis for more details and a new annotated graph.
>>> FEATURED STOCK ARTICLE : Halted Slide at 50-Day Moving Average After Earnings News - 11/8/2021 |
View all notes |
Set NEW NOTE alert |
Company Profile |
SEC
News |
Chart |
Request a new note
C
A
S
I |
CAMT
-
NASDAQ
Camtek Ltd
ELECTRONICS - Scientific and Technical Instrum
|
$44.85
|
+1.85
4.30% |
$44.96
|
171,429
111.32% of 50 DAV
50 DAV is 154,000
|
$46.01
-2.52%
|
11/9/2021
|
$45.43
|
PP = $46.11
|
|
MB = $48.42
|
Most Recent Note - 11/11/2021 3:43:07 PM
Y - Posting a big gain today with near average volume. Color code was changed to yellow and a new pivot point was cited based on its 9/23/21 high plus 10 cents. Challenged its 52-week high following a 6-week base during which it traded above and below its 50 DMA line ($40.99). Subsequent gains above its pivot point backed by at least +40% above average volume may trigger a new (or add-on) technical buy signal. Reported Sep '21 quarterly earnings +150% versus the year ago period. Fundamentals remain strong.
>>> FEATURED STOCK ARTICLE : Rebound Above 50-Day Moving Average Helped Outlook - 11/5/2021 |
View all notes |
Set NEW NOTE alert |
Company Profile |
SEC
News |
Chart |
Request a new note
C
A
S
I |
Symbol/Exchange
Company Name
Industry Group |
PRICE |
CHANGE
(%Change) |
Day High |
Volume
(% DAV)
(% 50 day avg vol) |
52 Wk Hi
% From Hi |
Featured
Date |
Price
Featured |
Pivot Featured |
|
Max Buy |
PKI
-
NYSE
Perkinelmer Inc
Medical-Research Eqp/Svc
|
$179.02
|
+3.14
1.79% |
$179.06
|
690,270
106.97% of 50 DAV
50 DAV is 645,300
|
$192.00
-6.76%
|
8/18/2021
|
$181.07
|
PP = $188.50
|
|
MB = $197.93
|
Most Recent Note - 11/11/2021 3:59:52 PM
Rebounded above its 50 DMA line with today's 4th consecutive gain on lighter volume helping its outlook improve. Sep '21 quarterly earnings rose +11% versus the year ago period, below the +25% minimum earnings guideline (C criteria), raising concerns. Its Relative Strength Rating now is 73, still below the 80+ minimum guideline for buy candidates. It will be dropped from the Featured Stocks list tonight.
>>> FEATURED STOCK ARTICLE : Rebound Above 50 DMA Line Needed to Help Outlook Improve - 10/19/2021 |
View all notes |
Set NEW NOTE alert |
Company Profile |
SEC
News |
Chart |
Request a new note
C
A
S
I |
AMD
-
NASDAQ
Advanced Micro Devices
ELECTRONICS - Semiconductor - Broad Line
|
$146.01
|
+6.14
4.39% |
$146.47
|
67,448,833
138.41% of 50 DAV
50 DAV is 48,730,000
|
$155.65
-6.19%
|
10/27/2021
|
$124.91
|
PP = $122.59
|
|
MB = $128.72
|
Most Recent Note - 11/11/2021 3:41:50 PM
G - Perched near its all-time high following considerable volume-driven gains, very extended from the previously noted base. Disciplined investors avoid chasing extended stocks. Prior high in the $122 area defines initial support to watch on pullbacks. Fundamentals remain strong after it reported Sep '21 quarterly earnings +78% on +54% sales revenues versus the year ago period.
>>> FEATURED STOCK ARTICLE : Encountered Distributional Pressure After Reaching New High - 10/27/2021 |
View all notes |
Set NEW NOTE alert |
Company Profile |
SEC
News |
Chart |
Request a new note
C
A
S
I |
UMC
-
NYSE
United Microelectrnc Adr
ELECTRONICS - Semiconductor - Integrated Cir
|
$11.40
|
+0.31
2.80% |
$11.50
|
7,801,430
99.65% of 50 DAV
50 DAV is 7,829,000
|
$12.62
-9.67%
|
8/5/2021
|
$11.62
|
PP = $11.38
|
|
MB = $11.95
|
Most Recent Note - 11/11/2021 3:51:00 PM
G - Gains above the 50 DMA line ($11.14) this week have helped its outlook to improve. Reported Sep '21 quarterly earnings +100% on +30% sales revenues versus the year ago period. Recently found support above its 200 DMA line ($9.99).
>>> FEATURED STOCK ARTICLE : Earnings News Due From Taiwan-Based Semiconductor Firm - 10/26/2021 |
View all notes |
Set NEW NOTE alert |
Company Profile |
SEC
News |
Chart |
Request a new note
C
A
S
I |
BRKS
-
NASDAQ
Brooks Automation
ELECTRONICS - Semiconductor Equipment and Mate
|
$113.80
|
-4.44
-3.76% |
$116.89
|
1,052,352
183.98% of 50 DAV
50 DAV is 572,000
|
$124.79
-8.81%
|
9/20/2021
|
$101.21
|
PP = $108.82
|
|
MB = $114.26
|
Most Recent Note - 11/11/2021 12:36:53 PM
Y - Reported Sep 21 quarterly earnings +33% on +27% sales revenues versus the year ago period. Volume and volatility often increase near earnings news. Color code is changed to yellow while pulling back below its "max buy" level with volume-driven losses. Prior high in the $110 area defines initial support to watch above its 50 DMA line ($104.66).
>>> FEATURED STOCK ARTICLE : 5th Quiet Gain Has Brooks Perched Near Prior Highs - 10/20/2021 |
View all notes |
Set NEW NOTE alert |
Company Profile |
SEC
News |
Chart |
Request a new note
C
A
S
I |
ENTG
-
NASDAQ
Entegris Inc
ELECTRONICS - Semiconductor Equipment and Mate
|
$149.87
|
+4.69
3.23% |
$150.57
|
877,258
106.98% of 50 DAV
50 DAV is 820,000
|
$149.47
0.27%
|
8/4/2021
|
$125.33
|
PP = $126.51
|
|
MB = $132.84
|
Most Recent Note - 11/10/2021 2:44:50 PM
G - Pulling back from its all-time high with today's loss on light volume after getting very extended from any sound base. Prior high ($136) and its 50 DMA line ($130) define near-term support to watch. Fundamentals remain strong after it recently reported Sep '21 quarterly earnings +37% on +20% sales revenues versus the year ago period.
>>> FEATURED STOCK ARTICLE : Hit New Record High With Another Volume-Driven Gain - 10/22/2021 |
View all notes |
Set NEW NOTE alert |
Company Profile |
SEC
News |
Chart |
Request a new note
C
A
S
I |
Symbol/Exchange
Company Name
Industry Group |
PRICE |
CHANGE
(%Change) |
Day High |
Volume
(% DAV)
(% 50 day avg vol) |
52 Wk Hi
% From Hi |
Featured
Date |
Price
Featured |
Pivot Featured |
|
Max Buy |
SKY
-
NYSE
Skyline Champion Corp
Bldg-Mobile/Mfg andamp; RV
|
$75.33
|
+0.06
0.08% |
$76.73
|
342,328
90.32% of 50 DAV
50 DAV is 379,000
|
$77.40
-2.67%
|
11/3/2021
|
$72.19
|
PP = $66.92
|
|
MB = $70.27
|
Most Recent Note - 11/11/2021 5:10:22 PM
G - Extended from the previously noted flat base. Prior highs in the $66 area define initial support to watch above its 50 DMA line ($64.17) on pullbacks. Reported very strong Mar, Jun and Sep '21 quarterly results versus the year ago periods well above the +25% minimum earnings guideline (C criteria). Annual earnings (A criteria) history has been strong.
>>> FEATURED STOCK ARTICLE : Breakaway Gap After 10-Week Flat Base - 11/3/2021 |
View all notes |
Set NEW NOTE alert |
Company Profile |
SEC
News |
Chart |
Request a new note
C
A
S
I |
WSM
-
NYSE
Williams Sonoma Inc
RETAIL - Home Furnishing Stores
|
$206.34
|
+4.94
2.45% |
$207.66
|
541,036
63.80% of 50 DAV
50 DAV is 848,000
|
$211.14
-2.27%
|
11/3/2021
|
$205.00
|
PP = $195.09
|
|
MB = $204.84
|
Most Recent Note - 11/11/2021 3:55:53 PM
G - Volume totals have been cooling while hovering above its "max buy" level holding its ground after volume-driven gains. Prior highs define near-term support to watch above its 50 DMA line ($185).
>>> FEATURED STOCK ARTICLE : Volume-Driven Gains May Signal a New Meaningful Leg Up - 11/4/2021 |
View all notes |
Set NEW NOTE alert |
Company Profile |
SEC
News |
Chart |
Request a new note
C
A
S
I |
CLFD
-
NASDAQ
Clearfield Inc
TELECOMMUNICATIONS - Cables / Satalite Equipment
|
$66.87
|
+2.26
3.50% |
$68.40
|
125,189
123.95% of 50 DAV
50 DAV is 101,000
|
$67.79
-1.36%
|
7/23/2021
|
$40.23
|
PP = $43.74
|
|
MB = $45.93
|
Most Recent Note - 11/11/2021 3:44:24 PM
G - Hitting yet another new all-time high with today's gain, getting very extended from the previously noted base. Its 50 DMA line ($50.87) defines near-term support to watch on pullbacks. Reported Sep '21 quarterly earnings +141% above the year ago period.
>>> FEATURED STOCK ARTICLE : Extended From Prior Base After Latest Rally - 10/18/2021 |
View all notes |
Set NEW NOTE alert |
Company Profile |
SEC
News |
Chart |
Request a new note
C
A
S
I |
TGH
-
NYSE
Textainer Group Holdings
TRANSPORTATION - Logistics
|
$39.18
|
+0.88
2.30% |
$39.47
|
387,142
82.20% of 50 DAV
50 DAV is 471,000
|
$41.24
-5.00%
|
10/7/2021
|
$36.97
|
PP = $36.80
|
|
MB = $38.64
|
Most Recent Note - 11/10/2021 5:56:48 PM
Y - Color code is changed to yellow after today's 3rd consecutive loss on lighter volume to a close below its "max buy" level. Its 50 DMA line ($35.95) and prior highs define important near-term support to watch. Fundamentals remain strong. See the latest FSU analysis for more details and a new annotated graph.
>>> FEATURED STOCK ARTICLE : Pulling Back Below "Max Buy" Level With Lighter Volume - 11/10/2021 |
View all notes |
Set NEW NOTE alert |
Company Profile |
SEC
News |
Chart |
Request a new note
C
A
S
I |
ENPH
-
NASDAQ
Enphase Energy Inc
Energy-Solar
|
$250.49
|
+19.01
8.21% |
$252.05
|
2,637,883
114.24% of 50 DAV
50 DAV is 2,309,000
|
$246.54
1.60%
|
10/28/2021
|
$218.00
|
PP = $229.14
|
|
MB = $240.60
|
Most Recent Note - 11/11/2021 3:46:10 PM
G - Hitting a new all-time high with today's big gain and its color code is changed to green after rallying well above its "max buy" level. Prior high ($229) defines initial support to watch on pullbacks.
>>> FEATURED STOCK ARTICLE : Enphase is Challenging its All-Time High With Volume-Driven Gains - 10/28/2021 |
View all notes |
Set NEW NOTE alert |
Company Profile |
SEC
News |
Chart |
Request a new note
C
A
S
I |
Symbol/Exchange
Company Name
Industry Group |
PRICE |
CHANGE
(%Change) |
Day High |
Volume
(% DAV)
(% 50 day avg vol) |
52 Wk Hi
% From Hi |
Featured
Date |
Price
Featured |
Pivot Featured |
|
Max Buy |
SMPL
-
NASDAQ
Simply Good Foods Co
Food-Confectionery
|
$39.22
|
-0.52
-1.31% |
$39.82
|
198,893
54.94% of 50 DAV
50 DAV is 362,000
|
$41.35
-5.15%
|
10/25/2021
|
$38.30
|
PP = $38.60
|
|
MB = $40.53
|
Most Recent Note - 11/5/2021 5:51:32 PM
G - Color code is changed to green after hitting a new 52-week high today with +27% above average volume as it rose above its "max buy" level. Prior highs in the $38 area define initial support to watch above its 50 DMA line ($36).
>>> FEATURED STOCK ARTICLE : Consolidating Just Above 50-Day Moving Average Line - 10/12/2021 |
View all notes |
Set NEW NOTE alert |
Company Profile |
SEC
News |
Chart |
Request a new note
C
A
S
I |
WDAY
-
NASDAQ
Workday Inc Cl A
Computer Sftwr-Enterprse
|
$295.24
|
+4.23
1.45% |
$298.45
|
1,289,726
95.75% of 50 DAV
50 DAV is 1,347,000
|
$298.22
-1.00%
|
9/7/2021
|
$275.69
|
PP = $282.87
|
|
MB = $297.01
|
Most Recent Note - 11/11/2021 3:53:09 PM
Y - Poised for a best-ever close with another gain today lacking great volume conviction as it wedges into new high territory. No resistance remains due to overhead supply. Its 50 DMA line ($272) defines near-term support to watch where a violation would raise concerns. Fundamentals remain strong.
>>> FEATURED STOCK ARTICLE : Rebounding From 50-Day Moving Average Toward Prior Highs - 10/13/2021 |
View all notes |
Set NEW NOTE alert |
Company Profile |
SEC
News |
Chart |
Request a new note
C
A
S
I |
CTLT
-
NYSE
"Catalent, Inc"
DRUGS - Biotechnology
|
$126.40
|
+2.74
2.22% |
$126.95
|
1,241,452
136.75% of 50 DAV
50 DAV is 907,800
|
$142.64
-11.39%
|
8/25/2021
|
$128.72
|
PP = $127.78
|
|
MB = $134.17
|
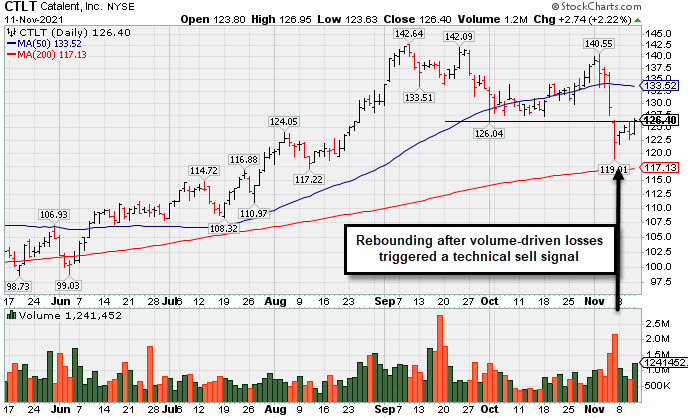
Most Recent Note - 11/11/2021 12:39:01 PM
G - Recently violated prior lows in the $126-127 area and its 50 DMA line triggering technical sell signals. Its Relative Strength Rating has slumped to 63, below the 80+ minimum guideline for buy candidates. Fundamentals remain strong after it reported Sep '21 quarterly earnings +65% on +21% sales revenues versus the year ago period, continuing its strong earnings track record.
>>> FEATURED STOCK ARTICLE : Recent Violation of 50-Day Moving Average Triggered Sell Signal - 11/11/2021 |
View all notes |
Set NEW NOTE alert |
Company Profile |
SEC
News |
Chart |
Request a new note
C
A
S
I |
TTD
-
NASDAQ
The Trade Desk Inc Cl A
Comml Svcs-Advertising
|
$91.55
|
+2.89
3.26% |
$92.56
|
3,840,287
88.16% of 50 DAV
50 DAV is 4,356,000
|
$98.20
-6.77%
|
11/9/2021
|
$95.16
|
PP = $90.00
|
|
MB = $94.50
|
Most Recent Note - 11/11/2021 3:49:44 PM
Y - Posting a gain today with lighter volume, finding support near the August high. Highlighted in yellow in the 11/09/21 mid-day report with new pivot point cited based on its 8/10/21 high as it broke out from a 9-month cup-with-handle shaped base.
>>> FEATURED STOCK ARTICLE : Powerful Volume-Driven Gains for New Highs - 11/9/2021 |
View all notes |
Set NEW NOTE alert |
Company Profile |
SEC
News |
Chart |
Request a new note
C
A
S
I |
MEDP
-
NASDAQ
Medpace Holdings Inc
Medical-Research Eqp/Svc
|
$220.97
|
+1.97
0.90% |
$221.96
|
97,148
51.40% of 50 DAV
50 DAV is 189,000
|
$229.49
-3.71%
|
9/10/2021
|
$196.32
|
PP = $196.22
|
|
MB = $206.03
|
Most Recent Note - 11/5/2021 1:13:00 PM
G - Volume totals have been cooling while stubbornly holding its ground near its 52-week high. Recent bullish action came even after it reported Sep '21 earnings +18% on +28% sales revenues versus the year ago period, below the +25% minimum earnings guideline (C criteria), raising fundamental concerns. Prior highs in the $199 area define initial support above its 50 DMA line ($194).
>>> FEATURED STOCK ARTICLE : Found Prompt Support Near 50-Day Moving Average Line - 10/14/2021 |
View all notes |
Set NEW NOTE alert |
Company Profile |
SEC
News |
Chart |
Request a new note
C
A
S
I |
Symbol/Exchange
Company Name
Industry Group |
PRICE |
CHANGE
(%Change) |
Day High |
Volume
(% DAV)
(% 50 day avg vol) |
52 Wk Hi
% From Hi |
Featured
Date |
Price
Featured |
Pivot Featured |
|
Max Buy |
JEF
-
NYSE
Jefferies Financial Grp
Finance-Invest Bnk/Bkrs
|
$43.10
|
+1.03
2.45% |
$43.19
|
1,126,092
62.35% of 50 DAV
50 DAV is 1,806,000
|
$44.47
-3.08%
|
6/28/2021
|
$31.81
|
PP = $34.42
|
|
MB = $36.14
|
Most Recent Note - 11/8/2021 6:10:29 PM
G - Extended from any sound base and still stubbornly holding its ground near its all-time high. Its 50 DMA line ($39.40) defines important near-term support to watch on pullbacks. Reported Aug '21 quarterly earnings +40% on +20% sales revenues versus the year ago period.
>>> FEATURED STOCK ARTICLE : Extended From Prior Highs and Stubbornly Holding Ground - 11/1/2021 |
View all notes |
Set NEW NOTE alert |
Company Profile |
SEC
News |
Chart |
Request a new note
C
A
S
I |
AVTR
-
NYSE
Avantor Inc
Medical-Research Eqp/Svc
|
$38.53
|
+0.21
0.55% |
$38.67
|
3,128,299
70.11% of 50 DAV
50 DAV is 4,461,800
|
$44.37
-13.16%
|
6/10/2021
|
$32.94
|
PP = $34.09
|
|
MB = $35.79
|
Most Recent Note - 11/5/2021 1:08:54 PM
G - Sputtering after meeting resistance at its 50 DMA line ($40.33) since last noted on 10/29/21. Bullish action came after it reported Sep '21 quarterly earnings +46% above the year ago period. Completed a Secondary Offering on 9/13/21. Resistance remains due to overhead supply up to the $44 level.
>>> FEATURED STOCK ARTICLE : Pulled Back Finding Support Near 50-Day Moving Average - 10/11/2021 |
View all notes |
Set NEW NOTE alert |
Company Profile |
SEC
News |
Chart |
Request a new note
C
A
S
I |
MIME
-
NASDAQ
Mimecast Limited
Computer Sftwr-Security
|
$79.81
|
+2.05
2.64% |
$80.67
|
448,162
77.40% of 50 DAV
50 DAV is 579,000
|
$80.84
-1.27%
|
10/18/2021
|
$68.17
|
PP = $71.55
|
|
MB = $75.13
|
Most Recent Note - 11/10/2021 6:02:40 PM
G - Stubbornly holding its ground near its all-time high, extended from the previously noted base. Prior highs in the $71 area define initial support above its 50 DMA line ($69) .
>>> FEATURED STOCK ARTICLE : MIME Consolidating Less Than 4% Off High Building New Base - 10/21/2021 |
View all notes |
Set NEW NOTE alert |
Company Profile |
SEC
News |
Chart |
Request a new note
C
A
S
I |
ZD
-
NASDAQ
Ziff Davis Inc
Internet-Content
|
$132.52
|
+1.03
0.78% |
$133.94
|
277,580
63.96% of 50 DAV
50 DAV is 434,000
|
$135.00
-1.84%
|
10/25/2021
|
$126.07
|
PP = $128.19
|
|
MB = $134.60
|
Most Recent Note - 11/8/2021 6:12:45 PM
Y - Posted a big gain today with +46% above average volume for a close above the pivot point helping clinch a convincing technical buy signal. Quarterly and annual earnings (C and A criteria) history has been strong.
>>> FEATURED STOCK ARTICLE : Internet Content Firm Perched Near Prior High - 10/25/2021 |
View all notes |
Set NEW NOTE alert |
Company Profile |
SEC
News |
Chart |
Request a new note
C
A
S
I |