You are not logged in.
This means you
CAN ONLY VIEW reports that were published prior to Monday, March 31, 2025.
You
MUST UPGRADE YOUR MEMBERSHIP if you want to see any current reports.
AFTER MARKET UPDATE - FRIDAY, OCTOBER 22ND, 2021
Previous After Market Report Next After Market Report >>>
|
|
|
|
DOW |
+73.94 |
35,677.02 |
+0.21% |
|
Volume |
763,370,145 |
-8% |
|
Volume |
5,652,607,200 |
+18% |
|
NASDAQ |
-125.50 |
15,090.20 |
-0.82% |
|
Advancers |
1,624 |
50% |
|
Advancers |
1,940 |
43% |
|
S&P 500 |
-4.88 |
4,544.90 |
-0.11% |
|
Decliners |
1,601 |
50% |
|
Decliners |
2,539 |
57% |
|
Russell 2000 |
-4.92 |
2,291.27 |
-0.21% |
|
52 Wk Highs |
207 |
|
|
52 Wk Highs |
216 |
|
|
S&P 600 |
+0.67 |
1,381.14 |
+0.05% |
|
52 Wk Lows |
22 |
|
|
52 Wk Lows |
155 |
|
|
 |
Major Indices Ended Session Mixed but Up for the Week
Kenneth J. Gruneisen - Passed the CAN SLIM® Master's Exam
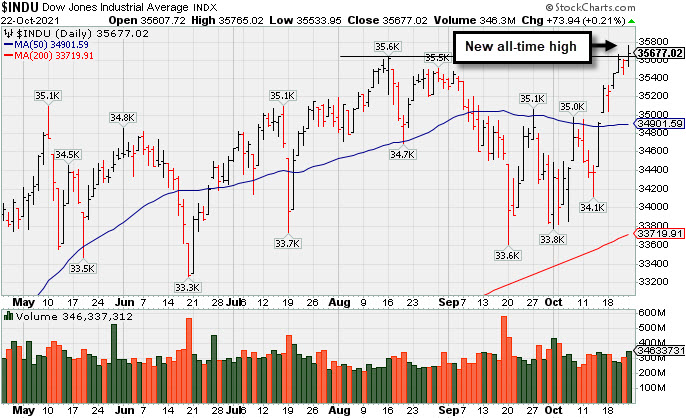
The Dow added 73 points, closing at a fresh all-time high for the first time since August 16 and capping a 1.1% weekly gain. The S&P 500 slipped 0.1% from Thursday’s record peak, trimming its five-day rally to 1.6% and snapping a seven-session win streak. The Nasdaq Composite fell 0.8% amid disappointing guidance from high-profile tech-related companies, but still ended the week 1.3% higher. The volume totals reported were mixed, lighter than the prior session on the NYSE and higher on the Nasdaq exchange. Advancers led decliners by a very narrow margin on the NYSE while decliners led advancers by a 5-4 margin on the Nasdaq exchange. There were 113 high-ranked companies from the Leaders List that hit new 52-week highs and were listed on the BreakOuts Page versus the total of 87 on the prior session. New 52-week highs totals expanded and outnumbered new 52-week lows totals on both the NYSE and the Nasdaq exchange. The major indices (M criteria) are in a confirmed uptrend. Investors are reminded to only make proper new buys as per the fundamental and technical rules of the fact-based investment system.
PICTURED: The Dow Jones Industrial Average hit a new record high.
U.S. stocks finished mixed on Friday, though all three major averages notched a third straight weekly advance, their longest winning stretch since July. Seven of 11 S&P 500 sectors ended in positive territory. Financials outperformed, helped by earnings strength from American Express (AXP +5.41%) . Communication Services lagged, with Snap Inc. (SNAP -26.59%) gapped down and violated its 200 DMA line after cautioning that its advertising business was being pressured by Apple’s (AAPL -0.53%) privacy rule changes, along with ongoing supply chain problems. The warning also dragged down shares of other social media companies including Facebook (FB -5.05%). Meanwhile, Intel (INTC -11.68%) gapped down after the chipmaker issued downbeat guidance.
Federal Reserve Chair Jerome Powell highlighted the risks of more persistent inflation, but clarified that rate hikes were not imminent despite the central bank poised to begin tapering asset purchases. Treasuries pared their recent slump, with the yield on the 10-year note down four basis points to 1.64%, having still risen seven basis points on the week. On the data front, preliminary October updates from Markit showed domestic services sector growth accelerated more than anticipated, while activity in the manufacturing sector eased slightly. In commodities, WTI crude capped a ninth consecutive weekly gain, its longest winning streak since 2015. |
 Kenneth J. Gruneisen started out as a licensed stockbroker in August 1987, a couple of months prior to the historic stock market crash that took the Dow Jones Industrial Average down -22.6% in a single day. He has published daily fact-based fundamental and technical analysis on high-ranked stocks online for two decades. Through FACTBASEDINVESTING.COM, Kenneth provides educational articles, news, market commentary, and other information regarding proven investment systems that work in good times and bad.
Comments contained in the body of this report are technical opinions only and are not necessarily those of Gruneisen Growth Corp. The material herein has been obtained from sources believed to be reliable and accurate, however, its accuracy and completeness cannot be guaranteed. Our firm, employees, and customers may effect transactions, including transactions contrary to any recommendation herein, or have positions in the securities mentioned herein or options with respect thereto. Any recommendation contained in this report may not be suitable for all investors and it is not to be deemed an offer or solicitation on our part with respect to the purchase or sale of any securities. |
|
 |
Financial Indexes Led Group Gainers
Kenneth J. Gruneisen - Passed the CAN SLIM® Master's Exam
The Broker/Dealer Index ($XBD +0.73%) and Bank Index ($BKX +1.45%) both posted gains while the Retail Index ($RLX -1.33%) lost ground. The Semiconductor Index ($SOX -1.22%) and Networking Index ($NWX -1.79%) led the tech sector lower while the Biotech Index ($BTK -0.29%) suffered a smaller loss. The Gold & Silver Index ($XAU +0.63%) and Integrated Oil Index ($XOI +0.45%) both posted modest gains while the Oil Services Index ($OSX -0.29%) edged lower.
PICTURED: The Broker/Dealer Index ($XBD +0.73%) is hitting new record highs.
| Oil Services |
$OSX |
64.42 |
-0.19 |
-0.29% |
+45.32% |
| Integrated Oil |
$XOI |
1,209.90 |
+5.40 |
+0.45% |
+52.67% |
| Semiconductor |
$SOX |
3,370.28 |
-41.77 |
-1.22% |
+20.56% |
| Networking |
$NWX |
834.29 |
-15.18 |
-1.79% |
+16.34% |
| Broker/Dealer |
$XBD |
501.82 |
+3.61 |
+0.73% |
+32.90% |
| Retail |
$RLX |
4,091.61 |
-55.35 |
-1.33% |
+14.83% |
| Gold & Silver |
$XAU |
134.34 |
+0.84 |
+0.63% |
-6.83% |
| Bank |
$BKX |
142.61 |
+2.04 |
+1.45% |
+45.66% |
| Biotech |
$BTK |
5,613.50 |
-16.27 |
-0.29% |
-2.19% |
|
|
|
 |
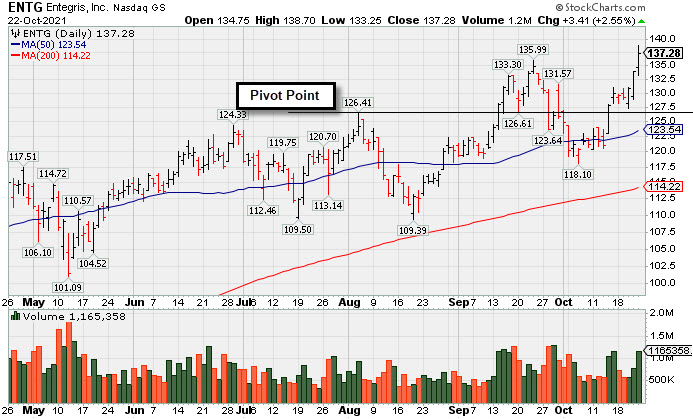
Hit New Record High With Another Volume-Driven Gain
Kenneth J. Gruneisen - Passed the CAN SLIM® Master's Exam
Entegris Inc (ENTG +$3.41 or +2.55% to $137.28) hit a new all-time high with above average volume behind today's gain. As it rose further above its "max buy" level, getting extended from the previously noted base, its color code was changed to green. On pullbacks the 50-day moving average (DMA) line ($123.54) defines initial support to watch above recent lows in the $109 area.
ENTG was highlighted in yellow with pivot point cited based on its 4/05/21 high plus 10 cents in the 8/04/21 mid-day report (read here). It has a 93 Earnings Per Share Rating and its Relative Strength Rating is 84, both above the 80+ minimum guideline for buy candidates. It was last shown in this FSU section on 9/23/21 with an annotated graph under the headline, "Hit New High and Rose Above its Max Buy Level". Jun '21 quarterly earnings rose +42% on +27% sales revenues versus the year ago period, its 5th strong quarter backed with an improving sales revenues growth rate, helping it match the +25% minimum guideline (C criteria). Annual earnings (A criteria) growth has been strong and steady.
The company hails from the ELECTRONICS - Semiconductor Equipment and Materials industry group which is currently ranked 107th on the 197 Industry Groups list (L criteria). There are 135.6 million shares outstanding (S criteria). The number of top-rated funds owning its shares rose from 617 in Mar '20 to 733 in Sep '21, a reassuring sign concerning the I criteria. It has a Timeliness Rating of C and Sponsorship Rating of B. |
|
|
Color Codes Explained :
Y - Better candidates highlighted by our
staff of experts.
G - Previously featured
in past reports as yellow but may no longer be buyable under the
guidelines.
***Last / Change / Volume data in this table is the closing quote data***
Symbol/Exchange
Company Name
Industry Group |
PRICE |
CHANGE
(%Change) |
Day High |
Volume
(% DAV)
(% 50 day avg vol) |
52 Wk Hi
% From Hi |
Featured
Date |
Price
Featured |
Pivot Featured |
|
Max Buy |
 SIVB
-
NASDAQ
SIVB
-
NASDAQ
S V B Financial Group
BANKING - Regional - Pacific Banks
|
$753.12
|
+47.98
6.80% |
$759.02
|
649,007
185.64% of 50 DAV
50 DAV is 349,600
|
$707.42
6.46%
|
8/6/2021
|
$589.70
|
PP = $608.94
|
|
MB = $639.39
|
 Most Recent Note - 10/22/2021 5:22:39 PM
G - Reported Sep '21 quarterly earnings -26% on +43% sales revenues versus the year ago period, below the +25% minimum earnings guideline (C criteria) raising fundamental concerns. Gapped up today and hit another new new all-time high with a big gain on +84% above average volume, getting very extended from the previously noted base. Its 50 DMA line ($620) and prior highs in the $608 area define important near-term support to watch on pullbacks. Completed a new Public Offering on 8/11/21.
>>> FEATURED STOCK ARTICLE : Pullback After 5 Straight Gains into New High Territory - 9/28/2021 |
View all notes |
Set NEW NOTE alert |
Company Profile |
SEC
News |
Chart |
Request a new note
C
A
S
I |
BLDR
-
NYSE
Builders Firstsource Inc
Bldg-Constr Prds/Misc
|
$58.89
|
+0.34
0.58% |
$59.56
|
1,397,723
72.16% of 50 DAV
50 DAV is 1,937,000
|
$58.90
-0.02%
|
8/12/2021
|
$52.38
|
PP = $54.09
|
|
MB = $56.79
|
Most Recent Note - 10/20/2021 5:34:35 PM
G - Color code is changed to green after it posted a quiet gain today for another new all-time high and closed above its "max buy" level. Prior highs in the $54-55 area define initial support to watch on pullbacks. Fundamentals remain strong.
>>> FEATURED STOCK ARTICLE : Sputtering After Wedging to New Highs - 10/1/2021 |
View all notes |
Set NEW NOTE alert |
Company Profile |
SEC
News |
Chart |
Request a new note
C
A
S
I |
KFRC
-
NASDAQ
Kforce Inc
Comml Svcs-Staffing
|
$65.17
|
-0.17
-0.26% |
$65.83
|
52,579
49.60% of 50 DAV
50 DAV is 106,000
|
$69.00
-5.55%
|
9/10/2021
|
$59.53
|
PP = $64.48
|
|
MB = $67.70
|
Most Recent Note - 10/21/2021 8:56:15 PM
Y - Finding support near prior highs in the $64 area after volume-driven gains. Fundamentals remain strong. It s50 DMA line defines additional near-term support to watch.
>>> FEATURED STOCK ARTICLE : Pulling Back Near Prior Highs Following Technical Breakout - 10/15/2021 |
View all notes |
Set NEW NOTE alert |
Company Profile |
SEC
News |
Chart |
Request a new note
C
A
S
I |
GNRC
-
NYSE
Generac Hldgs Inc
Electrical-Power/Equipmt
|
$470.32
|
-1.39
-0.29% |
$475.30
|
310,650
51.09% of 50 DAV
50 DAV is 608,000
|
$476.31
-1.26%
|
8/30/2021
|
$449.36
|
PP = $457.10
|
|
MB = $479.96
|
Most Recent Note - 10/21/2021 8:59:03 PM
Y - Posted a gain today with light volume for a best-ever close. Disciplined investors may watch for a gain and close above the pivot point backed by at least +40% above average volume to trigger a proper technical buy signal.
>>> FEATURED STOCK ARTICLE : Prior Lows Define Near-Term Support After 50 DMA Violation - 10/6/2021 |
View all notes |
Set NEW NOTE alert |
Company Profile |
SEC
News |
Chart |
Request a new note
C
A
S
I |
CAMT
-
NASDAQ
Camtek Ltd
ELECTRONICS - Scientific and Technical Instrum
|
$39.26
|
-0.01
-0.03% |
$39.78
|
63,612
41.85% of 50 DAV
50 DAV is 152,000
|
$46.01
-14.67%
|
8/4/2021
|
$39.67
|
PP = $40.57
|
|
MB = $42.60
|
Most Recent Note - 10/21/2021 8:53:53 PM
G - Volume totals have been cooling while still sputtering below its 50 DMA line ($40.17), meeting resistance at that important short-term average. The prior low ($34.68 on 8/17/21) defines the next important near-term support to watch. A rebound above the 50 DMA line is needed for its outlook to improve. Fundamentals remain strong.
>>> FEATURED STOCK ARTICLE : Fell Below Prior High and Violated 50-Day Moving Average - 10/5/2021 |
View all notes |
Set NEW NOTE alert |
Company Profile |
SEC
News |
Chart |
Request a new note
C
A
S
I |
Symbol/Exchange
Company Name
Industry Group |
PRICE |
CHANGE
(%Change) |
Day High |
Volume
(% DAV)
(% 50 day avg vol) |
52 Wk Hi
% From Hi |
Featured
Date |
Price
Featured |
Pivot Featured |
|
Max Buy |
PKI
-
NYSE
Perkinelmer Inc
ELECTRONICS - Scientific and Technical Instrum
|
$176.38
|
-0.12
-0.07% |
$178.06
|
300,405
47.91% of 50 DAV
50 DAV is 627,000
|
$192.00
-8.14%
|
8/18/2021
|
$181.07
|
PP = $188.50
|
|
MB = $197.93
|
Most Recent Note - 10/20/2021 5:39:46 PM
G - Posted a 6th consecutive gain with below average volume. A rebound above the 50 DMA line ($180) is needed for its outlook to improve. Its Relative Strength Rating improved to 81, one notch above the 80+ minimum guideline for buy candidates. Fundamentals remain strong. See the latest FSU analysis for more details and an annotated graph.
>>> FEATURED STOCK ARTICLE : Rebound Above 50 DMA Line Needed to Help Outlook Improve - 10/19/2021 |
View all notes |
Set NEW NOTE alert |
Company Profile |
SEC
News |
Chart |
Request a new note
C
A
S
I |
UMC
-
NYSE
United Microelectrnc Adr
ELECTRONICS - Semiconductor - Integrated Cir
|
$10.25
|
-0.12
-1.16% |
$10.42
|
6,074,557
84.38% of 50 DAV
50 DAV is 7,199,000
|
$12.62
-18.78%
|
8/5/2021
|
$11.62
|
PP = $11.38
|
|
MB = $11.95
|
Most Recent Note - 10/19/2021 5:29:38 PM
G - Holding its ground above its 200 DMA line ($9.86). A rebound above the 50 DMA line ($11.17) is needed for its outlook to improve.
>>> FEATURED STOCK ARTICLE : Consolidating Above 50-day Moving Average Near "Max Buy" Level - 9/27/2021 |
View all notes |
Set NEW NOTE alert |
Company Profile |
SEC
News |
Chart |
Request a new note
C
A
S
I |
BRKS
-
NASDAQ
Brooks Automation
ELECTRONICS - Semiconductor Equipment and Mate
|
$108.61
|
+1.39
1.30% |
$109.62
|
370,244
63.18% of 50 DAV
50 DAV is 586,000
|
$110.40
-1.62%
|
9/20/2021
|
$101.21
|
PP = $108.82
|
|
MB = $114.26
|
Most Recent Note - 10/20/2021 5:28:10 PM
Y - Posted a 5th consecutive gain today with lighter than average volume. Still perched within striking distance of its 52-week high. Pivot point cited was based on its 4/27/21 high plus 10 cents. Subsequent gains above the pivot point or prior highs backed by at least 40% above average volume may trigger a convincing technical buy signal. See the latest FSU analysis for more details and a new annotated graph.
>>> FEATURED STOCK ARTICLE : 5th Quiet Gain Has Brooks Perched Near Prior Highs - 10/20/2021 |
View all notes |
Set NEW NOTE alert |
Company Profile |
SEC
News |
Chart |
Request a new note
C
A
S
I |
ENTG
-
NASDAQ
Entegris Inc
ELECTRONICS - Semiconductor Equipment and Mate
|
$137.28
|
+3.41
2.55% |
$138.70
|
1,165,358
162.76% of 50 DAV
50 DAV is 716,000
|
$135.99
0.95%
|
8/4/2021
|
$125.33
|
PP = $126.51
|
|
MB = $132.84
|
Most Recent Note - 10/22/2021 5:17:33 PM
G - Color code was changed to green while rising well above its "max buy" level and hitting a new 52-week high with today's 3rd consecutive gain. Found support near its 50 DMA line ($123.54) after damaging losses. Its prior low and 200 DMA line define the next important support in the $109 area. See the latest FSU for more details and a new annotated graph.
>>> FEATURED STOCK ARTICLE : Hit New Record High With Another Volume-Driven Gain - 10/22/2021 |
View all notes |
Set NEW NOTE alert |
Company Profile |
SEC
News |
Chart |
Request a new note
C
A
S
I |
CLFD
-
NASDAQ
Clearfield Inc
TELECOMMUNICATIONS - Cables / Satalite Equipment
|
$51.04
|
-1.07
-2.05% |
$52.02
|
91,052
112.41% of 50 DAV
50 DAV is 81,000
|
$54.49
-6.33%
|
7/23/2021
|
$40.23
|
PP = $43.74
|
|
MB = $45.93
|
Most Recent Note - 10/18/2021 5:33:33 PM
G - Perched at its 52-week high, extended from the previously noted base. Prior highs in the $46 area define near-term support along with its 50 DMA line ($45.56) where damaging losses may trigger technical sell signals. Fundamentals remain strong. See the latest FSU analysis for more details and a new annotated graph.
>>> FEATURED STOCK ARTICLE : Extended From Prior Base After Latest Rally - 10/18/2021 |
View all notes |
Set NEW NOTE alert |
Company Profile |
SEC
News |
Chart |
Request a new note
C
A
S
I |
Symbol/Exchange
Company Name
Industry Group |
PRICE |
CHANGE
(%Change) |
Day High |
Volume
(% DAV)
(% 50 day avg vol) |
52 Wk Hi
% From Hi |
Featured
Date |
Price
Featured |
Pivot Featured |
|
Max Buy |
TGH
-
NYSE
Textainer Group Holdings
TRANSPORTATION - Logistics
|
$36.93
|
-0.25
-0.67% |
$37.37
|
672,109
155.22% of 50 DAV
50 DAV is 433,000
|
$38.84
-4.92%
|
10/7/2021
|
$36.97
|
PP = $36.80
|
|
MB = $38.64
|
Most Recent Note - 10/20/2021 5:38:30 PM
Y - Posted a gain today with near average volume for a best-ever close. Its 50 DMA line ($34.38) defines important near-term support to watch above recent lows in the $30-31 area. Fundamentals remain strong.
>>> FEATURED STOCK ARTICLE : Perched Near High With Strong Fundamentals - 10/7/2021 |
View all notes |
Set NEW NOTE alert |
Company Profile |
SEC
News |
Chart |
Request a new note
C
A
S
I |
SMPL
-
NASDAQ
Simply Good Foods Co
Food-Confectionery
|
$37.27
|
+2.96
8.63% |
$37.36
|
1,025,828
320.77% of 50 DAV
50 DAV is 319,800
|
$38.50
-3.19%
|
12/28/2020
|
$30.40
|
PP = $31.44
|
|
MB = $33.01
|
Most Recent Note - 10/22/2021 12:55:24 PM
G - Rallying above its 50 DMA line with today's big volume-driven gain helping its outlook improve. Reported Aug '21 quarterly earnings +45% on +17% sales revenues versus the year ago period. Volume and volatility often increase near earnings news. Its Relative Strength Rating slumped to 72 while sputtering near its 200 DMA line ($33.57) and recent low ($33.55 on 9/20/21). Any damaging losses would trigger technical sell signals and raise greater concerns.
>>> FEATURED STOCK ARTICLE : Consolidating Just Above 50-Day Moving Average Line - 10/12/2021 |
View all notes |
Set NEW NOTE alert |
Company Profile |
SEC
News |
Chart |
Request a new note
C
A
S
I |
WDAY
-
NYSE
Workday Inc Cl A
Computer Sftwr-Enterprse
|
$280.79
|
-0.22
-0.08% |
$284.80
|
1,032,539
67.03% of 50 DAV
50 DAV is 1,540,400
|
$282.77
-0.70%
|
9/7/2021
|
$275.69
|
PP = $282.87
|
|
MB = $297.01
|
Most Recent Note - 10/19/2021 5:28:24 PM
Y - Posted another gain today with below average volume while challenging prior highs. Very little resistance remains due to overhead supply. Its 50 DMA line ($258).and recent lows ($246) define near-term support to watch where violations would raise concerns. Fundamentals remain strong.
>>> FEATURED STOCK ARTICLE : Rebounding From 50-Day Moving Average Toward Prior Highs - 10/13/2021 |
View all notes |
Set NEW NOTE alert |
Company Profile |
SEC
News |
Chart |
Request a new note
C
A
S
I |
CTLT
-
NYSE
"Catalent, Inc"
DRUGS - Biotechnology
|
$132.73
|
+0.42
0.32% |
$133.00
|
487,137
55.09% of 50 DAV
50 DAV is 884,200
|
$142.64
-6.95%
|
8/25/2021
|
$128.72
|
PP = $127.78
|
|
MB = $134.17
|
Most Recent Note - 10/18/2021 5:35:13 PM
Y - Posted a gain today but remains below Its 50 DMA line ($131) which may act as resistance. Prior highs in the $124-127 area which define the next important near-term support to watch. Fundamentals remain strong.
>>> FEATURED STOCK ARTICLE : Found Support Near Prior High While Consolidating - 10/8/2021 |
View all notes |
Set NEW NOTE alert |
Company Profile |
SEC
News |
Chart |
Request a new note
C
A
S
I |
MEDP
-
NASDAQ
Medpace Holdings Inc
Medical-Research Eqp/Svc
|
$187.04
|
+1.01
0.54% |
$188.97
|
99,449
61.54% of 50 DAV
50 DAV is 161,600
|
$199.04
-6.03%
|
9/10/2021
|
$196.32
|
PP = $196.22
|
|
MB = $206.03
|
Most Recent Note - 10/20/2021 5:35:54 PM
Y - Perched near its 52-week high, still finding support near its 50 DMA line ($186). More damaging losses would raise concerns. Pivot point cited was based on its 4/26/21 high plus 10 cents. Subsequent gains and strong close above the pivot point backed by at least +40% above average volume may trigger a technical buy signal.
>>> FEATURED STOCK ARTICLE : Found Prompt Support Near 50-Day Moving Average Line - 10/14/2021 |
View all notes |
Set NEW NOTE alert |
Company Profile |
SEC
News |
Chart |
Request a new note
C
A
S
I |
Symbol/Exchange
Company Name
Industry Group |
PRICE |
CHANGE
(%Change) |
Day High |
Volume
(% DAV)
(% 50 day avg vol) |
52 Wk Hi
% From Hi |
Featured
Date |
Price
Featured |
Pivot Featured |
|
Max Buy |
JEF
-
NYSE
Jefferies Financial Grp
Finance-Invest Bnk/Bkrs
|
$42.77
|
+0.41
0.97% |
$42.85
|
1,575,946
86.69% of 50 DAV
50 DAV is 1,818,000
|
$42.55
0.52%
|
6/28/2021
|
$31.81
|
PP = $34.42
|
|
MB = $36.14
|
Most Recent Note - 10/18/2021 5:38:11 PM
G - Posted a 12th consecutive gain today for another new all-time high. Its 50 DMA line ($37) defines important near-term support to watch on pullbacks. Reported Aug '21 quarterly earnings +713% on +70% sales revenues versus the year ago period.
>>> FEATURED STOCK ARTICLE : Perched at 52-week High With Earnings News Due - 9/29/2021 |
View all notes |
Set NEW NOTE alert |
Company Profile |
SEC
News |
Chart |
Request a new note
C
A
S
I |
AVTR
-
NYSE
Avantor Inc
Medical-Research Eqp/Svc
|
$38.42
|
-0.35
-0.90% |
$38.85
|
3,780,201
97.70% of 50 DAV
50 DAV is 3,869,000
|
$44.37
-13.41%
|
6/10/2021
|
$32.94
|
PP = $34.09
|
|
MB = $35.79
|
Most Recent Note - 10/21/2021 12:45:43 PM
G - Still sputtering below its 50 DMA line ($40.39) and below the prior low ($39.24 on 10/01/21) after damaging volume-driven losses triggering technical sell signals. A rebound above the 50 DMA line is needed for its outlook to improve. Completed a Secondary Offering on 9/13/21 while perched at its all-time high, very extended from any sound base.
>>> FEATURED STOCK ARTICLE : Pulled Back Finding Support Near 50-Day Moving Average - 10/11/2021 |
View all notes |
Set NEW NOTE alert |
Company Profile |
SEC
News |
Chart |
Request a new note
C
A
S
I |
MIME
-
NASDAQ
Mimecast Limited
Computer Sftwr-Security
|
$68.87
|
+0.22
0.32% |
$68.97
|
345,773
37.26% of 50 DAV
50 DAV is 928,000
|
$71.45
-3.61%
|
10/18/2021
|
$68.17
|
PP = $71.55
|
|
MB = $75.13
|
Most Recent Note - 10/21/2021 8:52:26 PM
Y - Volume totals have been cooling while consolidating above its 50 DMA line ($65.45) and perched less that -4% from its all-time high. Fundamentals remain strong. Color code was changed to yellow with new pivot point cited based on its 9/03/21 high plus 10 cents. See the latest FSU analysis for more details and a new annotated graph.
>>> FEATURED STOCK ARTICLE : MIME Consolidating Less Than 4% Off High Building New Base - 10/21/2021 |
View all notes |
Set NEW NOTE alert |
Company Profile |
SEC
News |
Chart |
Request a new note
C
A
S
I |
|
|
|
THESE ARE NOT BUY RECOMMENDATIONS!
Comments contained in the body of this report are technical
opinions only. The material herein has been obtained
from sources believed to be reliable and accurate, however,
its accuracy and completeness cannot be guaranteed.
This site is not an investment advisor, hence it does
not endorse or recommend any securities or other investments.
Any recommendation contained in this report may not
be suitable for all investors and it is not to be deemed
an offer or solicitation on our part with respect to
the purchase or sale of any securities. All trademarks,
service marks and trade names appearing in this report
are the property of their respective owners, and are
likewise used for identification purposes only.
This report is a service available
only to active Paid Premium Members.
You may opt-out of receiving report notifications
at any time. Questions or comments may be submitted
by writing to Premium Membership Services 665 S.E. 10 Street, Suite 201 Deerfield Beach, FL 33441-5634 or by calling 1-800-965-8307
or 954-785-1121.
|
|
|