You are not logged in.
This means you
CAN ONLY VIEW reports that were published prior to Friday, April 18, 2025.
You
MUST UPGRADE YOUR MEMBERSHIP if you want to see any current reports.
AFTER MARKET UPDATE - MONDAY, OCTOBER 25TH, 2021
Previous After Market Report Next After Market Report >>>
|
|
|
|
DOW |
+64.13 |
35,741.15 |
+0.18% |
|
Volume |
805,512,314 |
+6% |
|
Volume |
5,599,987,200 |
-1% |
|
NASDAQ |
+136.51 |
15,226.71 |
+0.90% |
|
Advancers |
2,077 |
63% |
|
Advancers |
2,855 |
63% |
|
S&P 500 |
+21.58 |
4,566.48 |
+0.47% |
|
Decliners |
1,219 |
37% |
|
Decliners |
1,651 |
37% |
|
Russell 2000 |
+21.37 |
2,312.64 |
+0.93% |
|
52 Wk Highs |
212 |
|
|
52 Wk Highs |
255 |
|
|
S&P 600 |
+11.73 |
1,392.87 |
+0.85% |
|
52 Wk Lows |
25 |
|
|
52 Wk Lows |
88 |
|
|
 |
Major Indices Extend Record Rally With Hearty Leadership
Kenneth J. Gruneisen - Passed the CAN SLIM® Master's Exam
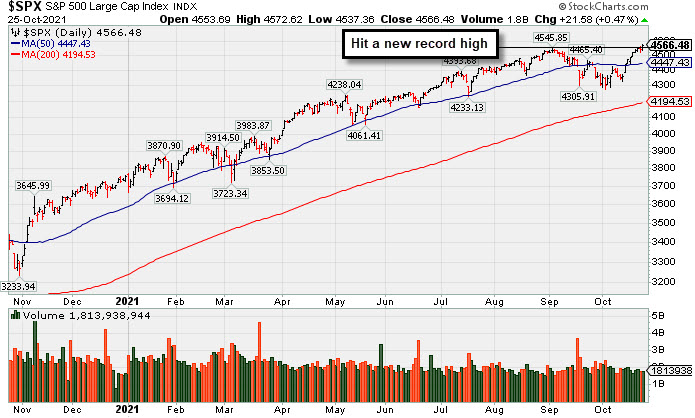
The Dow added 64 points, while the S&P 500 climbed 0.5%, with both benchmarks notching fresh record levels. The Nasdaq Composite rose 0.9%, closing within 1% of its September 7 all-time high. The volume totals reported were mixed, higher than the prior session on the NYSE and lighter on the Nasdaq exchange. Advancers led decliners by a 5-3 margin on the NYSE and by a 7-4 margin on the Nasdaq exchange. There were 115 high-ranked companies from the Leaders List that hit new 52-week highs and were listed on the BreakOuts Page versus the total of 113 on the prior session. New 52-week highs totals expanded and outnumbered new 52-week lows totals on both the NYSE and the Nasdaq exchange. The major indices (M criteria) are in a confirmed uptrend. Investors are reminded to only make proper new buys as per the fundamental and technical rules of the fact-based investment system.
PICTURED: The S&P 500 Index hit a new record high.
U.S. stocks ended higher on Monday as Wall Street awaited a jam-packed week of corporate earnings. Some of the world’s largest companies will headline the slate, including every member of the oft-cited ”FAANG” complex. All three major averages came off a third straight weekly gain, their longest winning stretch since July.
Nine of 11 S&P 500 sectors closed in positive territory, with Utilities and Financials the lone laggards. The Consumer Discretionary group paced the gains, with Tesla (TSLA +12.66%) hitting a new record high. The electric car maker settled above the $1 trillion market cap level for the first time on reports Hertz Global Holdings ordered 100,000 of their vehicles. Meanwhile, PayPal (PYPL +2.70%) rose after stating the company did not intend to acquire social media company Pinterest (PINS -12.71%). In earnings, Kimberly-Clark (KMB -2.20%) fell following disappointing guidance, pressured by rising costs and supply chain bottlenecks.
Treasuries were mixed, with the yield on the 10-year note down one basis point to 1.63% after last week climbing as high as 1.70%, a peak not seen since March amid rising inflationary worries. On the data front, a release from the Dallas Fed revealed manufacturing activity in the region grew more than anticipated in October. Separately, the Chicago Fed national activity index unexpectedly fell into negative territory in September. In commodities, WTI crude reversed earlier gains, easing 0.4% to $83.47/barrel after briefly trading above $85/barrel for the first time since 2014. |
 Kenneth J. Gruneisen started out as a licensed stockbroker in August 1987, a couple of months prior to the historic stock market crash that took the Dow Jones Industrial Average down -22.6% in a single day. He has published daily fact-based fundamental and technical analysis on high-ranked stocks online for two decades. Through FACTBASEDINVESTING.COM, Kenneth provides educational articles, news, market commentary, and other information regarding proven investment systems that work in good times and bad.
Comments contained in the body of this report are technical opinions only and are not necessarily those of Gruneisen Growth Corp. The material herein has been obtained from sources believed to be reliable and accurate, however, its accuracy and completeness cannot be guaranteed. Our firm, employees, and customers may effect transactions, including transactions contrary to any recommendation herein, or have positions in the securities mentioned herein or options with respect thereto. Any recommendation contained in this report may not be suitable for all investors and it is not to be deemed an offer or solicitation on our part with respect to the purchase or sale of any securities. |
|
 |
Commodity-Linked Groups Led Tech and Other Groups Higher
Kenneth J. Gruneisen - Passed the CAN SLIM® Master's Exam
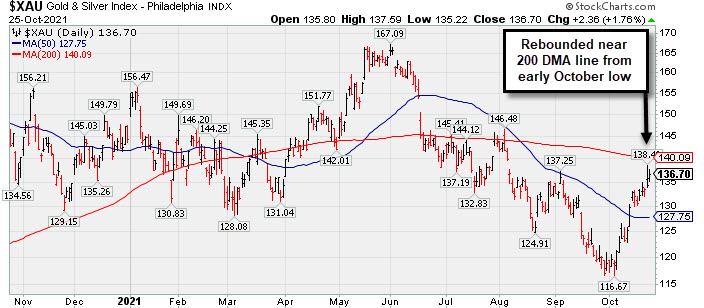
The Retail Index ($RLX +0.31%) and Broker/Dealer Index ($XBD +0.35%) both posted small gains while the Bank Index ($BKX -0.33%) edged lower. The Biotech Index ($BTK +0.89%) and Semiconductor Index ($SOX +0.66%) both posted gains but the Networking Index ($NWX -1.12%) lost ground. Commodity-linked groups had a positive bias as the Gold & Silver Index ($XAU +1.76%), Oil Services Index ($OSX +0.92%), and Integrated Oil Index ($XOI +1.31%) posted unanimous gains.
PICTURED: The Gold & Silver Index ($XAU +1.76%) has rebounded near its 200-day moving average (DMA) line from its early October low.
| Oil Services |
$OSX |
65.01 |
+0.59 |
+0.92% |
+46.65% |
| Integrated Oil |
$XOI |
1,225.74 |
+15.84 |
+1.31% |
+54.67% |
| Semiconductor |
$SOX |
3,392.39 |
+22.11 |
+0.66% |
+21.35% |
| Networking |
$NWX |
824.99 |
-9.30 |
-1.12% |
+15.04% |
| Broker/Dealer |
$XBD |
503.57 |
+1.75 |
+0.35% |
+33.36% |
| Retail |
$RLX |
4,104.45 |
+12.84 |
+0.31% |
+15.19% |
| Gold & Silver |
$XAU |
136.70 |
+2.36 |
+1.76% |
-5.19% |
| Bank |
$BKX |
142.14 |
-0.48 |
-0.33% |
+45.17% |
| Biotech |
$BTK |
5,663.69 |
+50.19 |
+0.89% |
-1.31% |
|
|
|
 |
Internet Content Firm Perched Near Prior High
Kenneth J. Gruneisen - Passed the CAN SLIM® Master's Exam
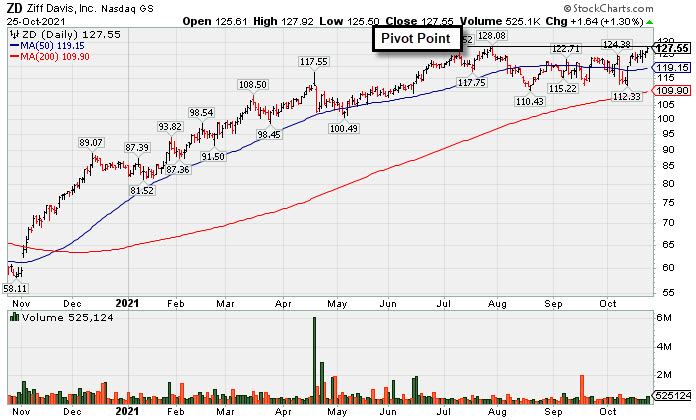
Ziff Davis Inc (ZD +$1.64 or +1.30% to $127.55) is perched within close striking distance of its 52-week high after today's 5th consecutive gain. Its color code was changed to yellow with pivot point cited based on its 7/29/21 high plus 10 cents when highlighted in the earlier mid-day report (read here). A subsequent solid gain and close above the pivot point backed by at least +40% above average volume may trigger a technical buy signal.
It has an Earnings Per Share Rating of 91. Its past 3 quarterly comparisons through Jun '21 versus the year ago periods had earnings increases above the +25% minimum guideline and its annual earnings (C and A criteria) history has been strong. Recent quarterly comparisons also showed encouraging acceleration in its sales revenues growth rate.
The high ranked Internet-Content firm has only 48.2 million shares outstanding (S criteria), which can contribute to greater volatility in the event of institutional buying or selling. The number of top-rated funds owning its shares rose from 631 in Dec '20 to 731 in Sep '21, a reassuring sign concerning the I criteria. It has a Timeliness Rating of B and Sponsorship Rating of C. |
|
|
Color Codes Explained :
Y - Better candidates highlighted by our
staff of experts.
G - Previously featured
in past reports as yellow but may no longer be buyable under the
guidelines.
***Last / Change / Volume data in this table is the closing quote data***
Symbol/Exchange
Company Name
Industry Group |
PRICE |
CHANGE
(%Change) |
Day High |
Volume
(% DAV)
(% 50 day avg vol) |
52 Wk Hi
% From Hi |
Featured
Date |
Price
Featured |
Pivot Featured |
|
Max Buy |
 SIVB
-
NASDAQ
SIVB
-
NASDAQ
S V B Financial Group
BANKING - Regional - Pacific Banks
|
$746.01
|
-7.11
-0.94% |
$757.66
|
259,516
73.73% of 50 DAV
50 DAV is 352,000
|
$759.02
-1.71%
|
8/6/2021
|
$589.70
|
PP = $608.94
|
|
MB = $639.39
|
Most Recent Note - 10/22/2021 5:22:39 PM
G - Reported Sep '21 quarterly earnings -26% on +43% sales revenues versus the year ago period, below the +25% minimum earnings guideline (C criteria) raising fundamental concerns. Gapped up today and hit another new new all-time high with a big gain on +84% above average volume, getting very extended from the previously noted base. Its 50 DMA line ($620) and prior highs in the $608 area define important near-term support to watch on pullbacks. Completed a new Public Offering on 8/11/21.
>>> FEATURED STOCK ARTICLE : Pullback After 5 Straight Gains into New High Territory - 9/28/2021 |
View all notes |
Set NEW NOTE alert |
Company Profile |
SEC
News |
Chart |
Request a new note
C
A
S
I |
BLDR
-
NYSE
Builders Firstsource Inc
Bldg-Constr Prds/Misc
|
$60.14
|
+1.25
2.12% |
$60.18
|
1,842,079
98.19% of 50 DAV
50 DAV is 1,876,000
|
$59.56
0.97%
|
8/12/2021
|
$52.38
|
PP = $54.09
|
|
MB = $56.79
|
Most Recent Note - 10/20/2021 5:34:35 PM
G - Color code is changed to green after it posted a quiet gain today for another new all-time high and closed above its "max buy" level. Prior highs in the $54-55 area define initial support to watch on pullbacks. Fundamentals remain strong.
>>> FEATURED STOCK ARTICLE : Sputtering After Wedging to New Highs - 10/1/2021 |
View all notes |
Set NEW NOTE alert |
Company Profile |
SEC
News |
Chart |
Request a new note
C
A
S
I |
KFRC
-
NASDAQ
Kforce Inc
Comml Svcs-Staffing
|
$65.10
|
-0.07
-0.11% |
$65.63
|
52,184
49.70% of 50 DAV
50 DAV is 105,000
|
$69.00
-5.65%
|
9/10/2021
|
$59.53
|
PP = $64.48
|
|
MB = $67.70
|
Most Recent Note - 10/21/2021 8:56:15 PM
Y - Finding support near prior highs in the $64 area after volume-driven gains. Fundamentals remain strong. It s50 DMA line defines additional near-term support to watch.
>>> FEATURED STOCK ARTICLE : Pulling Back Near Prior Highs Following Technical Breakout - 10/15/2021 |
View all notes |
Set NEW NOTE alert |
Company Profile |
SEC
News |
Chart |
Request a new note
C
A
S
I |
GNRC
-
NYSE
Generac Hldgs Inc
Electrical-Power/Equipmt
|
$470.12
|
-0.20
-0.04% |
$475.56
|
627,484
104.41% of 50 DAV
50 DAV is 601,000
|
$476.31
-1.30%
|
8/30/2021
|
$449.36
|
PP = $457.10
|
|
MB = $479.96
|
Most Recent Note - 10/21/2021 8:59:03 PM
Y - Posted a gain today with light volume for a best-ever close. Disciplined investors may watch for a gain and close above the pivot point backed by at least +40% above average volume to trigger a proper technical buy signal.
>>> FEATURED STOCK ARTICLE : Prior Lows Define Near-Term Support After 50 DMA Violation - 10/6/2021 |
View all notes |
Set NEW NOTE alert |
Company Profile |
SEC
News |
Chart |
Request a new note
C
A
S
I |
CAMT
-
NASDAQ
Camtek Ltd
ELECTRONICS - Scientific and Technical Instrum
|
$40.09
|
+0.83
2.11% |
$40.67
|
145,920
97.28% of 50 DAV
50 DAV is 150,000
|
$46.01
-12.87%
|
8/4/2021
|
$39.67
|
PP = $40.57
|
|
MB = $42.60
|
Most Recent Note - 10/21/2021 8:53:53 PM
G - Volume totals have been cooling while still sputtering below its 50 DMA line ($40.17), meeting resistance at that important short-term average. The prior low ($34.68 on 8/17/21) defines the next important near-term support to watch. A rebound above the 50 DMA line is needed for its outlook to improve. Fundamentals remain strong.
>>> FEATURED STOCK ARTICLE : Fell Below Prior High and Violated 50-Day Moving Average - 10/5/2021 |
View all notes |
Set NEW NOTE alert |
Company Profile |
SEC
News |
Chart |
Request a new note
C
A
S
I |
Symbol/Exchange
Company Name
Industry Group |
PRICE |
CHANGE
(%Change) |
Day High |
Volume
(% DAV)
(% 50 day avg vol) |
52 Wk Hi
% From Hi |
Featured
Date |
Price
Featured |
Pivot Featured |
|
Max Buy |
PKI
-
NYSE
Perkinelmer Inc
ELECTRONICS - Scientific and Technical Instrum
|
$177.19
|
+0.81
0.46% |
$179.05
|
442,731
71.42% of 50 DAV
50 DAV is 619,900
|
$192.00
-7.71%
|
8/18/2021
|
$181.07
|
PP = $188.50
|
|
MB = $197.93
|
Most Recent Note - 10/20/2021 5:39:46 PM
G - Posted a 6th consecutive gain with below average volume. A rebound above the 50 DMA line ($180) is needed for its outlook to improve. Its Relative Strength Rating improved to 81, one notch above the 80+ minimum guideline for buy candidates. Fundamentals remain strong. See the latest FSU analysis for more details and an annotated graph.
>>> FEATURED STOCK ARTICLE : Rebound Above 50 DMA Line Needed to Help Outlook Improve - 10/19/2021 |
View all notes |
Set NEW NOTE alert |
Company Profile |
SEC
News |
Chart |
Request a new note
C
A
S
I |
UMC
-
NYSE
United Microelectrnc Adr
ELECTRONICS - Semiconductor - Integrated Cir
|
$10.48
|
+0.23
2.24% |
$10.57
|
8,153,256
112.39% of 50 DAV
50 DAV is 7,254,500
|
$12.62
-16.96%
|
8/5/2021
|
$11.62
|
PP = $11.38
|
|
MB = $11.95
|
 Most Recent Note - 10/25/2021 5:12:32 PM
G - Due to report Sep '21 quarterly results on 10/27/21. Holding its ground above its 200 DMA line ($9.89). A rebound above the 50 DMA line ($11.17) is needed for its outlook to improve.
>>> FEATURED STOCK ARTICLE : Consolidating Above 50-day Moving Average Near "Max Buy" Level - 9/27/2021 |
View all notes |
Set NEW NOTE alert |
Company Profile |
SEC
News |
Chart |
Request a new note
C
A
S
I |
BRKS
-
NASDAQ
Brooks Automation
ELECTRONICS - Semiconductor Equipment and Mate
|
$109.83
|
+1.22
1.12% |
$110.36
|
653,256
111.86% of 50 DAV
50 DAV is 584,000
|
$110.40
-0.52%
|
9/20/2021
|
$101.21
|
PP = $108.82
|
|
MB = $114.26
|
Most Recent Note - 10/20/2021 5:28:10 PM
Y - Posted a 5th consecutive gain today with lighter than average volume. Still perched within striking distance of its 52-week high. Pivot point cited was based on its 4/27/21 high plus 10 cents. Subsequent gains above the pivot point or prior highs backed by at least 40% above average volume may trigger a convincing technical buy signal. See the latest FSU analysis for more details and a new annotated graph.
>>> FEATURED STOCK ARTICLE : 5th Quiet Gain Has Brooks Perched Near Prior Highs - 10/20/2021 |
View all notes |
Set NEW NOTE alert |
Company Profile |
SEC
News |
Chart |
Request a new note
C
A
S
I |
ENTG
-
NASDAQ
Entegris Inc
ELECTRONICS - Semiconductor Equipment and Mate
|
$136.13
|
-1.15
-0.84% |
$137.98
|
1,230,367
170.88% of 50 DAV
50 DAV is 720,000
|
$138.70
-1.85%
|
8/4/2021
|
$125.33
|
PP = $126.51
|
|
MB = $132.84
|
Most Recent Note - 10/22/2021 5:17:33 PM
G - Color code was changed to green while rising well above its "max buy" level and hitting a new 52-week high with today's 3rd consecutive gain. Found support near its 50 DMA line ($123.54) after damaging losses. Its prior low and 200 DMA line define the next important support in the $109 area. See the latest FSU for more details and a new annotated graph.
>>> FEATURED STOCK ARTICLE : Hit New Record High With Another Volume-Driven Gain - 10/22/2021 |
View all notes |
Set NEW NOTE alert |
Company Profile |
SEC
News |
Chart |
Request a new note
C
A
S
I |
CLFD
-
NASDAQ
Clearfield Inc
TELECOMMUNICATIONS - Cables / Satalite Equipment
|
$50.93
|
-0.11
-0.22% |
$51.89
|
68,829
83.94% of 50 DAV
50 DAV is 82,000
|
$54.49
-6.53%
|
7/23/2021
|
$40.23
|
PP = $43.74
|
|
MB = $45.93
|
Most Recent Note - 10/25/2021 5:07:25 PM
G - Still perched near its 52-week high after today's 4th consecutive small loss. It is extended from the previously noted base. Prior highs in the $46 area define near-term support along with its 50 DMA line ($46.55) where damaging losses may trigger technical sell signals. Due to report Sep '21 quarterly results on 11/04/21.
>>> FEATURED STOCK ARTICLE : Extended From Prior Base After Latest Rally - 10/18/2021 |
View all notes |
Set NEW NOTE alert |
Company Profile |
SEC
News |
Chart |
Request a new note
C
A
S
I |
Symbol/Exchange
Company Name
Industry Group |
PRICE |
CHANGE
(%Change) |
Day High |
Volume
(% DAV)
(% 50 day avg vol) |
52 Wk Hi
% From Hi |
Featured
Date |
Price
Featured |
Pivot Featured |
|
Max Buy |
TGH
-
NYSE
Textainer Group Holdings
TRANSPORTATION - Logistics
|
$39.46
|
+2.53
6.85% |
$39.73
|
923,665
213.81% of 50 DAV
50 DAV is 432,000
|
$38.84
1.60%
|
10/7/2021
|
$36.97
|
PP = $36.80
|
|
MB = $38.64
|
Most Recent Note - 10/25/2021 1:05:55 PM
Y - Hitting another new 52-week high and trading near its "max buy" level with today's big gain backed by above average volume. Its 50 DMA line ($34.46) defines important near-term support to watch. Fundamentals remain strong.
>>> FEATURED STOCK ARTICLE : Perched Near High With Strong Fundamentals - 10/7/2021 |
View all notes |
Set NEW NOTE alert |
Company Profile |
SEC
News |
Chart |
Request a new note
C
A
S
I |
SMPL
-
NASDAQ
Simply Good Foods Co
Food-Confectionery
|
$38.82
|
+1.55
4.16% |
$39.45
|
1,164,080
347.49% of 50 DAV
50 DAV is 335,000
|
$38.50
0.83%
|
10/25/2021
|
$38.30
|
PP = $38.60
|
|
MB = $40.53
|
Most Recent Note - 10/25/2021 12:58:03 PM
Y - Hitting a new 52-week high with today's gap up and volume-driven gain. Color code is changed to yellow with new pivot point cited based on its 7/01/21 high plus 10 cents. A gain and strong close above its pivot point backed by at least +40% above average volume may trigger a new (or add-on) technical buy signal. Rallied above its 50 DMA line with a big volume-driven gain on the prior session helping its outlook improve. Bullish action came after it reported Aug '21 quarterly earnings +45% on +17% sales revenues versus the year ago period. Volume and volatility often increase near earnings news. Its Relative Strength Rating has improved to 82. Found support above its 200 DMA line ($33.62) and recent low ($33.55 on 9/20/21).
>>> FEATURED STOCK ARTICLE : Consolidating Just Above 50-Day Moving Average Line - 10/12/2021 |
View all notes |
Set NEW NOTE alert |
Company Profile |
SEC
News |
Chart |
Request a new note
C
A
S
I |
WDAY
-
NYSE
Workday Inc Cl A
Computer Sftwr-Enterprse
|
$282.15
|
+1.36
0.48% |
$284.60
|
1,517,706
98.43% of 50 DAV
50 DAV is 1,541,900
|
$284.80
-0.93%
|
9/7/2021
|
$275.69
|
PP = $282.87
|
|
MB = $297.01
|
Most Recent Note - 10/25/2021 5:14:24 PM
Y - Posted a gain today with average volume for a best-ever close and no resistance remains due to overhead supply. Its 50 DMA line ($261.82).defines near-term support to watch where a violation would raise concerns. Fundamentals remain strong.
>>> FEATURED STOCK ARTICLE : Rebounding From 50-Day Moving Average Toward Prior Highs - 10/13/2021 |
View all notes |
Set NEW NOTE alert |
Company Profile |
SEC
News |
Chart |
Request a new note
C
A
S
I |
CTLT
-
NYSE
"Catalent, Inc"
DRUGS - Biotechnology
|
$130.89
|
-1.84
-1.39% |
$133.27
|
730,892
82.53% of 50 DAV
50 DAV is 885,600
|
$142.64
-8.24%
|
8/25/2021
|
$128.72
|
PP = $127.78
|
|
MB = $134.17
|
Most Recent Note - 10/25/2021 5:09:01 PM
Y - Closed below Its 50 DMA line ($132) which may act as resistance. Prior highs in the $124-127 area which define the next important near-term support to watch. Fundamentals remain strong. Due to report Sep '21 quarterly results on 11/02/21.
>>> FEATURED STOCK ARTICLE : Found Support Near Prior High While Consolidating - 10/8/2021 |
View all notes |
Set NEW NOTE alert |
Company Profile |
SEC
News |
Chart |
Request a new note
C
A
S
I |
MEDP
-
NASDAQ
Medpace Holdings Inc
Medical-Research Eqp/Svc
|
$188.38
|
+1.34
0.72% |
$189.01
|
245,683
151.56% of 50 DAV
50 DAV is 162,100
|
$199.04
-5.36%
|
9/10/2021
|
$196.32
|
PP = $196.22
|
|
MB = $206.03
|
Most Recent Note - 10/20/2021 5:35:54 PM
Y - Perched near its 52-week high, still finding support near its 50 DMA line ($186). More damaging losses would raise concerns. Pivot point cited was based on its 4/26/21 high plus 10 cents. Subsequent gains and strong close above the pivot point backed by at least +40% above average volume may trigger a technical buy signal.
>>> FEATURED STOCK ARTICLE : Found Prompt Support Near 50-Day Moving Average Line - 10/14/2021 |
View all notes |
Set NEW NOTE alert |
Company Profile |
SEC
News |
Chart |
Request a new note
C
A
S
I |
Symbol/Exchange
Company Name
Industry Group |
PRICE |
CHANGE
(%Change) |
Day High |
Volume
(% DAV)
(% 50 day avg vol) |
52 Wk Hi
% From Hi |
Featured
Date |
Price
Featured |
Pivot Featured |
|
Max Buy |
JEF
-
NYSE
Jefferies Financial Grp
Finance-Invest Bnk/Bkrs
|
$43.32
|
+0.55
1.29% |
$43.50
|
1,232,864
67.22% of 50 DAV
50 DAV is 1,834,000
|
$42.85
1.10%
|
6/28/2021
|
$31.81
|
PP = $34.42
|
|
MB = $36.14
|
Most Recent Note - 10/25/2021 5:10:33 PM
G - Very extended from any sound base, it posted a 17th consecutive gain today for another new all-time high. Its 50 DMA line ($37.86) defines important near-term support to watch on pullbacks. Reported Aug '21 quarterly earnings +713% on +70% sales revenues versus the year ago period.
>>> FEATURED STOCK ARTICLE : Perched at 52-week High With Earnings News Due - 9/29/2021 |
View all notes |
Set NEW NOTE alert |
Company Profile |
SEC
News |
Chart |
Request a new note
C
A
S
I |
AVTR
-
NYSE
Avantor Inc
Medical-Research Eqp/Svc
|
$37.90
|
-0.52
-1.35% |
$38.54
|
3,478,373
89.05% of 50 DAV
50 DAV is 3,906,300
|
$44.37
-14.58%
|
6/10/2021
|
$32.94
|
PP = $34.09
|
|
MB = $35.79
|
Most Recent Note - 10/21/2021 12:45:43 PM
G - Still sputtering below its 50 DMA line ($40.39) and below the prior low ($39.24 on 10/01/21) after damaging volume-driven losses triggering technical sell signals. A rebound above the 50 DMA line is needed for its outlook to improve. Completed a Secondary Offering on 9/13/21 while perched at its all-time high, very extended from any sound base.
>>> FEATURED STOCK ARTICLE : Pulled Back Finding Support Near 50-Day Moving Average - 10/11/2021 |
View all notes |
Set NEW NOTE alert |
Company Profile |
SEC
News |
Chart |
Request a new note
C
A
S
I |
MIME
-
NASDAQ
Mimecast Limited
Computer Sftwr-Security
|
$70.86
|
+1.99
2.89% |
$71.45
|
689,045
74.65% of 50 DAV
50 DAV is 923,000
|
$71.45
-0.83%
|
10/18/2021
|
$68.17
|
PP = $71.55
|
|
MB = $75.13
|
Most Recent Note - 10/21/2021 8:52:26 PM
Y - Volume totals have been cooling while consolidating above its 50 DMA line ($65.45) and perched less that -4% from its all-time high. Fundamentals remain strong. Color code was changed to yellow with new pivot point cited based on its 9/03/21 high plus 10 cents. See the latest FSU analysis for more details and a new annotated graph.
>>> FEATURED STOCK ARTICLE : MIME Consolidating Less Than 4% Off High Building New Base - 10/21/2021 |
View all notes |
Set NEW NOTE alert |
Company Profile |
SEC
News |
Chart |
Request a new note
C
A
S
I |
ZD
-
NASDAQ
Ziff Davis Inc
Internet-Content
|
$127.55
|
+1.64
1.30% |
$127.92
|
525,124
132.94% of 50 DAV
50 DAV is 395,000
|
$128.09
-0.42%
|
10/25/2021
|
$126.07
|
PP = $128.19
|
|
MB = $134.60
|
Most Recent Note - 10/25/2021 5:04:54 PM
Y - Perched within close striking distance of its 52-week high after today's 5th consecutive gain. Color code was changed to yellow with pivot point cited based on its 7/29/21 high plus 10 cents. A solid gain and close above the pivot point backed by at least +40% above average volume may trigger a technical buy signal. Quarterly and annual earnings (C and A criteria) history has been strong. See the latest FSU analysis for more details and a new annotated graph.
>>> FEATURED STOCK ARTICLE : Internet Content Firm Perched Near Prior High - 10/25/2021 |
View all notes |
Set NEW NOTE alert |
Company Profile |
SEC
News |
Chart |
Request a new note
C
A
S
I |
|
|
|
THESE ARE NOT BUY RECOMMENDATIONS!
Comments contained in the body of this report are technical
opinions only. The material herein has been obtained
from sources believed to be reliable and accurate, however,
its accuracy and completeness cannot be guaranteed.
This site is not an investment advisor, hence it does
not endorse or recommend any securities or other investments.
Any recommendation contained in this report may not
be suitable for all investors and it is not to be deemed
an offer or solicitation on our part with respect to
the purchase or sale of any securities. All trademarks,
service marks and trade names appearing in this report
are the property of their respective owners, and are
likewise used for identification purposes only.
This report is a service available
only to active Paid Premium Members.
You may opt-out of receiving report notifications
at any time. Questions or comments may be submitted
by writing to Premium Membership Services 665 S.E. 10 Street, Suite 201 Deerfield Beach, FL 33441-5634 or by calling 1-800-965-8307
or 954-785-1121.
|
|
|