You are not logged in.
This means you
CAN ONLY VIEW reports that were published prior to Monday, March 31, 2025.
You
MUST UPGRADE YOUR MEMBERSHIP if you want to see any current reports.
AFTER MARKET UPDATE - WEDNESDAY, OCTOBER 20TH, 2021
Previous After Market Report Next After Market Report >>>
|
|
|
|
DOW |
+152.03 |
35,609.34 |
+0.43% |
|
Volume |
738,148,317 |
+6% |
|
Volume |
4,057,713,900 |
-8% |
|
NASDAQ |
-7.41 |
15,121.68 |
-0.05% |
|
Advancers |
2,189 |
68% |
|
Advancers |
2,567 |
58% |
|
S&P 500 |
+16.56 |
4,536.19 |
+0.37% |
|
Decliners |
1,016 |
32% |
|
Decliners |
1,863 |
42% |
|
Russell 2000 |
+13.85 |
2,289.77 |
+0.61% |
|
52 Wk Highs |
185 |
|
|
52 Wk Highs |
148 |
|
|
S&P 600 |
+9.50 |
1,378.31 |
+0.69% |
|
52 Wk Lows |
17 |
|
|
52 Wk Lows |
58 |
|
|
 |
Leadership Improved but Major Indices Ended Mixed
Kenneth J. Gruneisen - Passed the CAN SLIM® Master's Exam
The Dow climbed 152 points, while the S&P 500 gained 0.4% for its sixth straight daily advance. Both benchmarks pared gains after pushing to fresh record highs during intraday trading, closing within 0.1% of their recent peaks. The tech-heavy Nasdaq Composite bucked the uptrend, declining 0.1% to snap a five-day winning streak. The volume totals reported were mixed, higher than the prior session on the NYSE and lighter on the Nasdaq exchange. Breadth was positive as advancers led decliners by more than a 2-1 margin on the NYSE and almost 5-3 on the Nasdaq exchange. Leadership improved as there were 77 high-ranked companies from the Leaders List that hit new 52-week highs and were listed on the BreakOuts Page versus the total of 55 on the prior session. New 52-week highs totals expanded and outnumbered shrinking new 52-week lows totals on both the NYSE and the Nasdaq exchange. The solid gains last Thursday met the definition of a follow-through day confirming a new rally for the major indices (M criteria). Investors are reminded to only make proper new buys as per the fundamental and technical rules of the fact-based investment system.
PICTURED: The S&P 500 Index is challenging its record high after 6 consecutive gains. Disciplined investors following the fact-based investment system may note that Thursday's session was a proper follow-through day - which requires a solid gain from at least one of the major averages backed by higher volume and coupled with an expansion in the number of stocks hitting new highs.
U.S. stocks finished mostly higher on Wednesday, as investors assessed another busy day of corporate earnings reports. Eight of 11 S&P 500 sectors finished in positive territory, with Technology, Communication Services, and Consumer Discretionary stocks lagging. The Health Care group outperformed on strong earnings. Anthem (ANTM + 7.70%) and Abbott Laboratories (ABT +3.33%) rose after both companies posted a top and bottom line beat and lifted their full-year outlooks. Elsewhere, Netflix (NFLX -2.17%) fell as weak current-quarter guidance overshadowed stronger-than-expected new subscriber growth. In other corporate news, Pinterest (PINS +12.77%) rose on reports the social media company has engaged in talks to potentially be acquired by PayPal (PYPL -4.91%) for roughly $70 per share. Meanwhile, Ford (F +4.02%) rose on the heels of an analyst upgrade.
Treasuries were mixed, with the yield on the 10-year note little changed at 1.64%, still near its highest level since May. In central bank news, the Federal Reserve’s Beige Book showed economic growth modestly slowed in most regions as persistent shortages in labor and supply chains inspired caution. In commodities, WTI crude reversed an earlier drop, rising 1.1% to $83.87/barrel after official government data revealed a surprise drawdown in domestic crude stockpiles. Elsewhere, bitcoin hit a fresh all-time high following yesterday’s debut of the first U.S. cryptocurrency-linked exchange-traded fund. |
 Kenneth J. Gruneisen started out as a licensed stockbroker in August 1987, a couple of months prior to the historic stock market crash that took the Dow Jones Industrial Average down -22.6% in a single day. He has published daily fact-based fundamental and technical analysis on high-ranked stocks online for two decades. Through FACTBASEDINVESTING.COM, Kenneth provides educational articles, news, market commentary, and other information regarding proven investment systems that work in good times and bad.
Comments contained in the body of this report are technical opinions only and are not necessarily those of Gruneisen Growth Corp. The material herein has been obtained from sources believed to be reliable and accurate, however, its accuracy and completeness cannot be guaranteed. Our firm, employees, and customers may effect transactions, including transactions contrary to any recommendation herein, or have positions in the securities mentioned herein or options with respect thereto. Any recommendation contained in this report may not be suitable for all investors and it is not to be deemed an offer or solicitation on our part with respect to the purchase or sale of any securities. |
|
 |
Financial, Networking, and Commodity-Linked Groups Led Gainers
Kenneth J. Gruneisen - Passed the CAN SLIM® Master's Exam
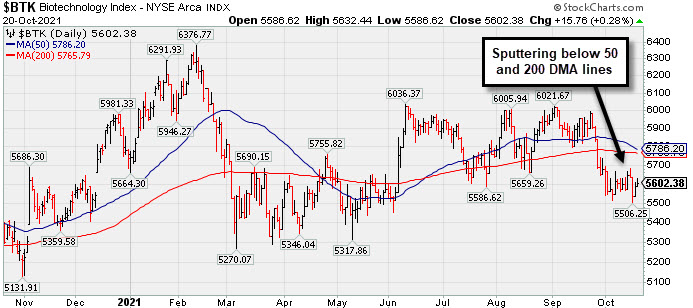
The Bank Index ($BKX +1.95%) posted a solid gain and the Broker/Dealer Index ($XBD +0.55%) edged higher while the Retail Index ($RLX -0.28%) ended slightly in the red. The Networking Index ($NWX +1.08%) and Biotech Index ($BTK +0.28%) posted gains while the Semiconductor Index ($SOX -0.21%) ended slightly lower. Commodity-linked groups had a positive bias as the Gold & Silver Index ($XAU +1.14%) outpaced the Oil Services Index ($OSX +0.77%) and Integrated Oil Index ($XOI +0.86%).
PICTURED: The Biotech Index ($BTK +0.28%) recently slumped below its 50-day and 200-day moving average (DMA) lines.
| Oil Services |
$OSX |
66.27 |
+0.51 |
+0.77% |
+49.50% |
| Integrated Oil |
$XOI |
1,224.96 |
+10.42 |
+0.86% |
+54.57% |
| Semiconductor |
$SOX |
3,374.22 |
-7.23 |
-0.21% |
+20.70% |
| Networking |
$NWX |
847.51 |
+9.06 |
+1.08% |
+18.18% |
| Broker/Dealer |
$XBD |
500.00 |
+2.73 |
+0.55% |
+32.42% |
| Retail |
$RLX |
4,101.49 |
-11.52 |
-0.28% |
+15.10% |
| Gold & Silver |
$XAU |
133.78 |
+1.51 |
+1.14% |
-7.22% |
| Bank |
$BKX |
141.56 |
+2.71 |
+1.95% |
+44.58% |
| Biotech |
$BTK |
5,602.38 |
+15.76 |
+0.28% |
-2.38% |
|
|
|
 |
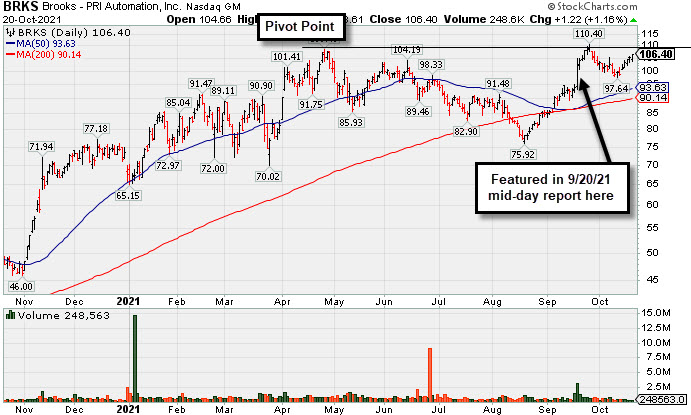
5th Quiet Gain Has Brooks Perched Near Prior Highs
Kenneth J. Gruneisen - Passed the CAN SLIM® Master's Exam
Brooks Automation (BRKS +$1.22 or +1.16% to $106.40) posted a 5th consecutive gain with light volume, approaching prior highs. Little resistance remains due to overhead supply. BRKS wedged higher but then stalled after highlighted in yellow in the 9/20/21 mid-day report with pivot point cited based on its 4/27/21 high plus 10 cents (read here). Subsequent gains above the cited pivot point or above the prior high backed by at least 40% above average volume may trigger a proper technical buy signal.
It reported earnings +125% on +43% sales revenues for the Jun '21 quarter versus the year ago period, marking its 8th consecutive quarterly comparison above the +25% minimum earnings guideline (C criteria). Annual earnings history (A criteria) included a downturn in FY '18. Its current Earnings Per Share Rating is 96, well above the 80+ minimum for buy candidates under the fact-based investment system's fundamental guidelines.
The Electronics - Semiconductor Equipment group is ranked 99th on the 197 Industry Groups list (L criteria). The number of top-rated funds that own BRKS shares has risen from 454 in Jun '20 to 629 in Sep '21, a reassuring sign concerning the I criteria. Also, its current Up/Down Volume Ratio of 2.0 is an unbiased indication its shares have been under accumulation over the past 50 days. It has a Timeliness rating of A and Sponsorship Rating of B. Its small supply of 74.3 million shares outstanding (S criteria) can contribute to greater price volatility in the event of institutional buying or selling. Charts courtesy of www.stockcharts.com
|
|
|
Color Codes Explained :
Y - Better candidates highlighted by our
staff of experts.
G - Previously featured
in past reports as yellow but may no longer be buyable under the
guidelines.
***Last / Change / Volume data in this table is the closing quote data***
Symbol/Exchange
Company Name
Industry Group |
PRICE |
CHANGE
(%Change) |
Day High |
Volume
(% DAV)
(% 50 day avg vol) |
52 Wk Hi
% From Hi |
Featured
Date |
Price
Featured |
Pivot Featured |
|
Max Buy |
 SIVB
-
NASDAQ
SIVB
-
NASDAQ
S V B Financial Group
BANKING - Regional - Pacific Banks
|
$705.27
|
+5.35
0.76% |
$705.71
|
270,208
67.22% of 50 DAV
50 DAV is 402,000
|
$701.01
0.61%
|
8/6/2021
|
$589.70
|
PP = $608.94
|
|
MB = $639.39
|
Most Recent Note - 10/19/2021 5:23:59 PM
G - Inched to new new all-time highs with today's 5th consecutive small gain on below average volume. Extended from the previously noted base, its 50 DMA line ($612) and prior highs in the $608 area define important near-term support to watch on pullbacks. Completed a new Public Offering on 8/11/21.
>>> FEATURED STOCK ARTICLE : Pullback After 5 Straight Gains into New High Territory - 9/28/2021 |
View all notes |
Set NEW NOTE alert |
Company Profile |
SEC
News |
Chart |
Request a new note
C
A
S
I |
BLDR
-
NYSE
Builders Firstsource Inc
Bldg-Constr Prds/Misc
|
$58.29
|
+0.77
1.34% |
$58.81
|
1,308,656
66.33% of 50 DAV
50 DAV is 1,973,000
|
$58.25
0.07%
|
8/12/2021
|
$52.38
|
PP = $54.09
|
|
MB = $56.79
|
 Most Recent Note - 10/20/2021 5:34:35 PM
G - Color code is changed to green after it posted a quiet gain today for another new all-time high and closed above its "max buy" level. Prior highs in the $54-55 area define initial support to watch on pullbacks. Fundamentals remain strong.
>>> FEATURED STOCK ARTICLE : Sputtering After Wedging to New Highs - 10/1/2021 |
View all notes |
Set NEW NOTE alert |
Company Profile |
SEC
News |
Chart |
Request a new note
C
A
S
I |
KFRC
-
NASDAQ
Kforce Inc
Comml Svcs-Staffing
|
$64.84
|
+0.40
0.62% |
$65.83
|
54,561
48.28% of 50 DAV
50 DAV is 113,000
|
$69.00
-6.03%
|
9/10/2021
|
$59.53
|
PP = $64.48
|
|
MB = $67.70
|
Most Recent Note - 10/15/2021 5:07:14 PM
Y - Pulled back today with near average volume 3rd consecutive loss. Stalled since its 10/07/21 gain for a new all-time high backed by +58% above average volume triggered a technical buy signal. Fundamentals are strong. See the latest FSU analysis for more details and a new annotated graph.
>>> FEATURED STOCK ARTICLE : Pulling Back Near Prior Highs Following Technical Breakout - 10/15/2021 |
View all notes |
Set NEW NOTE alert |
Company Profile |
SEC
News |
Chart |
Request a new note
C
A
S
I |
GNRC
-
NYSE
Generac Hldgs Inc
Electrical-Power/Equipmt
|
$458.22
|
-4.62
-1.00% |
$466.48
|
507,408
82.91% of 50 DAV
50 DAV is 612,000
|
$476.31
-3.80%
|
8/30/2021
|
$449.36
|
PP = $457.10
|
|
MB = $479.96
|
Most Recent Note - 10/18/2021 5:37:05 PM
Y -Hit a new 52-week high with today's gain backed by +28% above average volume. A gain and close above the pivot point must be backed by at least +40% above average volume to trigger a proper technical buy signal.
>>> FEATURED STOCK ARTICLE : Prior Lows Define Near-Term Support After 50 DMA Violation - 10/6/2021 |
View all notes |
Set NEW NOTE alert |
Company Profile |
SEC
News |
Chart |
Request a new note
C
A
S
I |
CAMT
-
NASDAQ
Camtek Ltd
ELECTRONICS - Scientific and Technical Instrum
|
$39.29
|
-0.41
-1.03% |
$39.67
|
88,417
57.41% of 50 DAV
50 DAV is 154,000
|
$46.01
-14.61%
|
8/4/2021
|
$39.67
|
PP = $40.57
|
|
MB = $42.60
|
Most Recent Note - 10/15/2021 5:09:18 PM
G - Volume totals have been cooling while still sputtering below its 50 DMA line ($40.05). The prior low ($34.68 on 8/17/21) defines the next important near-term support to watch. A rebound above the 50 DMA line is needed for its outlook to improve. Fundamentals remain strong.
>>> FEATURED STOCK ARTICLE : Fell Below Prior High and Violated 50-Day Moving Average - 10/5/2021 |
View all notes |
Set NEW NOTE alert |
Company Profile |
SEC
News |
Chart |
Request a new note
C
A
S
I |
Symbol/Exchange
Company Name
Industry Group |
PRICE |
CHANGE
(%Change) |
Day High |
Volume
(% DAV)
(% 50 day avg vol) |
52 Wk Hi
% From Hi |
Featured
Date |
Price
Featured |
Pivot Featured |
|
Max Buy |
PKI
-
NYSE
Perkinelmer Inc
ELECTRONICS - Scientific and Technical Instrum
|
$176.58
|
+4.96
2.89% |
$177.07
|
597,411
92.34% of 50 DAV
50 DAV is 647,000
|
$192.00
-8.03%
|
8/18/2021
|
$181.07
|
PP = $188.50
|
|
MB = $197.93
|
Most Recent Note - 10/20/2021 5:39:46 PM
G - Posted a 6th consecutive gain with below average volume. A rebound above the 50 DMA line ($180) is needed for its outlook to improve. Its Relative Strength Rating improved to 81, one notch above the 80+ minimum guideline for buy candidates. Fundamentals remain strong. See the latest FSU analysis for more details and an annotated graph.
>>> FEATURED STOCK ARTICLE : Rebound Above 50 DMA Line Needed to Help Outlook Improve - 10/19/2021 |
View all notes |
Set NEW NOTE alert |
Company Profile |
SEC
News |
Chart |
Request a new note
C
A
S
I |
UMC
-
NYSE
United Microelectrnc Adr
ELECTRONICS - Semiconductor - Integrated Cir
|
$10.42
|
-0.20
-1.88% |
$10.50
|
5,725,353
79.30% of 50 DAV
50 DAV is 7,220,000
|
$12.62
-17.43%
|
8/5/2021
|
$11.62
|
PP = $11.38
|
|
MB = $11.95
|
Most Recent Note - 10/19/2021 5:29:38 PM
G - Holding its ground above its 200 DMA line ($9.86). A rebound above the 50 DMA line ($11.17) is needed for its outlook to improve.
>>> FEATURED STOCK ARTICLE : Consolidating Above 50-day Moving Average Near "Max Buy" Level - 9/27/2021 |
View all notes |
Set NEW NOTE alert |
Company Profile |
SEC
News |
Chart |
Request a new note
C
A
S
I |
BRKS
-
NASDAQ
Brooks Automation
ELECTRONICS - Semiconductor Equipment and Mate
|
$106.40
|
+1.22
1.16% |
$106.48
|
248,606
41.30% of 50 DAV
50 DAV is 602,000
|
$110.40
-3.62%
|
9/20/2021
|
$101.21
|
PP = $108.82
|
|
MB = $114.26
|
Most Recent Note - 10/20/2021 5:28:10 PM
Y - Posted a 5th consecutive gain today with lighter than average volume. Still perched within striking distance of its 52-week high. Pivot point cited was based on its 4/27/21 high plus 10 cents. Subsequent gains above the pivot point or prior highs backed by at least 40% above average volume may trigger a convincing technical buy signal. See the latest FSU analysis for more details and a new annotated graph.
>>> FEATURED STOCK ARTICLE : 5th Quiet Gain Has Brooks Perched Near Prior Highs - 10/20/2021 |
View all notes |
Set NEW NOTE alert |
Company Profile |
SEC
News |
Chart |
Request a new note
C
A
S
I |
ENTG
-
NASDAQ
Entegris Inc
ELECTRONICS - Semiconductor Equipment and Mate
|
$130.83
|
+1.58
1.22% |
$131.11
|
574,722
80.49% of 50 DAV
50 DAV is 714,000
|
$135.99
-3.79%
|
8/4/2021
|
$125.33
|
PP = $126.51
|
|
MB = $132.84
|
Most Recent Note - 10/20/2021 5:37:18 PM
Y - Perched within striking distance of its 52-week high. Found support near its 50 DMA line ($122.71) after damaging losses. Its prior low and 200 DMA line define the next important support in the $109 area.
>>> FEATURED STOCK ARTICLE : Hit New High and Rose Above its Max Buy Level - 9/23/2021 |
View all notes |
Set NEW NOTE alert |
Company Profile |
SEC
News |
Chart |
Request a new note
C
A
S
I |
CLFD
-
NASDAQ
Clearfield Inc
TELECOMMUNICATIONS - Cables / Satalite Equipment
|
$52.47
|
-0.77
-1.45% |
$53.77
|
57,545
71.04% of 50 DAV
50 DAV is 81,000
|
$54.49
-3.71%
|
7/23/2021
|
$40.23
|
PP = $43.74
|
|
MB = $45.93
|
Most Recent Note - 10/18/2021 5:33:33 PM
G - Perched at its 52-week high, extended from the previously noted base. Prior highs in the $46 area define near-term support along with its 50 DMA line ($45.56) where damaging losses may trigger technical sell signals. Fundamentals remain strong. See the latest FSU analysis for more details and a new annotated graph.
>>> FEATURED STOCK ARTICLE : Extended From Prior Base After Latest Rally - 10/18/2021 |
View all notes |
Set NEW NOTE alert |
Company Profile |
SEC
News |
Chart |
Request a new note
C
A
S
I |
Symbol/Exchange
Company Name
Industry Group |
PRICE |
CHANGE
(%Change) |
Day High |
Volume
(% DAV)
(% 50 day avg vol) |
52 Wk Hi
% From Hi |
Featured
Date |
Price
Featured |
Pivot Featured |
|
Max Buy |
TGH
-
NYSE
Textainer Group Holdings
TRANSPORTATION - Logistics
|
$37.89
|
+0.96
2.60% |
$38.19
|
409,199
90.73% of 50 DAV
50 DAV is 451,000
|
$38.84
-2.45%
|
10/7/2021
|
$36.97
|
PP = $36.80
|
|
MB = $38.64
|
Most Recent Note - 10/20/2021 5:38:30 PM
Y - Posted a gain today with near average volume for a best-ever close. Its 50 DMA line ($34.38) defines important near-term support to watch above recent lows in the $30-31 area. Fundamentals remain strong.
>>> FEATURED STOCK ARTICLE : Perched Near High With Strong Fundamentals - 10/7/2021 |
View all notes |
Set NEW NOTE alert |
Company Profile |
SEC
News |
Chart |
Request a new note
C
A
S
I |
SMPL
-
NASDAQ
Simply Good Foods Co
Food-Confectionery
|
$34.15
|
-0.35
-1.01% |
$35.08
|
418,705
129.47% of 50 DAV
50 DAV is 323,400
|
$38.50
-11.30%
|
12/28/2020
|
$30.40
|
PP = $31.44
|
|
MB = $33.01
|
Most Recent Note - 10/19/2021 5:25:11 PM
G - Its Relative Strength Rating has slumped to 74 while sputtering back below its 50 DMA line ($35.22). Recent low ($33.55 on 9/20/21) and 200 DMA line define important support where more damaging losses would raise greater concerns. Fundamentals remain strong.
>>> FEATURED STOCK ARTICLE : Consolidating Just Above 50-Day Moving Average Line - 10/12/2021 |
View all notes |
Set NEW NOTE alert |
Company Profile |
SEC
News |
Chart |
Request a new note
C
A
S
I |
WDAY
-
NYSE
Workday Inc Cl A
Computer Sftwr-Enterprse
|
$277.26
|
-0.01
-0.00% |
$279.69
|
782,490
51.03% of 50 DAV
50 DAV is 1,533,500
|
$282.77
-1.95%
|
9/7/2021
|
$275.69
|
PP = $282.87
|
|
MB = $297.01
|
Most Recent Note - 10/19/2021 5:28:24 PM
Y - Posted another gain today with below average volume while challenging prior highs. Very little resistance remains due to overhead supply. Its 50 DMA line ($258).and recent lows ($246) define near-term support to watch where violations would raise concerns. Fundamentals remain strong.
>>> FEATURED STOCK ARTICLE : Rebounding From 50-Day Moving Average Toward Prior Highs - 10/13/2021 |
View all notes |
Set NEW NOTE alert |
Company Profile |
SEC
News |
Chart |
Request a new note
C
A
S
I |
CTLT
-
NYSE
Catalent Inc
DRUGS - Biotechnology
|
$131.78
|
-1.44
-1.08% |
$134.21
|
772,183
88.35% of 50 DAV
50 DAV is 874,000
|
$142.64
-7.61%
|
8/25/2021
|
$128.72
|
PP = $127.78
|
|
MB = $134.17
|
Most Recent Note - 10/18/2021 5:35:13 PM
Y - Posted a gain today but remains below Its 50 DMA line ($131) which may act as resistance. Prior highs in the $124-127 area which define the next important near-term support to watch. Fundamentals remain strong.
>>> FEATURED STOCK ARTICLE : Found Support Near Prior High While Consolidating - 10/8/2021 |
View all notes |
Set NEW NOTE alert |
Company Profile |
SEC
News |
Chart |
Request a new note
C
A
S
I |
MEDP
-
NASDAQ
Medpace Holdings Inc
Medical-Research Eqp/Svc
|
$188.05
|
+2.38
1.28% |
$189.24
|
107,382
66.33% of 50 DAV
50 DAV is 161,900
|
$199.04
-5.52%
|
9/10/2021
|
$196.32
|
PP = $196.22
|
|
MB = $206.03
|
Most Recent Note - 10/20/2021 5:35:54 PM
Y - Perched near its 52-week high, still finding support near its 50 DMA line ($186). More damaging losses would raise concerns. Pivot point cited was based on its 4/26/21 high plus 10 cents. Subsequent gains and strong close above the pivot point backed by at least +40% above average volume may trigger a technical buy signal.
>>> FEATURED STOCK ARTICLE : Found Prompt Support Near 50-Day Moving Average Line - 10/14/2021 |
View all notes |
Set NEW NOTE alert |
Company Profile |
SEC
News |
Chart |
Request a new note
C
A
S
I |
Symbol/Exchange
Company Name
Industry Group |
PRICE |
CHANGE
(%Change) |
Day High |
Volume
(% DAV)
(% 50 day avg vol) |
52 Wk Hi
% From Hi |
Featured
Date |
Price
Featured |
Pivot Featured |
|
Max Buy |
JEF
-
NYSE
Jefferies Financial Grp
Finance-Invest Bnk/Bkrs
|
$42.05
|
+0.04
0.10% |
$42.25
|
1,345,957
74.49% of 50 DAV
50 DAV is 1,807,000
|
$42.55
-1.18%
|
6/28/2021
|
$31.81
|
PP = $34.42
|
|
MB = $36.14
|
Most Recent Note - 10/18/2021 5:38:11 PM
G - Posted a 12th consecutive gain today for another new all-time high. Its 50 DMA line ($37) defines important near-term support to watch on pullbacks. Reported Aug '21 quarterly earnings +713% on +70% sales revenues versus the year ago period.
>>> FEATURED STOCK ARTICLE : Perched at 52-week High With Earnings News Due - 9/29/2021 |
View all notes |
Set NEW NOTE alert |
Company Profile |
SEC
News |
Chart |
Request a new note
C
A
S
I |
AVTR
-
NYSE
Avantor Inc
Medical-Research Eqp/Svc
|
$38.58
|
+0.35
0.92% |
$39.00
|
3,085,239
80.32% of 50 DAV
50 DAV is 3,841,000
|
$44.37
-13.05%
|
6/10/2021
|
$32.94
|
PP = $34.09
|
|
MB = $35.79
|
Most Recent Note - 10/19/2021 5:20:40 PM
G - Still sputtering below its 50 DMA line ($40.37) and below the prior low ($39.24 on 10/01/21) after damaging volume-driven losses triggering technical sell signals. A rebound above the 50 DMA line is needed for its outlook to improve. Completed a Secondary Offering on 9/13/21 while perched at its all-time high, very extended from any sound base.
>>> FEATURED STOCK ARTICLE : Pulled Back Finding Support Near 50-Day Moving Average - 10/11/2021 |
View all notes |
Set NEW NOTE alert |
Company Profile |
SEC
News |
Chart |
Request a new note
C
A
S
I |
MIME
-
NASDAQ
Mimecast Limited
Computer Sftwr-Security
|
$68.03
|
+0.03
0.04% |
$68.87
|
277,351
29.63% of 50 DAV
50 DAV is 936,000
|
$71.45
-4.79%
|
10/18/2021
|
$68.17
|
PP = $71.55
|
|
MB = $75.13
|
Most Recent Note - 10/18/2021 5:40:24 PM
Y - Rallied further above its 50 DMA line ($64.87) toward prior highs. Fundamentals remain strong. Color code is changed to yellow with new pivot point cited based on its 9/03/21 high plus 10 cents.
>>> FEATURED STOCK ARTICLE : Consolidating After Getting Extended from Previous Base Noted - 9/21/2021 |
View all notes |
Set NEW NOTE alert |
Company Profile |
SEC
News |
Chart |
Request a new note
C
A
S
I |
|
|
|
THESE ARE NOT BUY RECOMMENDATIONS!
Comments contained in the body of this report are technical
opinions only. The material herein has been obtained
from sources believed to be reliable and accurate, however,
its accuracy and completeness cannot be guaranteed.
This site is not an investment advisor, hence it does
not endorse or recommend any securities or other investments.
Any recommendation contained in this report may not
be suitable for all investors and it is not to be deemed
an offer or solicitation on our part with respect to
the purchase or sale of any securities. All trademarks,
service marks and trade names appearing in this report
are the property of their respective owners, and are
likewise used for identification purposes only.
This report is a service available
only to active Paid Premium Members.
You may opt-out of receiving report notifications
at any time. Questions or comments may be submitted
by writing to Premium Membership Services 665 S.E. 10 Street, Suite 201 Deerfield Beach, FL 33441-5634 or by calling 1-800-965-8307
or 954-785-1121.
|
|
|