You are not logged in.
This means you
CAN ONLY VIEW reports that were published prior to Monday, March 31, 2025.
You
MUST UPGRADE YOUR MEMBERSHIP if you want to see any current reports.
AFTER MARKET UPDATE - TUESDAY, OCTOBER 19TH, 2021
Previous After Market Report Next After Market Report >>>
|
|
|
|
DOW |
+198.70 |
35,457.31 |
+0.56% |
|
Volume |
694,550,904 |
-11% |
|
Volume |
4,410,937,400 |
+7% |
|
NASDAQ |
+107.28 |
15,129.09 |
+0.71% |
|
Advancers |
1,834 |
57% |
|
Advancers |
2,706 |
61% |
|
S&P 500 |
+33.17 |
4,519.63 |
+0.74% |
|
Decliners |
1,372 |
43% |
|
Decliners |
1,711 |
39% |
|
Russell 2000 |
+8.07 |
2,275.91 |
+0.36% |
|
52 Wk Highs |
130 |
|
|
52 Wk Highs |
96 |
|
|
S&P 600 |
+1.07 |
1,368.81 |
+0.08% |
|
52 Wk Lows |
26 |
|
|
52 Wk Lows |
82 |
|
|
 |
Major Indices Rally With Greater Leadership
Kenneth J. Gruneisen - Passed the CAN SLIM® Master's Exam
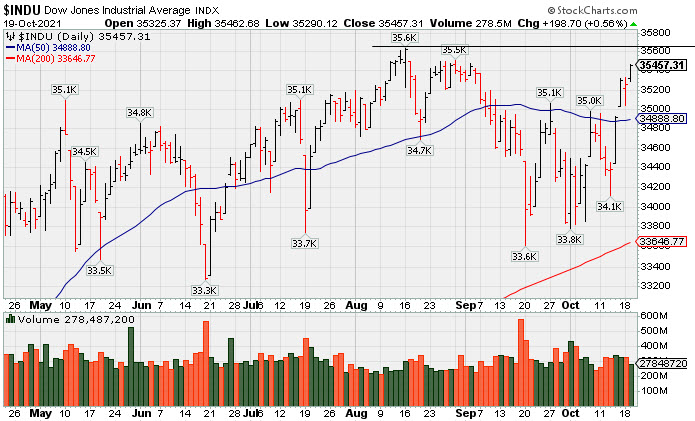
The S&P 500 and Nasdaq Composite each jumped 0.7%, with both benchmarks climbing for a fifth consecutive session, their longest winning streak since August. The Dow rallied 198 points, closing within 0.5% of its August 16 record peak. The volume totals reported were mixed, lighter than the prior session on the NYSE and higher on the Nasdaq exchange. Advancers led decliners by a 3-2 margin on the NYSE and on the Nasdaq exchange. There were 55 high-ranked companies from the Leaders List that hit new 52-week highs and were listed on the BreakOuts Page versus the total of 53 on the prior session. New 52-week highs outnumbered new 52-week lows on the NYSE and on the Nasdaq exchange. The solid gains last Thursday met the definition of a follow-through day confirming a new rally for the major indices (M criteria). Investors are reminded to only make proper new buys as per the fundamental and technical rules of the fact-based investment system.
PICTURED: The Dow Jones Industrial Average rebounded further above its 50-day moving average (DMA) line toward the prior high. Disciplined investors following the fact-based investment system may note that Thursday's session was a proper follow-through day - which requires a solid gain from at least one of the major averages backed by higher volume and coupled with an expansion in the number of stocks hitting new highs.
U.S. stocks finished firmly higher on Tuesday as mostly positive corporate earnings reports bolstered risk sentiment. Ten of 11 S&P 500 sectors closed in positive territory, with the Consumer Discretionary group the lone laggard. Health Care stocks paced the gains, with Johnson & Johnson (JNJ +2.34%) up following a boost to its full-year forecast. Energy stocks also outperformed, with WTI crude gaining 0.5% to $82.87/barrel, near a seven-year high as a gauge of the U.S. dollar weakened 0.2%. In earnings, Travelers Companies (TRV +1.64%) rose after the insurer posted a quarterly profit well ahead of consensus estimates. Procter & Gamble (PG -1.18%) as headwinds related to rising input costs overshadowed a top and bottom line beat. In other corporate news, Walmart (WMT +2.12%) rose on the heels of positive analyst commentary. Alibaba (BABA +6.10%) rose on news the Chinese e-commerce giant developed a proprietary chip to power its data center servers.
Longer-dated Treasuries declined, with the yield on the 10-year note up five basis points to 1.64%. On the data front, housing starts and building permits both fell in September, with the former unexpectedly declining 1.6% and the latter experiencing its biggest monthly drop since February (-7.7%). Elsewhere, bitcoin traded near a record high as the first U.S. cryptocurrency-linked exchange-traded fund made its trading debut. |
 Kenneth J. Gruneisen started out as a licensed stockbroker in August 1987, a couple of months prior to the historic stock market crash that took the Dow Jones Industrial Average down -22.6% in a single day. He has published daily fact-based fundamental and technical analysis on high-ranked stocks online for two decades. Through FACTBASEDINVESTING.COM, Kenneth provides educational articles, news, market commentary, and other information regarding proven investment systems that work in good times and bad.
Comments contained in the body of this report are technical opinions only and are not necessarily those of Gruneisen Growth Corp. The material herein has been obtained from sources believed to be reliable and accurate, however, its accuracy and completeness cannot be guaranteed. Our firm, employees, and customers may effect transactions, including transactions contrary to any recommendation herein, or have positions in the securities mentioned herein or options with respect thereto. Any recommendation contained in this report may not be suitable for all investors and it is not to be deemed an offer or solicitation on our part with respect to the purchase or sale of any securities. |
|
 |
Financial, Tech, and Commodity-Linked Groups Rose
Kenneth J. Gruneisen - Passed the CAN SLIM® Master's Exam
The Broker/Dealer Index ($XBD +0.45%) and Bank Index ($BKX +0.87%) both posted gains while the Retail Index ($RLX -0.05%) finished flat. The Semiconductor Index ($SOX +1.28%), Biotech Index ($BTK +0.89%), and Networking Index ($NWX +0.39%) posted unanimous gains. Commodity-linked groups also had a positive bias as the Gold & Silver Index ($XAU +1.33%), Oil Services Index ($OSX +0.52%), and Integrated Oil Index ($XOI +1.04%) posted unanimous gains.
PICTURED: The Bank Index ($BKX +0.87%) recently rallied to new record highs.
| Oil Services |
$OSX |
65.77 |
+0.34 |
+0.52% |
+48.36% |
| Integrated Oil |
$XOI |
1,214.54 |
+12.47 |
+1.04% |
+53.26% |
| Semiconductor |
$SOX |
3,381.45 |
+42.68 |
+1.28% |
+20.96% |
| Networking |
$NWX |
838.45 |
+3.24 |
+0.39% |
+16.92% |
| Broker/Dealer |
$XBD |
497.27 |
+2.24 |
+0.45% |
+31.69% |
| Retail |
$RLX |
4,113.01 |
-2.17 |
-0.05% |
+15.43% |
| Gold & Silver |
$XAU |
132.27 |
+1.73 |
+1.33% |
-8.27% |
| Bank |
$BKX |
138.85 |
+1.20 |
+0.87% |
+41.81% |
| Biotech |
$BTK |
5,586.62 |
+49.20 |
+0.89% |
-2.66% |
|
|
|
 |
Rebound Above 50 DMA Line Needed to Help Outlook Improve
Kenneth J. Gruneisen - Passed the CAN SLIM® Master's Exam
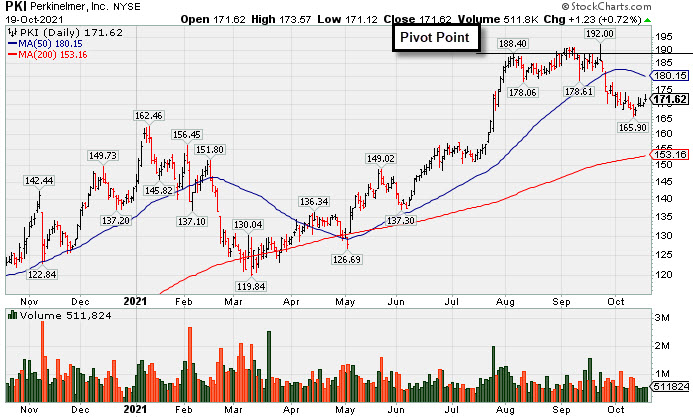
Perkinelmer Inc (PKI +$1.23 or +0.72% to $171.62) posted a 5th consecutive gain today with below average volume. A rebound above its 50-day moving average (DMA) line ($178) is needed for its outlook to improve. It encountered distributional pressure after it recently wedged to new all-time highs. It made limited headway following a noted "3-weeks tight" base as its color code was changed to yellow with new pivot point cited based on its 8/05/21 high plus 10 cents. Subsequent volume-driven gains for new highs would be a welcome sign of fresh institutional buying demand that could lead to more substantial price progress.
Fundamentals remain strong. The high-ranked ELECTRONICS - Scientific and Technical Instruments firm showed bullish action after it reported earnings +80% on +51% sales revenues for the Jun '21 quarter versus the year ago period, its 6th strong quarterly comparison above the +25% minimum guideline (C criteria). Annual earnings (A criteria) history has improved steadily. It has an Earnings Per Share Rating of 98.
There are 112.1 million shares outstanding (S criteria). The number of top-rated funds owning its shares rose from 1,269 in Sep '20 to 1,527 in Sep '21, a reassuring sign concerning the I criteria. Its current Up/Down Volume Ratio of 1.1 is an unbiased indication its shares have been under slight accumulation over the past 50 days. It has a Timeliness Rating of A and Sponsorship Rating of B.
|
|
|
Color Codes Explained :
Y - Better candidates highlighted by our
staff of experts.
G - Previously featured
in past reports as yellow but may no longer be buyable under the
guidelines.
***Last / Change / Volume data in this table is the closing quote data***
Symbol/Exchange
Company Name
Industry Group |
PRICE |
CHANGE
(%Change) |
Day High |
Volume
(% DAV)
(% 50 day avg vol) |
52 Wk Hi
% From Hi |
Featured
Date |
Price
Featured |
Pivot Featured |
|
Max Buy |
 SIVB
-
NASDAQ
SIVB
-
NASDAQ
S V B Financial Group
BANKING - Regional - Pacific Banks
|
$699.92
|
+3.84
0.55% |
$701.01
|
270,034
67.34% of 50 DAV
50 DAV is 401,000
|
$697.95
0.28%
|
8/6/2021
|
$589.70
|
PP = $608.94
|
|
MB = $639.39
|
 Most Recent Note - 10/19/2021 5:23:59 PM
G - Inched to new new all-time highs with today's 5th consecutive small gain on below average volume. Extended from the previously noted base, its 50 DMA line ($612) and prior highs in the $608 area define important near-term support to watch on pullbacks. Completed a new Public Offering on 8/11/21.
>>> FEATURED STOCK ARTICLE : Pullback After 5 Straight Gains into New High Territory - 9/28/2021 |
View all notes |
Set NEW NOTE alert |
Company Profile |
SEC
News |
Chart |
Request a new note
C
A
S
I |
BLDR
-
NYSE
Builders Firstsource Inc
Bldg-Constr Prds/Misc
|
$57.52
|
-0.30
-0.52% |
$58.25
|
1,395,866
70.29% of 50 DAV
50 DAV is 1,986,000
|
$58.23
-1.22%
|
8/12/2021
|
$52.38
|
PP = $54.09
|
|
MB = $56.79
|
Most Recent Note - 10/14/2021 6:13:34 PM
Y - Posted an 8th consecutive gain today for a new all-time high and it closed near its "max buy" level. Gains did not have the +40% above average volume needed to trigger a proper technical buy signal. Fundamentals remain strong.
>>> FEATURED STOCK ARTICLE : Sputtering After Wedging to New Highs - 10/1/2021 |
View all notes |
Set NEW NOTE alert |
Company Profile |
SEC
News |
Chart |
Request a new note
C
A
S
I |
KFRC
-
NASDAQ
Kforce Inc
Comml Svcs-Staffing
|
$64.44
|
-0.09
-0.14% |
$64.59
|
93,159
82.44% of 50 DAV
50 DAV is 113,000
|
$69.00
-6.61%
|
9/10/2021
|
$59.53
|
PP = $64.48
|
|
MB = $67.70
|
Most Recent Note - 10/15/2021 5:07:14 PM
Y - Pulled back today with near average volume 3rd consecutive loss. Stalled since its 10/07/21 gain for a new all-time high backed by +58% above average volume triggered a technical buy signal. Fundamentals are strong. See the latest FSU analysis for more details and a new annotated graph.
>>> FEATURED STOCK ARTICLE : Pulling Back Near Prior Highs Following Technical Breakout - 10/15/2021 |
View all notes |
Set NEW NOTE alert |
Company Profile |
SEC
News |
Chart |
Request a new note
C
A
S
I |
GNRC
-
NYSE
Generac Hldgs Inc
Electrical-Power/Equipmt
|
$462.84
|
-7.18
-1.53% |
$476.31
|
514,422
84.19% of 50 DAV
50 DAV is 611,000
|
$470.80
-1.69%
|
8/30/2021
|
$449.36
|
PP = $457.10
|
|
MB = $479.96
|
Most Recent Note - 10/18/2021 5:37:05 PM
Y -Hit a new 52-week high with today's gain backed by +28% above average volume. A gain and close above the pivot point must be backed by at least +40% above average volume to trigger a proper technical buy signal.
>>> FEATURED STOCK ARTICLE : Prior Lows Define Near-Term Support After 50 DMA Violation - 10/6/2021 |
View all notes |
Set NEW NOTE alert |
Company Profile |
SEC
News |
Chart |
Request a new note
C
A
S
I |
CAMT
-
NASDAQ
Camtek Ltd
ELECTRONICS - Scientific and Technical Instrum
|
$39.70
|
+0.46
1.17% |
$40.25
|
87,438
55.69% of 50 DAV
50 DAV is 157,000
|
$46.01
-13.71%
|
8/4/2021
|
$39.67
|
PP = $40.57
|
|
MB = $42.60
|
Most Recent Note - 10/15/2021 5:09:18 PM
G - Volume totals have been cooling while still sputtering below its 50 DMA line ($40.05). The prior low ($34.68 on 8/17/21) defines the next important near-term support to watch. A rebound above the 50 DMA line is needed for its outlook to improve. Fundamentals remain strong.
>>> FEATURED STOCK ARTICLE : Fell Below Prior High and Violated 50-Day Moving Average - 10/5/2021 |
View all notes |
Set NEW NOTE alert |
Company Profile |
SEC
News |
Chart |
Request a new note
C
A
S
I |
Symbol/Exchange
Company Name
Industry Group |
PRICE |
CHANGE
(%Change) |
Day High |
Volume
(% DAV)
(% 50 day avg vol) |
52 Wk Hi
% From Hi |
Featured
Date |
Price
Featured |
Pivot Featured |
|
Max Buy |
PKI
-
NYSE
Perkinelmer Inc
ELECTRONICS - Scientific and Technical Instrum
|
$171.62
|
+1.23
0.72% |
$173.57
|
511,824
78.80% of 50 DAV
50 DAV is 649,500
|
$192.00
-10.61%
|
8/18/2021
|
$181.07
|
PP = $188.50
|
|
MB = $197.93
|
Most Recent Note - 10/19/2021 5:18:46 PM
G - Posted a 5th consecutive small gain with below average volume. A rebound above the 50 DMA line ($180) is needed for its outlook to improve. Its Relative Strength Rating is 79, one notch below the 80+ minimum guideline for buy candidates. Fundamentals remain strong. See the latest FSU analysis for more details and a new annotated graph.
>>> FEATURED STOCK ARTICLE : Rebound Above 50 DMA Line Needed to Help Outlook Improve - 10/19/2021 |
View all notes |
Set NEW NOTE alert |
Company Profile |
SEC
News |
Chart |
Request a new note
C
A
S
I |
UMC
-
NYSE
United Microelectrnc Adr
ELECTRONICS - Semiconductor - Integrated Cir
|
$10.62
|
+0.24
2.31% |
$10.68
|
7,436,260
103.76% of 50 DAV
50 DAV is 7,167,000
|
$12.62
-15.85%
|
8/5/2021
|
$11.62
|
PP = $11.38
|
|
MB = $11.95
|
Most Recent Note - 10/19/2021 5:29:38 PM
G - Holding its ground above its 200 DMA line ($9.86). A rebound above the 50 DMA line ($11.17) is needed for its outlook to improve.
>>> FEATURED STOCK ARTICLE : Consolidating Above 50-day Moving Average Near "Max Buy" Level - 9/27/2021 |
View all notes |
Set NEW NOTE alert |
Company Profile |
SEC
News |
Chart |
Request a new note
C
A
S
I |
BRKS
-
NASDAQ
Brooks Automation
ELECTRONICS - Semiconductor Equipment and Mate
|
$105.18
|
+0.71
0.68% |
$105.63
|
276,305
45.00% of 50 DAV
50 DAV is 614,000
|
$110.40
-4.73%
|
9/20/2021
|
$101.21
|
PP = $108.82
|
|
MB = $114.26
|
Most Recent Note - 10/14/2021 6:15:05 PM
Y - Posted a gain today with lighter than average volume. Still perched within striking distance of its 52-week high. Pivot point cited was based on its 4/27/21 high plus 10 cents. Subsequent gains above the pivot point or prior highs backed by at least 40% above average volume may trigger a convincing technical buy signal.
>>> FEATURED STOCK ARTICLE : Rallying Near High After Brief Consolidation Below 200 DMA Line - 9/20/2021 |
View all notes |
Set NEW NOTE alert |
Company Profile |
SEC
News |
Chart |
Request a new note
C
A
S
I |
ENTG
-
NASDAQ
Entegris Inc
ELECTRONICS - Semiconductor Equipment and Mate
|
$129.25
|
-0.41
-0.32% |
$130.84
|
562,714
79.03% of 50 DAV
50 DAV is 712,000
|
$135.99
-4.96%
|
8/4/2021
|
$125.33
|
PP = $126.51
|
|
MB = $132.84
|
Most Recent Note - 10/14/2021 6:30:15 PM
Y - Posted a big volume-driven gain today and its color code is changed to yellow. Found support near its 50 DMA line ($122) after damaging losses. Its prior low and 200 DMA line define the next important support in the $109 area.
>>> FEATURED STOCK ARTICLE : Hit New High and Rose Above its Max Buy Level - 9/23/2021 |
View all notes |
Set NEW NOTE alert |
Company Profile |
SEC
News |
Chart |
Request a new note
C
A
S
I |
CLFD
-
NASDAQ
Clearfield Inc
TELECOMMUNICATIONS - Cables / Satalite Equipment
|
$53.24
|
+0.56
1.06% |
$53.46
|
39,920
48.68% of 50 DAV
50 DAV is 82,000
|
$54.49
-2.29%
|
7/23/2021
|
$40.23
|
PP = $43.74
|
|
MB = $45.93
|
Most Recent Note - 10/18/2021 5:33:33 PM
G - Perched at its 52-week high, extended from the previously noted base. Prior highs in the $46 area define near-term support along with its 50 DMA line ($45.56) where damaging losses may trigger technical sell signals. Fundamentals remain strong. See the latest FSU analysis for more details and a new annotated graph.
>>> FEATURED STOCK ARTICLE : Extended From Prior Base After Latest Rally - 10/18/2021 |
View all notes |
Set NEW NOTE alert |
Company Profile |
SEC
News |
Chart |
Request a new note
C
A
S
I |
Symbol/Exchange
Company Name
Industry Group |
PRICE |
CHANGE
(%Change) |
Day High |
Volume
(% DAV)
(% 50 day avg vol) |
52 Wk Hi
% From Hi |
Featured
Date |
Price
Featured |
Pivot Featured |
|
Max Buy |
TGH
-
NYSE
Textainer Group Holdings
TRANSPORTATION - Logistics
|
$36.93
|
-0.79
-2.09% |
$38.12
|
402,377
88.82% of 50 DAV
50 DAV is 453,000
|
$38.84
-4.92%
|
10/7/2021
|
$36.97
|
PP = $36.80
|
|
MB = $38.64
|
Most Recent Note - 10/15/2021 12:41:12 PM
Y - Hitting a new 52-week high with today's volume-driven gain triggering a technical buy signal. Its 50 DMA line ($34.23) defines important near-term support to watch above recent lows in the $30-31 area. Fundamentals remain strong.
>>> FEATURED STOCK ARTICLE : Perched Near High With Strong Fundamentals - 10/7/2021 |
View all notes |
Set NEW NOTE alert |
Company Profile |
SEC
News |
Chart |
Request a new note
C
A
S
I |
SMPL
-
NASDAQ
Simply Good Foods Co
Food-Confectionery
|
$34.50
|
-0.73
-2.07% |
$35.18
|
191,972
59.23% of 50 DAV
50 DAV is 324,100
|
$38.50
-10.39%
|
12/28/2020
|
$30.40
|
PP = $31.44
|
|
MB = $33.01
|
Most Recent Note - 10/19/2021 5:25:11 PM
G - Its Relative Strength Rating has slumped to 74 while sputtering back below its 50 DMA line ($35.22). Recent low ($33.55 on 9/20/21) and 200 DMA line define important support where more damaging losses would raise greater concerns. Fundamentals remain strong.
>>> FEATURED STOCK ARTICLE : Consolidating Just Above 50-Day Moving Average Line - 10/12/2021 |
View all notes |
Set NEW NOTE alert |
Company Profile |
SEC
News |
Chart |
Request a new note
C
A
S
I |
WDAY
-
NYSE
Workday Inc Cl A
Computer Sftwr-Enterprse
|
$277.27
|
+4.60
1.69% |
$278.47
|
1,158,019
75.26% of 50 DAV
50 DAV is 1,538,600
|
$282.77
-1.95%
|
9/7/2021
|
$275.69
|
PP = $282.87
|
|
MB = $297.01
|
Most Recent Note - 10/19/2021 5:28:24 PM
Y - Posted another gain today with below average volume while challenging prior highs. Very little resistance remains due to overhead supply. Its 50 DMA line ($258).and recent lows ($246) define near-term support to watch where violations would raise concerns. Fundamentals remain strong.
>>> FEATURED STOCK ARTICLE : Rebounding From 50-Day Moving Average Toward Prior Highs - 10/13/2021 |
View all notes |
Set NEW NOTE alert |
Company Profile |
SEC
News |
Chart |
Request a new note
C
A
S
I |
CTLT
-
NYSE
Catalent Inc
DRUGS - Biotechnology
|
$133.22
|
+2.82
2.16% |
$133.94
|
595,496
67.82% of 50 DAV
50 DAV is 878,000
|
$142.64
-6.60%
|
8/25/2021
|
$128.72
|
PP = $127.78
|
|
MB = $134.17
|
Most Recent Note - 10/18/2021 5:35:13 PM
Y - Posted a gain today but remains below Its 50 DMA line ($131) which may act as resistance. Prior highs in the $124-127 area which define the next important near-term support to watch. Fundamentals remain strong.
>>> FEATURED STOCK ARTICLE : Found Support Near Prior High While Consolidating - 10/8/2021 |
View all notes |
Set NEW NOTE alert |
Company Profile |
SEC
News |
Chart |
Request a new note
C
A
S
I |
MEDP
-
NASDAQ
Medpace Holdings Inc
Medical-Research Eqp/Svc
|
$185.67
|
-0.15
-0.08% |
$189.98
|
86,912
53.55% of 50 DAV
50 DAV is 162,300
|
$199.04
-6.72%
|
9/10/2021
|
$196.32
|
PP = $196.22
|
|
MB = $206.03
|
Most Recent Note - 10/14/2021 6:22:43 PM
Y - Quietly slumped from near its 52-week high finding prompt support near its 50 DMA line ($185). More damaging losses would raise concerns. Pivot point cited was based on its 4/26/21 high plus 10 cents. Subsequent gains and strong close above the pivot point backed by at least +40% above average volume may trigger a technical buy signal. See the latest FSU analysis for more details and a new annotated graph.
>>> FEATURED STOCK ARTICLE : Found Prompt Support Near 50-Day Moving Average Line - 10/14/2021 |
View all notes |
Set NEW NOTE alert |
Company Profile |
SEC
News |
Chart |
Request a new note
C
A
S
I |
Symbol/Exchange
Company Name
Industry Group |
PRICE |
CHANGE
(%Change) |
Day High |
Volume
(% DAV)
(% 50 day avg vol) |
52 Wk Hi
% From Hi |
Featured
Date |
Price
Featured |
Pivot Featured |
|
Max Buy |
JEF
-
NYSE
Jefferies Financial Grp
Finance-Invest Bnk/Bkrs
|
$42.01
|
+0.03
0.07% |
$42.55
|
1,432,149
79.48% of 50 DAV
50 DAV is 1,802,000
|
$42.13
-0.28%
|
6/28/2021
|
$31.81
|
PP = $34.42
|
|
MB = $36.14
|
Most Recent Note - 10/18/2021 5:38:11 PM
G - Posted a 12th consecutive gain today for another new all-time high. Its 50 DMA line ($37) defines important near-term support to watch on pullbacks. Reported Aug '21 quarterly earnings +713% on +70% sales revenues versus the year ago period.
>>> FEATURED STOCK ARTICLE : Perched at 52-week High With Earnings News Due - 9/29/2021 |
View all notes |
Set NEW NOTE alert |
Company Profile |
SEC
News |
Chart |
Request a new note
C
A
S
I |
AVTR
-
NYSE
Avantor Inc
Medical-Research Eqp/Svc
|
$38.23
|
-0.33
-0.86% |
$39.07
|
2,956,109
77.18% of 50 DAV
50 DAV is 3,830,000
|
$44.37
-13.84%
|
6/10/2021
|
$32.94
|
PP = $34.09
|
|
MB = $35.79
|
Most Recent Note - 10/19/2021 5:20:40 PM
G - Still sputtering below its 50 DMA line ($40.37) and below the prior low ($39.24 on 10/01/21) after damaging volume-driven losses triggering technical sell signals. A rebound above the 50 DMA line is needed for its outlook to improve. Completed a Secondary Offering on 9/13/21 while perched at its all-time high, very extended from any sound base.
>>> FEATURED STOCK ARTICLE : Pulled Back Finding Support Near 50-Day Moving Average - 10/11/2021 |
View all notes |
Set NEW NOTE alert |
Company Profile |
SEC
News |
Chart |
Request a new note
C
A
S
I |
MIME
-
NASDAQ
Mimecast Limited
Computer Sftwr-Security
|
$68.00
|
-0.17
-0.25% |
$68.99
|
338,917
36.21% of 50 DAV
50 DAV is 936,000
|
$71.45
-4.83%
|
10/18/2021
|
$68.17
|
PP = $71.55
|
|
MB = $75.13
|
Most Recent Note - 10/18/2021 5:40:24 PM
Y - Rallied further above its 50 DMA line ($64.87) toward prior highs. Fundamentals remain strong. Color code is changed to yellow with new pivot point cited based on its 9/03/21 high plus 10 cents.
>>> FEATURED STOCK ARTICLE : Consolidating After Getting Extended from Previous Base Noted - 9/21/2021 |
View all notes |
Set NEW NOTE alert |
Company Profile |
SEC
News |
Chart |
Request a new note
C
A
S
I |
|
|
|
THESE ARE NOT BUY RECOMMENDATIONS!
Comments contained in the body of this report are technical
opinions only. The material herein has been obtained
from sources believed to be reliable and accurate, however,
its accuracy and completeness cannot be guaranteed.
This site is not an investment advisor, hence it does
not endorse or recommend any securities or other investments.
Any recommendation contained in this report may not
be suitable for all investors and it is not to be deemed
an offer or solicitation on our part with respect to
the purchase or sale of any securities. All trademarks,
service marks and trade names appearing in this report
are the property of their respective owners, and are
likewise used for identification purposes only.
This report is a service available
only to active Paid Premium Members.
You may opt-out of receiving report notifications
at any time. Questions or comments may be submitted
by writing to Premium Membership Services 665 S.E. 10 Street, Suite 201 Deerfield Beach, FL 33441-5634 or by calling 1-800-965-8307
or 954-785-1121.
|
|
|