You are not logged in.
This means you
CAN ONLY VIEW reports that were published prior to Monday, March 31, 2025.
You
MUST UPGRADE YOUR MEMBERSHIP if you want to see any current reports.
AFTER MARKET UPDATE - MONDAY, OCTOBER 18TH, 2021
Previous After Market Report Next After Market Report >>>
|
|
|
|
DOW |
-36.15 |
35,258.61 |
-0.10% |
|
Volume |
778,819,101 |
-21% |
|
Volume |
4,123,316,400 |
-7% |
|
NASDAQ |
+124.47 |
15,021.81 |
+0.84% |
|
Advancers |
1,566 |
48% |
|
Advancers |
2,011 |
45% |
|
S&P 500 |
+15.09 |
4,486.46 |
+0.34% |
|
Decliners |
1,669 |
52% |
|
Decliners |
2,424 |
55% |
|
Russell 2000 |
+2.19 |
2,267.84 |
+0.10% |
|
52 Wk Highs |
141 |
|
|
52 Wk Highs |
94 |
|
|
S&P 600 |
+3.83 |
1,367.74 |
+0.28% |
|
52 Wk Lows |
47 |
|
|
52 Wk Lows |
137 |
|
|
 |
Major Average Rose With Lighter Volume and Less Leadership
Kenneth J. Gruneisen - Passed the CAN SLIM® Master's Exam
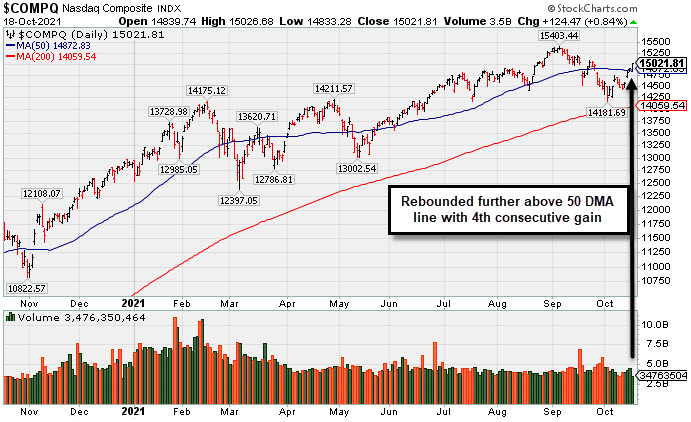
The S&P 500 rose 0.3%, coming off its best week in three months (+1.8%). The benchmark index is back within 1.2% of its most recent September 2 record high, having advanced for a fourth consecutive session. The Nasdaq Composite jumped 0.8% amid strength in tech and growth-related shares. The Dow lost 36 points. The volume totals reported were lighter than the prior session on the NYSE and on the Nasdaq exchange, as Friday's totals were inflated by options expirations. Decliners led advancers by a narrow margin on the NYSE and on the Nasdaq exchange. There were 53 high-ranked companies from the Leaders List that hit new 52-week highs and were listed on the BreakOuts Page versus the total of 89 on the prior session. New 52-week highs outnumbered new 52-week lows on the NYSE but new lows expanded and outnumbered new highs again on the Nasdaq exchange. The solid gains on Thursday met the definition of a follow-through day confirming a new rally for the major indices (M criteria). Investors are reminded to only make proper new buys as per the fundamental and technical rules of the fact-based investment system.
PICTURED: The Nasdaq Composite Index rebounded further above its 50-day moving average (DMA) line with Monday's 4th consecutive gain. Disciplined investors following the fact-based investment system may note that Thursday's session was a proper follow-through day - which requires a solid gain from at least one of the major averages backed by higher volume and coupled with an expansion in the number of stocks hitting new highs.
U.S. stocks finished mostly higher on Monday as investors looked toward a busy week of earnings and appeared to brush off disappointing economic data. Seven of 11 S&P 500 sectors closed in positive territory, with Technology among the outperforming groups. Apple (AAPL +1.18%) rose after highlighting its faster homegrown chips at a product event. Elsewhere, Walt Disney (DIS -3.01%) fell on the heels of an analyst downgrade. Health Care shares lagged, with medical device maker Medtronic (MDT -5.50%) fell following downbeat guidance on one of its products.
On the data front, industrial production unexpectedly contracted 1.3% in September, the biggest drop since February as supply chain bottlenecks dampened output. Separately, a gauge of homebuilder sentiment hit a three-month high in October. Also garnering attention overseas, an update on China’s third-quarter GDP showed the world’s second largest economy grew at the slowest pace in a year during the third quarter. Treasuries declined, with the yield on the 10-year notes up two basis points to 1.59%. Meanwhile, perceived hawkish commentary from Bank of England Governor Bailey caught headlines, as he signaled that Britain’s central bank could begin raising rates in order to tame inflation. In commodities, WTI crude gained 0.2% to $82.43/barrel, having eased from a seven-year peak touched in earlier trading. |
 Kenneth J. Gruneisen started out as a licensed stockbroker in August 1987, a couple of months prior to the historic stock market crash that took the Dow Jones Industrial Average down -22.6% in a single day. He has published daily fact-based fundamental and technical analysis on high-ranked stocks online for two decades. Through FACTBASEDINVESTING.COM, Kenneth provides educational articles, news, market commentary, and other information regarding proven investment systems that work in good times and bad.
Comments contained in the body of this report are technical opinions only and are not necessarily those of Gruneisen Growth Corp. The material herein has been obtained from sources believed to be reliable and accurate, however, its accuracy and completeness cannot be guaranteed. Our firm, employees, and customers may effect transactions, including transactions contrary to any recommendation herein, or have positions in the securities mentioned herein or options with respect thereto. Any recommendation contained in this report may not be suitable for all investors and it is not to be deemed an offer or solicitation on our part with respect to the purchase or sale of any securities. |
|
 |
Retail, Financial, Semiconductor and Oil Services Indexes Rose
Kenneth J. Gruneisen - Passed the CAN SLIM® Master's Exam
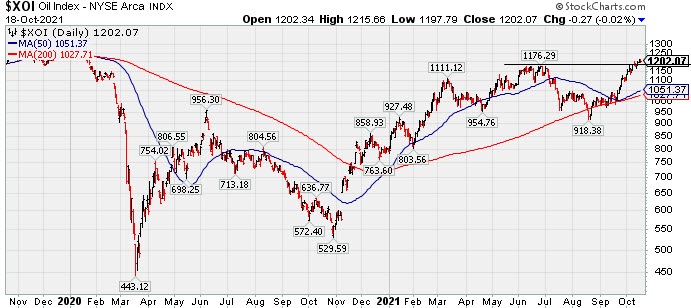
The Retail Index ($RLX +1.23%) posted a solid gain and financials also had a positive influence on the major averages as the Bank Index ($BKX +0.46%) and Broker/Dealer Index ($XBD +0.30%) both edged higher. The tech sector was mixed as the Semiconductor Index ($SOX +0.74%) rose while the Biotech Index ($BTK -1.74%) outpaced the Networking Index ($NWX -0.87%) to the downside. The Oil Services Index ($OSX +0.87%) posted a solid gain while the Integrated Oil Index ($XOI -0.02%) finished flat and the Gold & Silver Index ($XAU -1.16%) suffered a loss.
PICTURED: The Integrated Oil Index ($XOI -0.02%) recently rallied to new multi-year highs.
| Oil Services |
$OSX |
65.43 |
+0.57 |
+0.87% |
+47.59% |
| Integrated Oil |
$XOI |
1,202.07 |
-0.27 |
-0.02% |
+51.68% |
| Semiconductor |
$SOX |
3,338.78 |
+24.37 |
+0.74% |
+19.43% |
| Networking |
$NWX |
835.21 |
-7.33 |
-0.87% |
+16.47% |
| Broker/Dealer |
$XBD |
495.03 |
+1.49 |
+0.30% |
+31.10% |
| Retail |
$RLX |
4,115.18 |
+49.91 |
+1.23% |
+15.49% |
| Gold & Silver |
$XAU |
130.53 |
-1.53 |
-1.16% |
-9.47% |
| Bank |
$BKX |
137.65 |
+0.63 |
+0.46% |
+40.59% |
| Biotech |
$BTK |
5,537.43 |
-97.91 |
-1.74% |
-3.51% |
|
|
|
 |
Extended From Prior Base After Latest Rally
Kenneth J. Gruneisen - Passed the CAN SLIM® Master's Exam
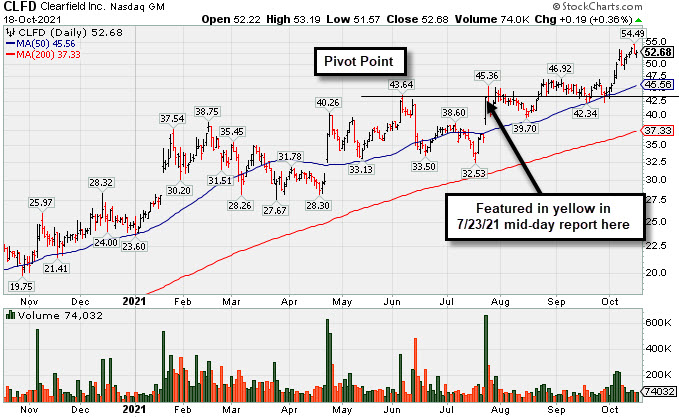
Clearfield Inc (CLFD +$0.19 or +0.36% to $52.68) is perched at its 52-week high, extended from the previously noted base. Near term support to watch is defined by prior highs in the $46 area and its 50-day moving average (DMA) line ($45.56). Any damaging losses may trigger technical sell signals. Fundamentals remain strong.
CLFD was most recently highlighted in yellow again in the 7/23/21 mid-day report (read here) with new pivot point cited based on its 6/07/21 high plus 10 cents. It was last shown in detail in this FSU section on 9/14/21 with an annotated graph under the headline "Quietly Consolidating Near All-Time High". The latest bullish action came after it reported Jun '21 quarterly earnings +100% on +49% sales revenues versus the year ago period, continuing its strong earnings track record. The high-ranked TELECOMMUNICATIONS - Fiber Optics firm has reported 6 consecutive quarterly earnings comparisons above the +25% minimum guideline (C criteria). Annual earnings (A criteria) history has improved after a downturn in FY '17.
CLFD traded up more than 145% since first highlighted in yellow with pivot point cited based on its 11/09/20 high plus 10 cents in the 11/17/20 mid-day report (read here). There are only 13.7 million shares outstanding (S criteria) which can contribute to greater price volatility in the event of institutional buying or selling. The number of top-rated funds owning its shares rose from 132 in Jun '20 to 200 in Sep '21. Its current Up/Down Volume Ratio of 2.2 is an unbiased indication its shares have been under accumulation over the past 50 days. Its Accumulation/Distribution Rating is A- and Timeliness Rating is A, but its Sponsorship Rating is D.
|
|
|
Color Codes Explained :
Y - Better candidates highlighted by our
staff of experts.
G - Previously featured
in past reports as yellow but may no longer be buyable under the
guidelines.
***Last / Change / Volume data in this table is the closing quote data***
Symbol/Exchange
Company Name
Industry Group |
PRICE |
CHANGE
(%Change) |
Day High |
Volume
(% DAV)
(% 50 day avg vol) |
52 Wk Hi
% From Hi |
Featured
Date |
Price
Featured |
Pivot Featured |
|
Max Buy |
 SIVB
-
NASDAQ
SIVB
-
NASDAQ
S V B Financial Group
BANKING - Regional - Pacific Banks
|
$696.08
|
+5.75
0.83% |
$697.95
|
299,127
74.41% of 50 DAV
50 DAV is 402,000
|
$695.59
0.07%
|
8/6/2021
|
$589.70
|
PP = $608.94
|
|
MB = $639.39
|
Most Recent Note - 10/12/2021 5:43:56 PM
G - There was a "negative reversal" on the prior session after hitting a new all-time high. Extended from the previously noted base, the prior highs in the $608 area define initial support to watch above its 50 DMA line ($600). Completed a new Public Offering on 8/11/21.
>>> FEATURED STOCK ARTICLE : Pullback After 5 Straight Gains into New High Territory - 9/28/2021 |
View all notes |
Set NEW NOTE alert |
Company Profile |
SEC
News |
Chart |
Request a new note
C
A
S
I |
BLDR
-
NYSE
Builders Firstsource Inc
Bldg-Constr Prds/Misc
|
$57.82
|
+0.75
1.31% |
$58.23
|
1,718,167
86.38% of 50 DAV
50 DAV is 1,989,000
|
$57.93
-0.19%
|
8/12/2021
|
$52.38
|
PP = $54.09
|
|
MB = $56.79
|
Most Recent Note - 10/14/2021 6:13:34 PM
Y - Posted an 8th consecutive gain today for a new all-time high and it closed near its "max buy" level. Gains did not have the +40% above average volume needed to trigger a proper technical buy signal. Fundamentals remain strong.
>>> FEATURED STOCK ARTICLE : Sputtering After Wedging to New Highs - 10/1/2021 |
View all notes |
Set NEW NOTE alert |
Company Profile |
SEC
News |
Chart |
Request a new note
C
A
S
I |
KFRC
-
NASDAQ
Kforce Inc
Comml Svcs-Staffing
|
$64.53
|
+0.15
0.23% |
$64.69
|
54,947
48.20% of 50 DAV
50 DAV is 114,000
|
$69.00
-6.48%
|
9/10/2021
|
$59.53
|
PP = $64.48
|
|
MB = $67.70
|
Most Recent Note - 10/15/2021 5:07:14 PM
Y - Pulled back today with near average volume 3rd consecutive loss. Stalled since its 10/07/21 gain for a new all-time high backed by +58% above average volume triggered a technical buy signal. Fundamentals are strong. See the latest FSU analysis for more details and a new annotated graph.
>>> FEATURED STOCK ARTICLE : Pulling Back Near Prior Highs Following Technical Breakout - 10/15/2021 |
View all notes |
Set NEW NOTE alert |
Company Profile |
SEC
News |
Chart |
Request a new note
C
A
S
I |
GNRC
-
NYSE
Generac Hldgs Inc
Electrical-Power/Equipmt
|
$470.02
|
+18.08
4.00% |
$470.80
|
788,840
129.32% of 50 DAV
50 DAV is 610,000
|
$466.92
0.66%
|
8/30/2021
|
$449.36
|
PP = $457.10
|
|
MB = $479.96
|
 Most Recent Note - 10/18/2021 5:37:05 PM
Y -Hit a new 52-week high with today's gain backed by +28% above average volume. A gain and close above the pivot point must be backed by at least +40% above average volume to trigger a proper technical buy signal.
>>> FEATURED STOCK ARTICLE : Prior Lows Define Near-Term Support After 50 DMA Violation - 10/6/2021 |
View all notes |
Set NEW NOTE alert |
Company Profile |
SEC
News |
Chart |
Request a new note
C
A
S
I |
CAMT
-
NASDAQ
Camtek Ltd
ELECTRONICS - Scientific and Technical Instrum
|
$39.24
|
+0.70
1.82% |
$39.34
|
109,800
70.38% of 50 DAV
50 DAV is 156,000
|
$46.01
-14.71%
|
8/4/2021
|
$39.67
|
PP = $40.57
|
|
MB = $42.60
|
Most Recent Note - 10/15/2021 5:09:18 PM
G - Volume totals have been cooling while still sputtering below its 50 DMA line ($40.05). The prior low ($34.68 on 8/17/21) defines the next important near-term support to watch. A rebound above the 50 DMA line is needed for its outlook to improve. Fundamentals remain strong.
>>> FEATURED STOCK ARTICLE : Fell Below Prior High and Violated 50-Day Moving Average - 10/5/2021 |
View all notes |
Set NEW NOTE alert |
Company Profile |
SEC
News |
Chart |
Request a new note
C
A
S
I |
Symbol/Exchange
Company Name
Industry Group |
PRICE |
CHANGE
(%Change) |
Day High |
Volume
(% DAV)
(% 50 day avg vol) |
52 Wk Hi
% From Hi |
Featured
Date |
Price
Featured |
Pivot Featured |
|
Max Buy |
PKI
-
NYSE
Perkinelmer Inc
ELECTRONICS - Scientific and Technical Instrum
|
$170.39
|
+0.57
0.34% |
$170.76
|
530,651
81.89% of 50 DAV
50 DAV is 648,000
|
$192.00
-11.26%
|
8/18/2021
|
$181.07
|
PP = $188.50
|
|
MB = $197.93
|
Most Recent Note - 10/12/2021 5:47:58 PM
G - Suffered a 3rd consecutive loss. A rebound above the 50 DMA line ($181.78) is needed for its outlook to improve. Its Relative Strength Rating has slumped to 78. Fundamentals remain strong.
>>> FEATURED STOCK ARTICLE : Stalled But Holding Ground After Recent "3 Weeks Tight" - 9/17/2021 |
View all notes |
Set NEW NOTE alert |
Company Profile |
SEC
News |
Chart |
Request a new note
C
A
S
I |
UMC
-
NYSE
United Microelectrnc Adr
ELECTRONICS - Semiconductor - Integrated Cir
|
$10.38
|
-0.01
-0.10% |
$10.39
|
6,433,762
89.53% of 50 DAV
50 DAV is 7,186,000
|
$12.62
-17.75%
|
8/5/2021
|
$11.62
|
PP = $11.38
|
|
MB = $11.95
|
Most Recent Note - 10/14/2021 6:27:36 PM
G - Posted a small gain today after 4 consecutive losses slumping near its 200 DMA line ($9.82). A rebound above the 50 DMA line ($11.23) is needed for its outlook to improve.
>>> FEATURED STOCK ARTICLE : Consolidating Above 50-day Moving Average Near "Max Buy" Level - 9/27/2021 |
View all notes |
Set NEW NOTE alert |
Company Profile |
SEC
News |
Chart |
Request a new note
C
A
S
I |
BRKS
-
NASDAQ
Brooks Automation
ELECTRONICS - Semiconductor Equipment and Mate
|
$104.47
|
+1.02
0.99% |
$104.56
|
297,818
47.20% of 50 DAV
50 DAV is 631,000
|
$110.40
-5.37%
|
9/20/2021
|
$101.21
|
PP = $108.82
|
|
MB = $114.26
|
Most Recent Note - 10/14/2021 6:15:05 PM
Y - Posted a gain today with lighter than average volume. Still perched within striking distance of its 52-week high. Pivot point cited was based on its 4/27/21 high plus 10 cents. Subsequent gains above the pivot point or prior highs backed by at least 40% above average volume may trigger a convincing technical buy signal.
>>> FEATURED STOCK ARTICLE : Rallying Near High After Brief Consolidation Below 200 DMA Line - 9/20/2021 |
View all notes |
Set NEW NOTE alert |
Company Profile |
SEC
News |
Chart |
Request a new note
C
A
S
I |
ENTG
-
NASDAQ
Entegris Inc
ELECTRONICS - Semiconductor Equipment and Mate
|
$129.66
|
-0.32
-0.25% |
$129.79
|
645,158
91.25% of 50 DAV
50 DAV is 707,000
|
$135.99
-4.65%
|
8/4/2021
|
$125.33
|
PP = $126.51
|
|
MB = $132.84
|
Most Recent Note - 10/14/2021 6:30:15 PM
Y - Posted a big volume-driven gain today and its color code is changed to yellow. Found support near its 50 DMA line ($122) after damaging losses. Its prior low and 200 DMA line define the next important support in the $109 area.
>>> FEATURED STOCK ARTICLE : Hit New High and Rose Above its Max Buy Level - 9/23/2021 |
View all notes |
Set NEW NOTE alert |
Company Profile |
SEC
News |
Chart |
Request a new note
C
A
S
I |
CLFD
-
NASDAQ
Clearfield Inc
TELECOMMUNICATIONS - Cables / Satalite Equipment
|
$52.68
|
+0.19
0.36% |
$53.19
|
73,907
90.13% of 50 DAV
50 DAV is 82,000
|
$54.49
-3.32%
|
7/23/2021
|
$40.23
|
PP = $43.74
|
|
MB = $45.93
|
Most Recent Note - 10/18/2021 5:33:33 PM
G - Perched at its 52-week high, extended from the previously noted base. Prior highs in the $46 area define near-term support along with its 50 DMA line ($45.56) where damaging losses may trigger technical sell signals. Fundamentals remain strong. See the latest FSU analysis for more details and a new annotated graph.
>>> FEATURED STOCK ARTICLE : Extended From Prior Base After Latest Rally - 10/18/2021 |
View all notes |
Set NEW NOTE alert |
Company Profile |
SEC
News |
Chart |
Request a new note
C
A
S
I |
Symbol/Exchange
Company Name
Industry Group |
PRICE |
CHANGE
(%Change) |
Day High |
Volume
(% DAV)
(% 50 day avg vol) |
52 Wk Hi
% From Hi |
Featured
Date |
Price
Featured |
Pivot Featured |
|
Max Buy |
TGH
-
NYSE
Textainer Group Holdings
TRANSPORTATION - Logistics
|
$37.72
|
+0.69
1.86% |
$38.81
|
446,402
96.83% of 50 DAV
50 DAV is 461,000
|
$38.84
-2.88%
|
10/7/2021
|
$36.97
|
PP = $36.80
|
|
MB = $38.64
|
Most Recent Note - 10/15/2021 12:41:12 PM
Y - Hitting a new 52-week high with today's volume-driven gain triggering a technical buy signal. Its 50 DMA line ($34.23) defines important near-term support to watch above recent lows in the $30-31 area. Fundamentals remain strong.
>>> FEATURED STOCK ARTICLE : Perched Near High With Strong Fundamentals - 10/7/2021 |
View all notes |
Set NEW NOTE alert |
Company Profile |
SEC
News |
Chart |
Request a new note
C
A
S
I |
SMPL
-
NASDAQ
Simply Good Foods Co
Food-Confectionery
|
$35.23
|
+0.22
0.63% |
$35.45
|
174,914
53.44% of 50 DAV
50 DAV is 327,300
|
$38.50
-8.49%
|
12/28/2020
|
$30.40
|
PP = $31.44
|
|
MB = $33.01
|
Most Recent Note - 10/12/2021 5:39:46 PM
G - Consolidating just above its 50 DMA line ($35.37). Its Relative Strength Rating has slumped to 78. Recent low ($33.55 on 9/20/21) and 200 DMA line define important support where more damaging losses would raise greater concerns. Fundamentals remain strong. See the latest FSU analysis for more details and a new annotated graph.
>>> FEATURED STOCK ARTICLE : Consolidating Just Above 50-Day Moving Average Line - 10/12/2021 |
View all notes |
Set NEW NOTE alert |
Company Profile |
SEC
News |
Chart |
Request a new note
C
A
S
I |
WDAY
-
NYSE
Workday Inc Cl A
Computer Sftwr-Enterprse
|
$272.67
|
+1.68
0.62% |
$273.04
|
837,056
54.27% of 50 DAV
50 DAV is 1,542,300
|
$282.77
-3.57%
|
9/7/2021
|
$275.69
|
PP = $282.87
|
|
MB = $297.01
|
Most Recent Note - 10/13/2021 6:16:10 PM
Y - Gapped up today, but encountered pressure and ended near the middle of its intra-day range after larger early gains. Its 50 DMA line ($255).and recent lows ($246) define near-term support to watch where violations would raise concerns. Faces resistance due to overhead supply up to the $278 level after trading higher for the past month. Fundamentals remain strong. See the latest FSU analysis for more details and a new annotated graph.
>>> FEATURED STOCK ARTICLE : Rebounding From 50-Day Moving Average Toward Prior Highs - 10/13/2021 |
View all notes |
Set NEW NOTE alert |
Company Profile |
SEC
News |
Chart |
Request a new note
C
A
S
I |
CTLT
-
NYSE
Catalent Inc
DRUGS - Biotechnology
|
$130.40
|
+1.63
1.27% |
$130.61
|
780,730
89.12% of 50 DAV
50 DAV is 876,000
|
$142.64
-8.58%
|
8/25/2021
|
$128.72
|
PP = $127.78
|
|
MB = $134.17
|
Most Recent Note - 10/18/2021 5:35:13 PM
Y - Posted a gain today but remains below Its 50 DMA line ($131) which may act as resistance. Prior highs in the $124-127 area which define the next important near-term support to watch. Fundamentals remain strong.
>>> FEATURED STOCK ARTICLE : Found Support Near Prior High While Consolidating - 10/8/2021 |
View all notes |
Set NEW NOTE alert |
Company Profile |
SEC
News |
Chart |
Request a new note
C
A
S
I |
MEDP
-
NASDAQ
Medpace Holdings Inc
Medical-Research Eqp/Svc
|
$185.82
|
-1.26
-0.67% |
$187.12
|
114,800
70.52% of 50 DAV
50 DAV is 162,800
|
$199.04
-6.64%
|
9/10/2021
|
$196.32
|
PP = $196.22
|
|
MB = $206.03
|
Most Recent Note - 10/14/2021 6:22:43 PM
Y - Quietly slumped from near its 52-week high finding prompt support near its 50 DMA line ($185). More damaging losses would raise concerns. Pivot point cited was based on its 4/26/21 high plus 10 cents. Subsequent gains and strong close above the pivot point backed by at least +40% above average volume may trigger a technical buy signal. See the latest FSU analysis for more details and a new annotated graph.
>>> FEATURED STOCK ARTICLE : Found Prompt Support Near 50-Day Moving Average Line - 10/14/2021 |
View all notes |
Set NEW NOTE alert |
Company Profile |
SEC
News |
Chart |
Request a new note
C
A
S
I |
Symbol/Exchange
Company Name
Industry Group |
PRICE |
CHANGE
(%Change) |
Day High |
Volume
(% DAV)
(% 50 day avg vol) |
52 Wk Hi
% From Hi |
Featured
Date |
Price
Featured |
Pivot Featured |
|
Max Buy |
JEF
-
NYSE
Jefferies Financial Grp
Finance-Invest Bnk/Bkrs
|
$41.98
|
+0.35
0.84% |
$42.08
|
2,105,141
118.13% of 50 DAV
50 DAV is 1,782,000
|
$42.13
-0.36%
|
6/28/2021
|
$31.81
|
PP = $34.42
|
|
MB = $36.14
|
Most Recent Note - 10/18/2021 5:38:11 PM
G - Posted a 12th consecutive gain today for another new all-time high. Its 50 DMA line ($37) defines important near-term support to watch on pullbacks. Reported Aug '21 quarterly earnings +713% on +70% sales revenues versus the year ago period.
>>> FEATURED STOCK ARTICLE : Perched at 52-week High With Earnings News Due - 9/29/2021 |
View all notes |
Set NEW NOTE alert |
Company Profile |
SEC
News |
Chart |
Request a new note
C
A
S
I |
AVTR
-
NYSE
Avantor Inc
Medical-Research Eqp/Svc
|
$38.56
|
+0.21
0.55% |
$38.74
|
2,003,283
52.25% of 50 DAV
50 DAV is 3,834,000
|
$44.37
-13.09%
|
6/10/2021
|
$32.94
|
PP = $34.09
|
|
MB = $35.79
|
Most Recent Note - 10/12/2021 12:00:13 PM
G - Gapped down today violating its 50 DMA line ($40.39) and also undercutting the recent low ($39.24 on 10/01/21) with a damaging volume-driven loss triggering technical sell signals. Completed a Secondary Offering on 9/13/21 while perched at its all-time high, very extended from any sound base.
>>> FEATURED STOCK ARTICLE : Pulled Back Finding Support Near 50-Day Moving Average - 10/11/2021 |
View all notes |
Set NEW NOTE alert |
Company Profile |
SEC
News |
Chart |
Request a new note
C
A
S
I |
MIME
-
NASDAQ
Mimecast Limited
Computer Sftwr-Security
|
$68.17
|
+2.82
4.32% |
$68.48
|
560,316
60.06% of 50 DAV
50 DAV is 933,000
|
$71.45
-4.59%
|
10/18/2021
|
$68.17
|
PP = $71.55
|
|
MB = $75.13
|
Most Recent Note - 10/18/2021 5:40:24 PM
Y - Rallied further above its 50 DMA line ($64.87) toward prior highs. Fundamentals remain strong. Color code is changed to yellow with new pivot point cited based on its 9/03/21 high plus 10 cents.
>>> FEATURED STOCK ARTICLE : Consolidating After Getting Extended from Previous Base Noted - 9/21/2021 |
View all notes |
Set NEW NOTE alert |
Company Profile |
SEC
News |
Chart |
Request a new note
C
A
S
I |
|
|
|
THESE ARE NOT BUY RECOMMENDATIONS!
Comments contained in the body of this report are technical
opinions only. The material herein has been obtained
from sources believed to be reliable and accurate, however,
its accuracy and completeness cannot be guaranteed.
This site is not an investment advisor, hence it does
not endorse or recommend any securities or other investments.
Any recommendation contained in this report may not
be suitable for all investors and it is not to be deemed
an offer or solicitation on our part with respect to
the purchase or sale of any securities. All trademarks,
service marks and trade names appearing in this report
are the property of their respective owners, and are
likewise used for identification purposes only.
This report is a service available
only to active Paid Premium Members.
You may opt-out of receiving report notifications
at any time. Questions or comments may be submitted
by writing to Premium Membership Services 665 S.E. 10 Street, Suite 201 Deerfield Beach, FL 33441-5634 or by calling 1-800-965-8307
or 954-785-1121.
|
|
|