You are not logged in.
This means you
CAN ONLY VIEW reports that were published prior to Monday, February 3, 2025.
You
MUST UPGRADE YOUR MEMBERSHIP if you want to see any current reports.
AFTER MARKET UPDATE - THURSDAY, OCTOBER 21ST, 2021
Previous After Market Report Next After Market Report >>>
|
|
|
|
DOW |
-6.26 |
35,603.08 |
-0.02% |
|
Volume |
829,082,248 |
+12% |
|
Volume |
4,809,247,300 |
+19% |
|
NASDAQ |
+94.02 |
15,215.70 |
+0.62% |
|
Advancers |
1,506 |
47% |
|
Advancers |
2,233 |
50% |
|
S&P 500 |
+13.59 |
4,549.78 |
+0.30% |
|
Decliners |
1,701 |
53% |
|
Decliners |
2,200 |
50% |
|
Russell 2000 |
+6.42 |
2,296.18 |
+0.28% |
|
52 Wk Highs |
169 |
|
|
52 Wk Highs |
177 |
|
|
S&P 600 |
+2.16 |
1,380.47 |
+0.16% |
|
52 Wk Lows |
47 |
|
|
52 Wk Lows |
69 |
|
|
 |
Breadth Was Mixed as Dow Lagged Other Major Indices
Kenneth J. Gruneisen - Passed the CAN SLIM® Master's Exam
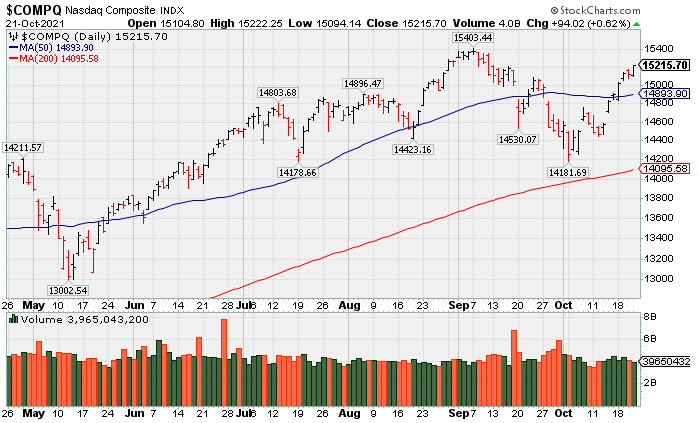
The S&P 500 gained 0.3%, closing at a fresh all-time high for the first time since September 2. The Dow lost 6 points, within striking distance (0.1%) of its most recent August 16 record close. The Nasdaq Composite resumed its uptrend, rising 0.6%. The volume totals reported were higher than the prior session on the NYSE and on the Nasdaq exchange. Decliners led advancers by a narrow margin on the NYSE while the mix was even on the Nasdaq exchange. There were 87 high-ranked companies from the Leaders List that hit new 52-week highs and were listed on the BreakOuts Page versus the total of 77 on the prior session. New 52-week highs outnumbered new 52-week lows totals on both the NYSE and the Nasdaq exchange. The solid gains last Thursday met the definition of a follow-through day confirming a new rally for the major indices (M criteria). Investors are reminded to only make proper new buys as per the fundamental and technical rules of the fact-based investment system.
PICTURED: The Nasdaq Composite Index is rebounding toward its record high. Disciplined investors following the fact-based investment system may note that Thursday's session was a proper follow-through day - which requires a solid gain from at least one of the major averages backed by higher volume and coupled with an expansion in the number of stocks hitting new highs.
U.S. stocks finished mostly higher on Thursday as investors digested another round of corporate earnings and monitored a spike in Treasury yields. Seven of 11 S&P 500 sectors closed in positive territory, with the Consumer Discretionary group outperforming. Tesla (TSLA +3.26%) rose to a new record high close after the electric vehicle maker posted a profit for the ninth straight quarter. Elsewhere, IBM (IBM -9.56%) gapped down violating its 200 DMA line following softer-than-expected revenue figures, weighed down by weak orders in one business segment ahead of next month’s spinoff. In other corporate news, HP Inc. (HPQ +6.93%) rose after the computer and printer maker increased its dividend and lifted its 2022 guidance.
Concerns about more persistent price pressures were evident in the fact that the largest ever auction of five-year Treasury inflation-protected securities (TIPS) saw a record low yield amid robust demand. Subsequently, a measure of inflationary expectations over the next five years reached its highest point since 2005. Treasuries dropped, with the yield on the 10-year note up four basis points to 1.68%, a peak not reached since May. The two-year note yield spiked six basis points to 0.44%, its highest level since March 2020 amid growing expectations that the Fed could begin raising interest rates sooner than previously anticipated. On the data front, weekly initial jobless claims came in at a fresh pandemic low of 290,000. |
 Kenneth J. Gruneisen started out as a licensed stockbroker in August 1987, a couple of months prior to the historic stock market crash that took the Dow Jones Industrial Average down -22.6% in a single day. He has published daily fact-based fundamental and technical analysis on high-ranked stocks online for two decades. Through FACTBASEDINVESTING.COM, Kenneth provides educational articles, news, market commentary, and other information regarding proven investment systems that work in good times and bad.
Comments contained in the body of this report are technical opinions only and are not necessarily those of Gruneisen Growth Corp. The material herein has been obtained from sources believed to be reliable and accurate, however, its accuracy and completeness cannot be guaranteed. Our firm, employees, and customers may effect transactions, including transactions contrary to any recommendation herein, or have positions in the securities mentioned herein or options with respect thereto. Any recommendation contained in this report may not be suitable for all investors and it is not to be deemed an offer or solicitation on our part with respect to the purchase or sale of any securities. |
|
 |
Retail and Tech Indices Rose
Kenneth J. Gruneisen - Passed the CAN SLIM® Master's Exam
The Broker/Dealer Index ($XBD -0.36%) and Bank Index ($BKX -0.70%) both lost ground and weighed on the major averages. The tech sector had a positive bias as the Semiconductor Index ($SOX +1.12%), Biotech Index ($BTK +0.49%), and Networking Index ($NWX +0.23%) each posted gains. The Oil Services Index ($OSX -2.52%) and Integrated Oil Index ($XOI -1.67%) lost ground and the Gold & Silver Index ($XAU -0.20%) also edged lower.
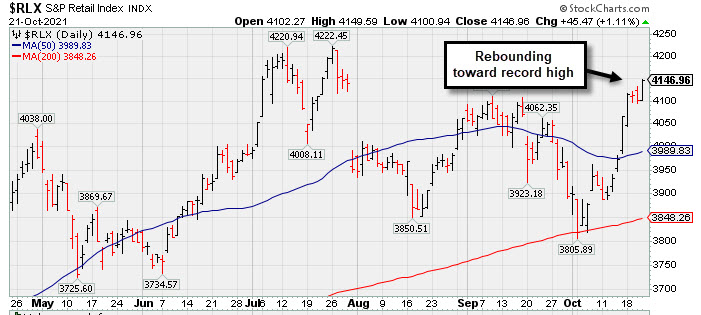
PICTURED: The Retail Index ($RLX +1.11%) is rebounding toward prior highs.
| Oil Services |
$OSX |
64.61 |
-1.67 |
-2.52% |
+45.74% |
| Integrated Oil |
$XOI |
1,204.50 |
-20.46 |
-1.67% |
+51.99% |
| Semiconductor |
$SOX |
3,412.05 |
+37.83 |
+1.12% |
+22.06% |
| Networking |
$NWX |
849.47 |
+1.96 |
+0.23% |
+18.46% |
| Broker/Dealer |
$XBD |
498.21 |
-1.79 |
-0.36% |
+31.94% |
| Retail |
$RLX |
4,146.96 |
+45.47 |
+1.11% |
+16.38% |
| Gold & Silver |
$XAU |
133.51 |
-0.27 |
-0.20% |
-7.41% |
| Bank |
$BKX |
140.57 |
-0.99 |
-0.70% |
+43.57% |
| Biotech |
$BTK |
5,629.77 |
+27.38 |
+0.49% |
-1.90% |
|
|
|
 |
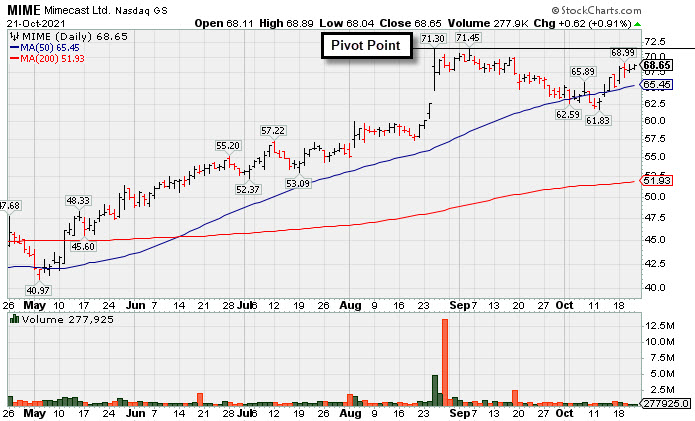
MIME Consolidating Less Than 4% Off High Building New Base
Kenneth J. Gruneisen - Passed the CAN SLIM® Master's Exam
Mimecast Limited (MIME +$0.62 or +0.91% to $68.65) is consolidating above its 50-day moving average (DMA) line ($65.45) and near prior highs. Fundamentals remain strong. Its color code was recently changed to yellow with new pivot point cited based on its 9/03/21 high plus 10 cents. Subsequent gains above the pivot point backed by at least +40% above average volume may trigger a new (or add-on) technical buy signal.
The company has a 96 Earnings Per Share Rating. Bullish action came after reporting Jun '21 quarterly earnings +45% on +24% sales revenues versus the year ago period. Quarterly and annual earnings (C and A criteria) history has been strong after a loss in FY '18.
The Computer Software-Security firm has only 65.7 million shares outstanding (S criteria). The number of top-rated funds owning its share rise from 383 in Dec '20 to 485 as of Sep '21, a reassuring sign concerning the I criteria. Its current Up/Down Volume Ratio of 0.7is an unbiased indication its shares have been under slight distributional pressure over the past 50 days. It has a Timeliness Rating of B and Sponsorship Rating of C.
|
|
|
Color Codes Explained :
Y - Better candidates highlighted by our
staff of experts.
G - Previously featured
in past reports as yellow but may no longer be buyable under the
guidelines.
***Last / Change / Volume data in this table is the closing quote data***
Symbol/Exchange
Company Name
Industry Group |
PRICE |
CHANGE
(%Change) |
Day High |
Volume
(% DAV)
(% 50 day avg vol) |
52 Wk Hi
% From Hi |
Featured
Date |
Price
Featured |
Pivot Featured |
|
Max Buy |
 SIVB
-
NASDAQ
SIVB
-
NASDAQ
S V B Financial Group
BANKING - Regional - Pacific Banks
|
$705.14
|
-0.13
-0.02% |
$707.42
|
332,640
90.64% of 50 DAV
50 DAV is 367,000
|
$705.71
-0.08%
|
8/6/2021
|
$589.70
|
PP = $608.94
|
|
MB = $639.39
|
Most Recent Note - 10/19/2021 5:23:59 PM
G - Inched to new new all-time highs with today's 5th consecutive small gain on below average volume. Extended from the previously noted base, its 50 DMA line ($612) and prior highs in the $608 area define important near-term support to watch on pullbacks. Completed a new Public Offering on 8/11/21.
>>> FEATURED STOCK ARTICLE : Pullback After 5 Straight Gains into New High Territory - 9/28/2021 |
View all notes |
Set NEW NOTE alert |
Company Profile |
SEC
News |
Chart |
Request a new note
C
A
S
I |
BLDR
-
NYSE
Builders Firstsource Inc
Bldg-Constr Prds/Misc
|
$58.55
|
+0.26
0.45% |
$58.90
|
1,276,010
65.14% of 50 DAV
50 DAV is 1,959,000
|
$58.81
-0.44%
|
8/12/2021
|
$52.38
|
PP = $54.09
|
|
MB = $56.79
|
Most Recent Note - 10/20/2021 5:34:35 PM
G - Color code is changed to green after it posted a quiet gain today for another new all-time high and closed above its "max buy" level. Prior highs in the $54-55 area define initial support to watch on pullbacks. Fundamentals remain strong.
>>> FEATURED STOCK ARTICLE : Sputtering After Wedging to New Highs - 10/1/2021 |
View all notes |
Set NEW NOTE alert |
Company Profile |
SEC
News |
Chart |
Request a new note
C
A
S
I |
KFRC
-
NASDAQ
Kforce Inc
Comml Svcs-Staffing
|
$65.34
|
+0.50
0.77% |
$65.56
|
65,690
60.82% of 50 DAV
50 DAV is 108,000
|
$69.00
-5.30%
|
9/10/2021
|
$59.53
|
PP = $64.48
|
|
MB = $67.70
|
 Most Recent Note - 10/21/2021 8:56:15 PM
Y - Finding support near prior highs in the $64 area after volume-driven gains. Fundamentals remain strong. It s50 DMA line defines additional near-term support to watch.
>>> FEATURED STOCK ARTICLE : Pulling Back Near Prior Highs Following Technical Breakout - 10/15/2021 |
View all notes |
Set NEW NOTE alert |
Company Profile |
SEC
News |
Chart |
Request a new note
C
A
S
I |
GNRC
-
NYSE
Generac Hldgs Inc
Electrical-Power/Equipmt
|
$471.71
|
+13.49
2.94% |
$472.04
|
418,523
68.39% of 50 DAV
50 DAV is 612,000
|
$476.31
-0.97%
|
8/30/2021
|
$449.36
|
PP = $457.10
|
|
MB = $479.96
|
Most Recent Note - 10/21/2021 8:59:03 PM
Y - Posted a gain today with light volume for a best-ever close. Disciplined investors may watch for a gain and close above the pivot point backed by at least +40% above average volume to trigger a proper technical buy signal.
>>> FEATURED STOCK ARTICLE : Prior Lows Define Near-Term Support After 50 DMA Violation - 10/6/2021 |
View all notes |
Set NEW NOTE alert |
Company Profile |
SEC
News |
Chart |
Request a new note
C
A
S
I |
CAMT
-
NASDAQ
Camtek Ltd
ELECTRONICS - Scientific and Technical Instrum
|
$39.27
|
-0.02
-0.05% |
$39.51
|
61,070
39.66% of 50 DAV
50 DAV is 154,000
|
$46.01
-14.65%
|
8/4/2021
|
$39.67
|
PP = $40.57
|
|
MB = $42.60
|
Most Recent Note - 10/21/2021 8:53:53 PM
G - Volume totals have been cooling while still sputtering below its 50 DMA line ($40.17), meeting resistance at that important short-term average. The prior low ($34.68 on 8/17/21) defines the next important near-term support to watch. A rebound above the 50 DMA line is needed for its outlook to improve. Fundamentals remain strong.
>>> FEATURED STOCK ARTICLE : Fell Below Prior High and Violated 50-Day Moving Average - 10/5/2021 |
View all notes |
Set NEW NOTE alert |
Company Profile |
SEC
News |
Chart |
Request a new note
C
A
S
I |
Symbol/Exchange
Company Name
Industry Group |
PRICE |
CHANGE
(%Change) |
Day High |
Volume
(% DAV)
(% 50 day avg vol) |
52 Wk Hi
% From Hi |
Featured
Date |
Price
Featured |
Pivot Featured |
|
Max Buy |
PKI
-
NYSE
Perkinelmer Inc
ELECTRONICS - Scientific and Technical Instrum
|
$176.50
|
-0.01
-0.01% |
$177.01
|
375,617
58.60% of 50 DAV
50 DAV is 641,000
|
$192.00
-8.07%
|
8/18/2021
|
$181.07
|
PP = $188.50
|
|
MB = $197.93
|
Most Recent Note - 10/20/2021 5:39:46 PM
G - Posted a 6th consecutive gain with below average volume. A rebound above the 50 DMA line ($180) is needed for its outlook to improve. Its Relative Strength Rating improved to 81, one notch above the 80+ minimum guideline for buy candidates. Fundamentals remain strong. See the latest FSU analysis for more details and an annotated graph.
>>> FEATURED STOCK ARTICLE : Rebound Above 50 DMA Line Needed to Help Outlook Improve - 10/19/2021 |
View all notes |
Set NEW NOTE alert |
Company Profile |
SEC
News |
Chart |
Request a new note
C
A
S
I |
UMC
-
NYSE
United Microelectrnc Adr
ELECTRONICS - Semiconductor - Integrated Cir
|
$10.37
|
-0.05
-0.48% |
$10.42
|
5,435,077
75.72% of 50 DAV
50 DAV is 7,178,000
|
$12.62
-17.83%
|
8/5/2021
|
$11.62
|
PP = $11.38
|
|
MB = $11.95
|
Most Recent Note - 10/19/2021 5:29:38 PM
G - Holding its ground above its 200 DMA line ($9.86). A rebound above the 50 DMA line ($11.17) is needed for its outlook to improve.
>>> FEATURED STOCK ARTICLE : Consolidating Above 50-day Moving Average Near "Max Buy" Level - 9/27/2021 |
View all notes |
Set NEW NOTE alert |
Company Profile |
SEC
News |
Chart |
Request a new note
C
A
S
I |
BRKS
-
NASDAQ
Brooks Automation
ELECTRONICS - Semiconductor Equipment and Mate
|
$107.22
|
+0.82
0.77% |
$107.31
|
241,902
40.86% of 50 DAV
50 DAV is 592,000
|
$110.40
-2.88%
|
9/20/2021
|
$101.21
|
PP = $108.82
|
|
MB = $114.26
|
Most Recent Note - 10/20/2021 5:28:10 PM
Y - Posted a 5th consecutive gain today with lighter than average volume. Still perched within striking distance of its 52-week high. Pivot point cited was based on its 4/27/21 high plus 10 cents. Subsequent gains above the pivot point or prior highs backed by at least 40% above average volume may trigger a convincing technical buy signal. See the latest FSU analysis for more details and a new annotated graph.
>>> FEATURED STOCK ARTICLE : 5th Quiet Gain Has Brooks Perched Near Prior Highs - 10/20/2021 |
View all notes |
Set NEW NOTE alert |
Company Profile |
SEC
News |
Chart |
Request a new note
C
A
S
I |
ENTG
-
NASDAQ
Entegris Inc
ELECTRONICS - Semiconductor Equipment and Mate
|
$133.87
|
+3.04
2.32% |
$133.97
|
780,021
109.25% of 50 DAV
50 DAV is 714,000
|
$135.99
-1.56%
|
8/4/2021
|
$125.33
|
PP = $126.51
|
|
MB = $132.84
|
Most Recent Note - 10/20/2021 5:37:18 PM
Y - Perched within striking distance of its 52-week high. Found support near its 50 DMA line ($122.71) after damaging losses. Its prior low and 200 DMA line define the next important support in the $109 area.
>>> FEATURED STOCK ARTICLE : Hit New High and Rose Above its Max Buy Level - 9/23/2021 |
View all notes |
Set NEW NOTE alert |
Company Profile |
SEC
News |
Chart |
Request a new note
C
A
S
I |
CLFD
-
NASDAQ
Clearfield Inc
TELECOMMUNICATIONS - Cables / Satalite Equipment
|
$52.11
|
-0.36
-0.69% |
$53.46
|
57,236
70.66% of 50 DAV
50 DAV is 81,000
|
$54.49
-4.37%
|
7/23/2021
|
$40.23
|
PP = $43.74
|
|
MB = $45.93
|
Most Recent Note - 10/18/2021 5:33:33 PM
G - Perched at its 52-week high, extended from the previously noted base. Prior highs in the $46 area define near-term support along with its 50 DMA line ($45.56) where damaging losses may trigger technical sell signals. Fundamentals remain strong. See the latest FSU analysis for more details and a new annotated graph.
>>> FEATURED STOCK ARTICLE : Extended From Prior Base After Latest Rally - 10/18/2021 |
View all notes |
Set NEW NOTE alert |
Company Profile |
SEC
News |
Chart |
Request a new note
C
A
S
I |
Symbol/Exchange
Company Name
Industry Group |
PRICE |
CHANGE
(%Change) |
Day High |
Volume
(% DAV)
(% 50 day avg vol) |
52 Wk Hi
% From Hi |
Featured
Date |
Price
Featured |
Pivot Featured |
|
Max Buy |
TGH
-
NYSE
Textainer Group Holdings
TRANSPORTATION - Logistics
|
$37.18
|
-0.71
-1.87% |
$37.72
|
501,294
111.90% of 50 DAV
50 DAV is 448,000
|
$38.84
-4.27%
|
10/7/2021
|
$36.97
|
PP = $36.80
|
|
MB = $38.64
|
Most Recent Note - 10/20/2021 5:38:30 PM
Y - Posted a gain today with near average volume for a best-ever close. Its 50 DMA line ($34.38) defines important near-term support to watch above recent lows in the $30-31 area. Fundamentals remain strong.
>>> FEATURED STOCK ARTICLE : Perched Near High With Strong Fundamentals - 10/7/2021 |
View all notes |
Set NEW NOTE alert |
Company Profile |
SEC
News |
Chart |
Request a new note
C
A
S
I |
SMPL
-
NASDAQ
Simply Good Foods Co
Food-Confectionery
|
$34.31
|
+0.16
0.47% |
$34.80
|
592,522
183.84% of 50 DAV
50 DAV is 322,300
|
$38.50
-10.88%
|
12/28/2020
|
$30.40
|
PP = $31.44
|
|
MB = $33.01
|
Most Recent Note - 10/21/2021 9:03:38 PM
G - Due to report Aug '21 quarterly results. Volume and volatility often increase near earnings news. Its Relative Strength Rating has slumped to 72 while sputtering near its 200 DMA line ($33.54) and recent low ($33.55 on 9/20/21). Any damaging losses would trigger technical sell signals and raise greater concerns.
>>> FEATURED STOCK ARTICLE : Consolidating Just Above 50-Day Moving Average Line - 10/12/2021 |
View all notes |
Set NEW NOTE alert |
Company Profile |
SEC
News |
Chart |
Request a new note
C
A
S
I |
WDAY
-
NYSE
Workday Inc Cl A
Computer Sftwr-Enterprse
|
$281.01
|
+3.75
1.35% |
$281.68
|
1,225,633
79.99% of 50 DAV
50 DAV is 1,532,300
|
$282.77
-0.62%
|
9/7/2021
|
$275.69
|
PP = $282.87
|
|
MB = $297.01
|
Most Recent Note - 10/19/2021 5:28:24 PM
Y - Posted another gain today with below average volume while challenging prior highs. Very little resistance remains due to overhead supply. Its 50 DMA line ($258).and recent lows ($246) define near-term support to watch where violations would raise concerns. Fundamentals remain strong.
>>> FEATURED STOCK ARTICLE : Rebounding From 50-Day Moving Average Toward Prior Highs - 10/13/2021 |
View all notes |
Set NEW NOTE alert |
Company Profile |
SEC
News |
Chart |
Request a new note
C
A
S
I |
CTLT
-
NYSE
Catalent Inc
DRUGS - Biotechnology
|
$132.31
|
+0.53
0.40% |
$132.65
|
873,709
99.40% of 50 DAV
50 DAV is 879,000
|
$142.64
-7.24%
|
8/25/2021
|
$128.72
|
PP = $127.78
|
|
MB = $134.17
|
Most Recent Note - 10/18/2021 5:35:13 PM
Y - Posted a gain today but remains below Its 50 DMA line ($131) which may act as resistance. Prior highs in the $124-127 area which define the next important near-term support to watch. Fundamentals remain strong.
>>> FEATURED STOCK ARTICLE : Found Support Near Prior High While Consolidating - 10/8/2021 |
View all notes |
Set NEW NOTE alert |
Company Profile |
SEC
News |
Chart |
Request a new note
C
A
S
I |
MEDP
-
NASDAQ
Medpace Holdings Inc
Medical-Research Eqp/Svc
|
$186.03
|
-2.02
-1.07% |
$188.71
|
141,563
87.82% of 50 DAV
50 DAV is 161,200
|
$199.04
-6.54%
|
9/10/2021
|
$196.32
|
PP = $196.22
|
|
MB = $206.03
|
Most Recent Note - 10/20/2021 5:35:54 PM
Y - Perched near its 52-week high, still finding support near its 50 DMA line ($186). More damaging losses would raise concerns. Pivot point cited was based on its 4/26/21 high plus 10 cents. Subsequent gains and strong close above the pivot point backed by at least +40% above average volume may trigger a technical buy signal.
>>> FEATURED STOCK ARTICLE : Found Prompt Support Near 50-Day Moving Average Line - 10/14/2021 |
View all notes |
Set NEW NOTE alert |
Company Profile |
SEC
News |
Chart |
Request a new note
C
A
S
I |
Symbol/Exchange
Company Name
Industry Group |
PRICE |
CHANGE
(%Change) |
Day High |
Volume
(% DAV)
(% 50 day avg vol) |
52 Wk Hi
% From Hi |
Featured
Date |
Price
Featured |
Pivot Featured |
|
Max Buy |
JEF
-
NYSE
Jefferies Financial Grp
Finance-Invest Bnk/Bkrs
|
$42.36
|
+0.31
0.74% |
$42.52
|
1,294,611
71.45% of 50 DAV
50 DAV is 1,812,000
|
$42.55
-0.45%
|
6/28/2021
|
$31.81
|
PP = $34.42
|
|
MB = $36.14
|
Most Recent Note - 10/18/2021 5:38:11 PM
G - Posted a 12th consecutive gain today for another new all-time high. Its 50 DMA line ($37) defines important near-term support to watch on pullbacks. Reported Aug '21 quarterly earnings +713% on +70% sales revenues versus the year ago period.
>>> FEATURED STOCK ARTICLE : Perched at 52-week High With Earnings News Due - 9/29/2021 |
View all notes |
Set NEW NOTE alert |
Company Profile |
SEC
News |
Chart |
Request a new note
C
A
S
I |
AVTR
-
NYSE
Avantor Inc
Medical-Research Eqp/Svc
|
$38.77
|
+0.19
0.49% |
$38.78
|
3,681,811
95.58% of 50 DAV
50 DAV is 3,852,000
|
$44.37
-12.62%
|
6/10/2021
|
$32.94
|
PP = $34.09
|
|
MB = $35.79
|
Most Recent Note - 10/21/2021 12:45:43 PM
G - Still sputtering below its 50 DMA line ($40.39) and below the prior low ($39.24 on 10/01/21) after damaging volume-driven losses triggering technical sell signals. A rebound above the 50 DMA line is needed for its outlook to improve. Completed a Secondary Offering on 9/13/21 while perched at its all-time high, very extended from any sound base.
>>> FEATURED STOCK ARTICLE : Pulled Back Finding Support Near 50-Day Moving Average - 10/11/2021 |
View all notes |
Set NEW NOTE alert |
Company Profile |
SEC
News |
Chart |
Request a new note
C
A
S
I |
MIME
-
NASDAQ
Mimecast Limited
Computer Sftwr-Security
|
$68.65
|
+0.62
0.91% |
$68.89
|
276,659
29.65% of 50 DAV
50 DAV is 933,000
|
$71.45
-3.92%
|
10/18/2021
|
$68.17
|
PP = $71.55
|
|
MB = $75.13
|
Most Recent Note - 10/21/2021 8:52:26 PM
Y - Volume totals have been cooling while consolidating above its 50 DMA line ($65.45) and perched less that -4% from its all-time high. Fundamentals remain strong. Color code was changed to yellow with new pivot point cited based on its 9/03/21 high plus 10 cents. See the latest FSU analysis for more details and a new annotated graph.
>>> FEATURED STOCK ARTICLE : MIME Consolidating Less Than 4% Off High Building New Base - 10/21/2021 |
View all notes |
Set NEW NOTE alert |
Company Profile |
SEC
News |
Chart |
Request a new note
C
A
S
I |
|
|
|
THESE ARE NOT BUY RECOMMENDATIONS!
Comments contained in the body of this report are technical
opinions only. The material herein has been obtained
from sources believed to be reliable and accurate, however,
its accuracy and completeness cannot be guaranteed.
This site is not an investment advisor, hence it does
not endorse or recommend any securities or other investments.
Any recommendation contained in this report may not
be suitable for all investors and it is not to be deemed
an offer or solicitation on our part with respect to
the purchase or sale of any securities. All trademarks,
service marks and trade names appearing in this report
are the property of their respective owners, and are
likewise used for identification purposes only.
This report is a service available
only to active Paid Premium Members.
You may opt-out of receiving report notifications
at any time. Questions or comments may be submitted
by writing to Premium Membership Services 665 S.E. 10 Street, Suite 201 Deerfield Beach, FL 33441-5634 or by calling 1-800-965-8307
or 954-785-1121.
|
|
|