***Last / Change / Volume data in this table is the closing quote data***
Symbol/Exchange
Company Name
Industry Group |
PRICE |
CHANGE
(%Change) |
Day High |
Volume
(% DAV)
(% 50 day avg vol) |
52 Wk Hi
% From Hi |
Featured
Date |
Price
Featured |
Pivot Featured |
|
Max Buy |
 SIVB
-
NASDAQ
SIVB
-
NASDAQ
S V B Financial Group
BANKING - Regional - Pacific Banks
|
$755.03
|
+14.59
1.97% |
$756.77
|
261,407
74.05% of 50 DAV
50 DAV is 353,000
|
$759.02
-0.53%
|
8/6/2021
|
$589.70
|
PP = $608.94
|
|
MB = $639.39
|
Most Recent Note - 10/29/2021 4:38:20 PM
G - Very extended from the previously noted base, it pulled back this week. Weakness came after it reported Sep '21 quarterly earnings -14% on +43% sales revenues versus the year ago period, below the +25% minimum earnings guideline (C criteria) raising fundamental concerns. Its 50 DMA line ($636) defines important near-term support to watch. Completed a new Public Offering on 8/11/21. See the latest FSU analysis for more details and a new annotated graph.
>>> FEATURED STOCK ARTICLE : Latest Quarter Raised Fundamental Concerns - 10/29/2021 |
View all notes |
Set NEW NOTE alert |
Company Profile |
SEC
News |
Chart |
Request a new note
C
A
S
I |
BLDR
-
NYSE
Builders Firstsource Inc
Bldg-Constr Prds/Misc
|
$60.26
|
+2.06
3.54% |
$60.46
|
3,572,093
200.91% of 50 DAV
50 DAV is 1,778,000
|
$60.51
-0.41%
|
8/12/2021
|
$52.38
|
PP = $54.09
|
|
MB = $56.79
|
Most Recent Note - 11/2/2021 5:31:30 PM
G - Perched near its all-time high, extended from any sound base. Its 50 DMA line and prior highs in the $54 area define important near-term support to watch on pullbacks. Due to report Sep '21 quarterly results before the open on Thursday, Nov 4th. See the latest FSU analysis for more details and a new annotated graph.
>>> FEATURED STOCK ARTICLE : Earnings News Due Thursday for High-Ranked Building Products Firm - 11/2/2021 |
View all notes |
Set NEW NOTE alert |
Company Profile |
SEC
News |
Chart |
Request a new note
C
A
S
I |
KFRC
-
NASDAQ
Kforce Inc
Comml Svcs-Staffing
|
$69.98
|
+0.51
0.73% |
$70.92
|
111,728
106.41% of 50 DAV
50 DAV is 105,000
|
$71.49
-2.11%
|
9/10/2021
|
$59.53
|
PP = $64.48
|
|
MB = $67.70
|
Most Recent Note - 11/2/2021 12:41:33 PM
G - Color code is changed to green after rallying above its "max buy" with higher volume behind today's 4th consecutive gain. Found support near prior highs in the $64 area when quietly consolidating after the technical breakout on 10/07/21. Fundamentals remain strong. Its 50 DMA line ($62.06) defines additional near-term support to watch.
>>> FEATURED STOCK ARTICLE : Pulling Back Near Prior Highs Following Technical Breakout - 10/15/2021 |
View all notes |
Set NEW NOTE alert |
Company Profile |
SEC
News |
Chart |
Request a new note
C
A
S
I |
GNRC
-
NYSE
Generac Hldgs Inc
Electrical-Power/Equipmt
|
$453.40
|
-30.18
-6.24% |
$480.90
|
1,513,970
239.17% of 50 DAV
50 DAV is 633,000
|
$524.31
-13.52%
|
8/30/2021
|
$449.36
|
PP = $457.10
|
|
MB = $479.96
|
 Most Recent Note - 11/3/2021 12:36:48 PM
G - Churned above average volume on the prior session while trading in a wider intra-day range and it had a "negative reversal" at its all-time high. Reported Sep '21 quarterly earnings +13% on +34% sales revenues versus the year ago period, below the +25% minimum earnings guideline (C criteria), raising fundamental concerns.
>>> FEATURED STOCK ARTICLE : Prior Lows Define Near-Term Support After 50 DMA Violation - 10/6/2021 |
View all notes |
Set NEW NOTE alert |
Company Profile |
SEC
News |
Chart |
Request a new note
C
A
S
I |
CAMT
-
NASDAQ
Camtek Ltd
ELECTRONICS - Scientific and Technical Instrum
|
$40.22
|
+0.54
1.36% |
$40.22
|
212,393
131.11% of 50 DAV
50 DAV is 162,000
|
$46.01
-12.58%
|
8/4/2021
|
$39.67
|
PP = $40.57
|
|
MB = $42.60
|
Most Recent Note - 11/1/2021 5:05:45 PM
G - Rebounded near its 50 DMA line ($40.63) with today's big gain backed by average volume. Faces near-term resistance due to overhead supply up to the $46 level. Reported Sep '21 quarterly earnings +150% versus the year ago period. The prior low ($34.68 on 8/17/21) defines the next important near-term support to watch. Fundamentals remain strong.
>>> FEATURED STOCK ARTICLE : Fell Below Prior High and Violated 50-Day Moving Average - 10/5/2021 |
View all notes |
Set NEW NOTE alert |
Company Profile |
SEC
News |
Chart |
Request a new note
C
A
S
I |
Symbol/Exchange
Company Name
Industry Group |
PRICE |
CHANGE
(%Change) |
Day High |
Volume
(% DAV)
(% 50 day avg vol) |
52 Wk Hi
% From Hi |
Featured
Date |
Price
Featured |
Pivot Featured |
|
Max Buy |
PKI
-
NYSE
Perkinelmer Inc
Medical-Research Eqp/Svc
|
$174.09
|
-2.22
-1.26% |
$182.89
|
1,336,457
218.34% of 50 DAV
50 DAV is 612,100
|
$192.00
-9.33%
|
8/18/2021
|
$181.07
|
PP = $188.50
|
|
MB = $197.93
|
Most Recent Note - 11/3/2021 1:01:31 PM
G - Reported Sep '21 quarterly earnings +11% versus the year ago period, below the +25% minimum earnings guideline (C criteria), raising concerns. Meeting resistance at its 50 DMA line ($178.84) in recent weeks. Its Relative Strength Rating has slumped to 70, below the 80+ minimum guideline for buy candidates.
>>> FEATURED STOCK ARTICLE : Rebound Above 50 DMA Line Needed to Help Outlook Improve - 10/19/2021 |
View all notes |
Set NEW NOTE alert |
Company Profile |
SEC
News |
Chart |
Request a new note
C
A
S
I |
AMD
-
NASDAQ
Advanced Micro Devices
ELECTRONICS - Semiconductor - Broad Line
|
$130.53
|
+2.90
2.27% |
$130.60
|
58,614,474
132.08% of 50 DAV
50 DAV is 44,379,000
|
$128.46
1.61%
|
10/27/2021
|
$124.91
|
PP = $122.59
|
|
MB = $128.72
|
Most Recent Note - 11/2/2021 5:36:55 PM
Y - Hit a new all-time high with today's 2nd consecutive volume-driven gain approaching its "max buy" level. It was highlighted yellow with pivot point cited based on its 8/04/21 high plus 10 cents in the 10/27/21 mid-day report. Fundamentals remain strong after it reported Sep '21 quarterly earnings +78% on +54% sales revenues versus the year ago period.
>>> FEATURED STOCK ARTICLE : Encountered Distributional Pressure After Reaching New High - 10/27/2021 |
View all notes |
Set NEW NOTE alert |
Company Profile |
SEC
News |
Chart |
Request a new note
C
A
S
I |
UMC
-
NYSE
United Microelectrnc Adr
ELECTRONICS - Semiconductor - Integrated Cir
|
$10.68
|
+0.04
0.38% |
$10.68
|
5,430,635
69.50% of 50 DAV
50 DAV is 7,814,000
|
$12.62
-15.37%
|
8/5/2021
|
$11.62
|
PP = $11.38
|
|
MB = $11.95
|
Most Recent Note - 11/2/2021 5:33:45 PM
G - Posted a gain today with higher volume. A rebound above the 50 DMA line ($11.18) still is needed for its outlook to improve. Reported Sep '21 quarterly earnings +100% on +30% sales revenues versus the year ago period. Recently found support above its 200 DMA line ($9.94).
>>> FEATURED STOCK ARTICLE : Earnings News Due From Taiwan-Based Semiconductor Firm - 10/26/2021 |
View all notes |
Set NEW NOTE alert |
Company Profile |
SEC
News |
Chart |
Request a new note
C
A
S
I |
BRKS
-
NASDAQ
Brooks Automation
ELECTRONICS - Semiconductor Equipment and Mate
|
$120.60
|
+0.61
0.51% |
$120.74
|
427,453
74.86% of 50 DAV
50 DAV is 571,000
|
$120.30
0.25%
|
9/20/2021
|
$101.21
|
PP = $108.82
|
|
MB = $114.26
|
Most Recent Note - 11/1/2021 5:03:10 PM
G - Color code is changed to green after today's 4th consecutive gain with near average volume, rallying beyond its "max buy" level for a new high. Prior high in the $110 area defines initial support to watch above its 50 DMA line.
>>> FEATURED STOCK ARTICLE : 5th Quiet Gain Has Brooks Perched Near Prior Highs - 10/20/2021 |
View all notes |
Set NEW NOTE alert |
Company Profile |
SEC
News |
Chart |
Request a new note
C
A
S
I |
ENTG
-
NASDAQ
Entegris Inc
ELECTRONICS - Semiconductor Equipment and Mate
|
$146.12
|
+1.88
1.30% |
$146.46
|
694,498
90.67% of 50 DAV
50 DAV is 766,000
|
$144.39
1.20%
|
8/4/2021
|
$125.33
|
PP = $126.51
|
|
MB = $132.84
|
Most Recent Note - 11/3/2021 5:21:59 PM
G - Wedged to a new all-time high with today's 6th consecutive gain. Its 50 DMA line ($127.63) defines near-term support to watch on pullbacks. Fundamentals remain strong after it recently reported Sep '21 quarterly earnings +37% on +20% sales revenues versus the year ago period.
>>> FEATURED STOCK ARTICLE : Hit New Record High With Another Volume-Driven Gain - 10/22/2021 |
View all notes |
Set NEW NOTE alert |
Company Profile |
SEC
News |
Chart |
Request a new note
C
A
S
I |
Symbol/Exchange
Company Name
Industry Group |
PRICE |
CHANGE
(%Change) |
Day High |
Volume
(% DAV)
(% 50 day avg vol) |
52 Wk Hi
% From Hi |
Featured
Date |
Price
Featured |
Pivot Featured |
|
Max Buy |
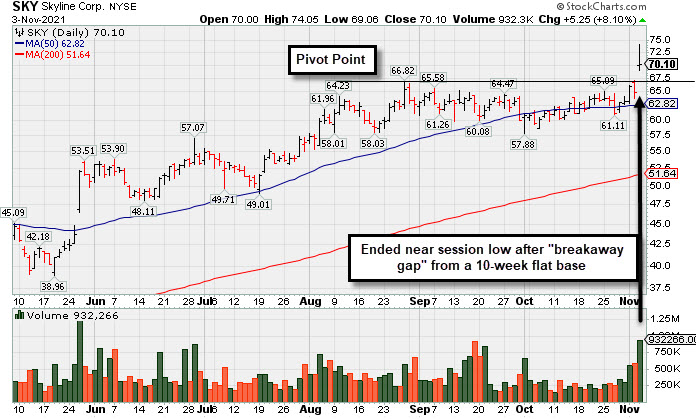
SKY
-
NYSE
Skyline Champion Corp
Bldg-Mobile/Mfg andamp; RV
|
$70.10
|
+5.25
8.10% |
$74.05
|
932,263
256.12% of 50 DAV
50 DAV is 364,000
|
$67.13
4.42%
|
11/3/2021
|
$72.19
|
PP = $66.92
|
|
MB = $70.27
|
Most Recent Note - 11/3/2021 1:11:21 PM
Y - Color code is changed to yellow with pivot point cited based on its 8/27/21 high plus 10 cents. Hit a new all-time high with today's "breakaway gap" triggering a technical buy signal. Found support near its 50 DMA line ($62.85) in recent weeks while building an orderly flat base. Reported very strong Mar, Jun and Sep '21 quarterly results versus the year ago periods well above the +25% minimum earnings guideline (C criteria). Annual earnings (A criteria) history has been strong.
>>> FEATURED STOCK ARTICLE : Breakaway Gap After 10-Week Flat Base - 11/3/2021 |
View all notes |
Set NEW NOTE alert |
Company Profile |
SEC
News |
Chart |
Request a new note
C
A
S
I |
WSM
-
NYSE
Williams Sonoma Inc
RETAIL - Home Furnishing Stores
|
$203.88
|
+9.78
5.04% |
$211.14
|
1,579,873
161.21% of 50 DAV
50 DAV is 980,000
|
$204.41
-0.26%
|
11/3/2021
|
$205.00
|
PP = $195.09
|
|
MB = $204.84
|
Most Recent Note - 11/3/2021 5:27:35 PM
Y - Finished in the middle of its intra-day range today after highlighted in yellow in the earlier mid-day report with pivot point cited based on its 9/27/21 high. It cleared a "double bottom" base as it gapped up and rallied to hit a new 52-week high with +61% above average volume triggering a technical buy signal. Found support near its 50 DMA line since noted in the 9/30/21 mid-day report - "Reported Jul '21 quarterly earnings +80% on +31% sales revenues versus the year ago period, its 5th consecutive strong quarterly comparison. Annual earnings history has been strong."
There are no Featured Stock Updates™ available for this stock at this time. You may request one by clicking the Request a New Note link below |
View all notes |
Set NEW NOTE alert |
Company Profile |
SEC
News |
Chart |
Request a new note
C
A
S
I |
CLFD
-
NASDAQ
Clearfield Inc
TELECOMMUNICATIONS - Cables / Satalite Equipment
|
$59.89
|
+0.19
0.32% |
$61.34
|
138,556
155.68% of 50 DAV
50 DAV is 89,000
|
$59.80
0.15%
|
7/23/2021
|
$40.23
|
PP = $43.74
|
|
MB = $45.93
|
Most Recent Note - 10/28/2021 4:53:38 PM
G -Hit yet another new all-time high with today's 3rd consecutive volume-driven gain, getting very extended from the previously noted base. Its 50 DMA line ($47.39) and prior highs in the $46 area define near-term support where damaging losses may trigger technical sell signals. Due to report Sep '21 quarterly results on 11/04/21.
>>> FEATURED STOCK ARTICLE : Extended From Prior Base After Latest Rally - 10/18/2021 |
View all notes |
Set NEW NOTE alert |
Company Profile |
SEC
News |
Chart |
Request a new note
C
A
S
I |
TGH
-
NYSE
Textainer Group Holdings
TRANSPORTATION - Logistics
|
$38.56
|
-0.06
-0.16% |
$38.98
|
406,026
91.24% of 50 DAV
50 DAV is 445,000
|
$40.44
-4.65%
|
10/7/2021
|
$36.97
|
PP = $36.80
|
|
MB = $38.64
|
Most Recent Note - 11/2/2021 1:00:38 PM
G - Color code was changed to green last week and it is hovering near its 52-week high and its "max buy" level. Its 50 DMA line ($35.24) defines important near-term support to watch. Fundamentals remain strong.
>>> FEATURED STOCK ARTICLE : Perched Near High With Strong Fundamentals - 10/7/2021 |
View all notes |
Set NEW NOTE alert |
Company Profile |
SEC
News |
Chart |
Request a new note
C
A
S
I |
ENPH
-
NASDAQ
Enphase Energy Inc
Energy-Solar
|
$236.58
|
-1.03
-0.43% |
$238.88
|
2,141,429
94.59% of 50 DAV
50 DAV is 2,264,000
|
$239.89
-1.38%
|
10/28/2021
|
$218.00
|
PP = $229.14
|
|
MB = $240.60
|
Most Recent Note - 10/29/2021 12:52:01 PM
Y - Hit a new 52-week high with today's early gain. Color code was changed to yellow with pivot point cited based on its 2/10/21 high plus 10 cents when highlighted in the prior mid-day report. Challenged its 52-week high with 2 consecutive volume-driven gains after a considerable gap up and it was noted - "Subsequent gains above the pivot point backed by at least +40% above average volume may trigger a technical buy signal. Reported very strong sales revenues and earnings increases in quarterly comparisons through Sep '21 versus the year ago periods, satisfying the C criteria. Strong annual earnings since FY '18 after years of losses."
>>> FEATURED STOCK ARTICLE : Enphase is Challenging its All-Time High With Volume-Driven Gains - 10/28/2021 |
View all notes |
Set NEW NOTE alert |
Company Profile |
SEC
News |
Chart |
Request a new note
C
A
S
I |
Symbol/Exchange
Company Name
Industry Group |
PRICE |
CHANGE
(%Change) |
Day High |
Volume
(% DAV)
(% 50 day avg vol) |
52 Wk Hi
% From Hi |
Featured
Date |
Price
Featured |
Pivot Featured |
|
Max Buy |
SMPL
-
NASDAQ
Simply Good Foods Co
Food-Confectionery
|
$39.88
|
-0.17
-0.42% |
$40.36
|
592,379
165.01% of 50 DAV
50 DAV is 359,000
|
$40.30
-1.04%
|
10/25/2021
|
$38.30
|
PP = $38.60
|
|
MB = $40.53
|
Most Recent Note - 10/28/2021 4:50:00 PM
Y - Hit another new 52-week high with today's gain approaching its "max buy" level. Volume-driven gains this week triggered a new (or add-on) technical buy signal. Bullish action came after it reported Aug '21 quarterly earnings +45% on +17% sales revenues versus the year ago period. Its Relative Strength Rating has improved to 87. Found support above its 200 DMA line ($33.78) and recent low ($33.55 on 9/20/21).
>>> FEATURED STOCK ARTICLE : Consolidating Just Above 50-Day Moving Average Line - 10/12/2021 |
View all notes |
Set NEW NOTE alert |
Company Profile |
SEC
News |
Chart |
Request a new note
C
A
S
I |
WDAY
-
NASDAQ
Workday Inc Cl A
Computer Sftwr-Enterprse
|
$288.96
|
-2.32
-0.80% |
$292.15
|
808,282
53.21% of 50 DAV
50 DAV is 1,519,000
|
$292.62
-1.25%
|
9/7/2021
|
$275.69
|
PP = $282.87
|
|
MB = $297.01
|
Most Recent Note - 11/1/2021 5:08:05 PM
Y - Paused today after 5 consecutive small gains lacking great volume conviction as it wedged into new high territory. No resistance remains due to overhead supply. Its 50 DMA line ($267).defines near-term support to watch where a violation would raise concerns. Fundamentals remain strong.
>>> FEATURED STOCK ARTICLE : Rebounding From 50-Day Moving Average Toward Prior Highs - 10/13/2021 |
View all notes |
Set NEW NOTE alert |
Company Profile |
SEC
News |
Chart |
Request a new note
C
A
S
I |
CTLT
-
NYSE
Catalent Inc
DRUGS - Biotechnology
|
$136.01
|
-0.34
-0.25% |
$137.59
|
796,483
87.24% of 50 DAV
50 DAV is 913,000
|
$142.64
-4.65%
|
8/25/2021
|
$128.72
|
PP = $127.78
|
|
MB = $134.17
|
Most Recent Note - 11/1/2021 5:12:40 PM
Y - Due to report Sep '21 quarterly results on 11/02/21. Posted a 3rd consecutive gain today with higher (near average) volume. Its 50 DMA line ($133.77) and prior lows in the $126-127 area define important near-term support to watch on pullbacks. Fundamentals remain strong.
>>> FEATURED STOCK ARTICLE : Found Support Near Prior High While Consolidating - 10/8/2021 |
View all notes |
Set NEW NOTE alert |
Company Profile |
SEC
News |
Chart |
Request a new note
C
A
S
I |
MEDP
-
NASDAQ
Medpace Holdings Inc
Medical-Research Eqp/Svc
|
$224.24
|
-2.59
-1.14% |
$226.79
|
170,184
91.01% of 50 DAV
50 DAV is 187,000
|
$229.49
-2.29%
|
9/10/2021
|
$196.32
|
PP = $196.22
|
|
MB = $206.03
|
Most Recent Note - 10/29/2021 4:44:30 PM
G - Hit another new 52-week high and rallied further above its "max buy" level with today's big gain on average volume. Bullish action came after it reported Sep '21 earnings +18% on +28% sales revenues versus the year ago period, below the +25% minimum earnings guideline (C criteria), raising fundamental concerns. Prior highs in the $199 area define initial support above its 50 DMA line ($189).
>>> FEATURED STOCK ARTICLE : Found Prompt Support Near 50-Day Moving Average Line - 10/14/2021 |
View all notes |
Set NEW NOTE alert |
Company Profile |
SEC
News |
Chart |
Request a new note
C
A
S
I |
JEF
-
NYSE
Jefferies Financial Grp
Finance-Invest Bnk/Bkrs
|
$44.14
|
+0.33
0.75% |
$44.47
|
1,855,503
100.73% of 50 DAV
50 DAV is 1,842,000
|
$43.86
0.64%
|
6/28/2021
|
$31.81
|
PP = $34.42
|
|
MB = $36.14
|
Most Recent Note - 11/1/2021 4:59:22 PM
G - Extended from any sound base and stubbornly holding its ground near its all-time high. Its 50 DMA line ($38.70) defines important near-term support to watch on pullbacks. Reported Aug '21 quarterly earnings +40% on +20% sales revenues versus the year ago period. See the latest FSU analysis for more details and a new annotated graph.
>>> FEATURED STOCK ARTICLE : Extended From Prior Highs and Stubbornly Holding Ground - 11/1/2021 |
View all notes |
Set NEW NOTE alert |
Company Profile |
SEC
News |
Chart |
Request a new note
C
A
S
I |
Symbol/Exchange
Company Name
Industry Group |
PRICE |
CHANGE
(%Change) |
Day High |
Volume
(% DAV)
(% 50 day avg vol) |
52 Wk Hi
% From Hi |
Featured
Date |
Price
Featured |
Pivot Featured |
|
Max Buy |
AVTR
-
NYSE
Avantor Inc
Medical-Research Eqp/Svc
|
$39.44
|
-0.39
-0.98% |
$40.06
|
4,282,023
100.68% of 50 DAV
50 DAV is 4,253,000
|
$44.37
-11.11%
|
6/10/2021
|
$32.94
|
PP = $34.09
|
|
MB = $35.79
|
Most Recent Note - 10/29/2021 12:27:42 PM
G - Gapped up today rebounding above its 50 DMA line helping its outlook improve. Bullish action came after it reported Sep '21 quarterly earnings +46% above the year ago period. Volume and volatility often increase near earnings news. Completed a Secondary Offering on 9/13/21. Resistance remains due to overhead supply up to the $44 level.
>>> FEATURED STOCK ARTICLE : Pulled Back Finding Support Near 50-Day Moving Average - 10/11/2021 |
View all notes |
Set NEW NOTE alert |
Company Profile |
SEC
News |
Chart |
Request a new note
C
A
S
I |
MIME
-
NASDAQ
Mimecast Limited
Computer Sftwr-Security
|
$79.27
|
+3.78
5.01% |
$79.84
|
1,022,395
105.95% of 50 DAV
50 DAV is 965,000
|
$76.71
3.34%
|
10/18/2021
|
$68.17
|
PP = $71.55
|
|
MB = $75.13
|
Most Recent Note - 11/3/2021 5:23:46 PM
G - Hit another new all-time high with today's big gain, getting very extended from the previously noted base. Prior highs in the $71 area define initial support above its 50 DMA line ($68) .
>>> FEATURED STOCK ARTICLE : MIME Consolidating Less Than 4% Off High Building New Base - 10/21/2021 |
View all notes |
Set NEW NOTE alert |
Company Profile |
SEC
News |
Chart |
Request a new note
C
A
S
I |
ZD
-
NASDAQ
Ziff Davis Inc
Internet-Content
|
$130.20
|
+0.92
0.71% |
$130.73
|
405,243
97.18% of 50 DAV
50 DAV is 417,000
|
$131.12
-0.70%
|
10/25/2021
|
$126.07
|
PP = $128.19
|
|
MB = $134.60
|
Most Recent Note - 11/1/2021 5:09:59 PM
Y - Perched at its 52-week high after today's gain backed by lighter than average volume. Confirming gains and close above the pivot point backed by at least +40% above average volume may clinch a convincing technical buy signal. Quarterly and annual earnings (C and A criteria) history has been strong.
>>> FEATURED STOCK ARTICLE : Internet Content Firm Perched Near Prior High - 10/25/2021 |
View all notes |
Set NEW NOTE alert |
Company Profile |
SEC
News |
Chart |
Request a new note
C
A
S
I |