You are not logged in.
This means you
CAN ONLY VIEW reports that were published prior to Monday, March 31, 2025.
You
MUST UPGRADE YOUR MEMBERSHIP if you want to see any current reports.
AFTER MARKET UPDATE - THURSDAY, OCTOBER 28TH, 2021
Previous After Market Report Next After Market Report >>>
|
|
|
|
DOW |
+239.79 |
35,730.48 |
+0.68% |
|
Volume |
875,310,157 |
+1% |
|
Volume |
5,563,314,200 |
-9% |
|
NASDAQ |
+212.28 |
15,448.12 |
+1.39% |
|
Advancers |
2,240 |
69% |
|
Advancers |
3,062 |
70% |
|
S&P 500 |
+44.68 |
4,596.36 |
+0.98% |
|
Decliners |
1,026 |
31% |
|
Decliners |
1,318 |
30% |
|
Russell 2000 |
+45.49 |
2,297.98 |
+2.02% |
|
52 Wk Highs |
137 |
|
|
52 Wk Highs |
145 |
|
|
S&P 600 |
+25.50 |
1,378.71 |
+1.88% |
|
52 Wk Lows |
45 |
|
|
52 Wk Lows |
101 |
|
|
 |
Breadth Positive as Major Indices Extended Their Record Rally
Kenneth J. Gruneisen - Passed the CAN SLIM® Master's Exam
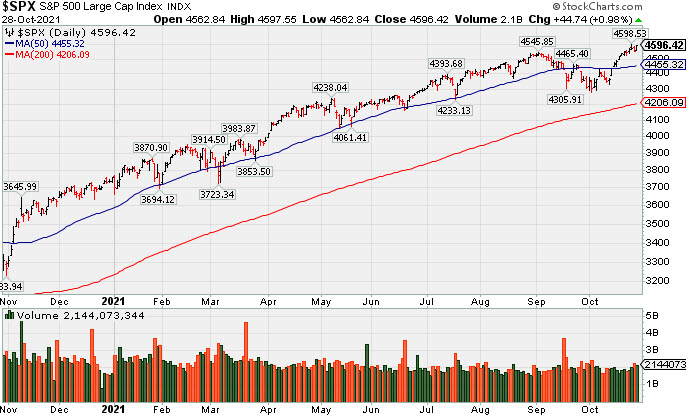
The S&P 500 reclaimed record territory, jumping 1%, while the Nasdaq Composite rallied 1.4% to hit a fresh peak for the first time since September 7. The Dow climbed 239 points, finishing within 0.1% of Tuesday’s all-time closing high. The small-cap Russell 2000 rebounded 2%, good for its best day since August after shedding the most in a month yesterday (-1.9%). The volume totals reported were mixed, higher than the prior session on the NYSE and lighter on the Nasdaq exchange. Breadth was positive as advancers led decliners by more than a 2-1 margin on the NYSE and on the Nasdaq exchange. There were 71 high-ranked companies from the Leaders List that hit new 52-week highs and were listed on the BreakOuts Page. New 52-week highs totals expanded and outnumbered new 52-week lows on the NYSE and on the Nasdaq exchange. The major indices (M criteria) are in a confirmed uptrend. Investors are reminded to only make proper new buys as per the fundamental and technical rules of the fact-based investment system.
PICTURED: The S&P 500 Index posted a gain and ended perched at a record high.
U.S. stocks ended firmly higher on Thursday as robust corporate earnings outweighed mixed economic data releases. On the data front, the first reading of third-quarter U.S. GDP showed the economy expanded at a weaker-than-expected 2% annualized clip in the July-September period, representing the slowest pace since the onset of the pandemic. Separately, weekly initial jobless claims declined to a fresh pandemic low of 281,000, while pending home sales unexpectedly fell 2.3% in September.
U.S. Treasuries were mostly lower, with the yield on the 10-year note up four basis points to 1.57%. Notably, the Treasury yield curve inverted on the longer-end, with the 20-year bond yield settling two basis points above the 30-year bond rate. In commodities, WTI crude added 0.5% to $83.10/barrel, erasing earlier losses after OPEC+ projected tighter global oil markets in the fourth quarter.
All 11 S&P 500 sectors finished in positive territory. Automakers outperformed, with Ford (F +8.70%) jumping after upwardly revising its guidance and reinstating its quarterly dividend. In other earnings, Caterpillar (CAT +4.06%) rose after topping analyst estimates despite ongoing supply chain issues, while eBay (EBAY -6.76%) fell on a disappointing current-quarter sales outlook. Elsewhere, Facebook (FB +1.51%) rose after unveiling it will change its name to Meta. |
 Kenneth J. Gruneisen started out as a licensed stockbroker in August 1987, a couple of months prior to the historic stock market crash that took the Dow Jones Industrial Average down -22.6% in a single day. He has published daily fact-based fundamental and technical analysis on high-ranked stocks online for two decades. Through FACTBASEDINVESTING.COM, Kenneth provides educational articles, news, market commentary, and other information regarding proven investment systems that work in good times and bad.
Comments contained in the body of this report are technical opinions only and are not necessarily those of Gruneisen Growth Corp. The material herein has been obtained from sources believed to be reliable and accurate, however, its accuracy and completeness cannot be guaranteed. Our firm, employees, and customers may effect transactions, including transactions contrary to any recommendation herein, or have positions in the securities mentioned herein or options with respect thereto. Any recommendation contained in this report may not be suitable for all investors and it is not to be deemed an offer or solicitation on our part with respect to the purchase or sale of any securities. |
|
 |
Retail, Financial, Tech, and Energy-Linked Groups Rose
Kenneth J. Gruneisen - Passed the CAN SLIM® Master's Exam
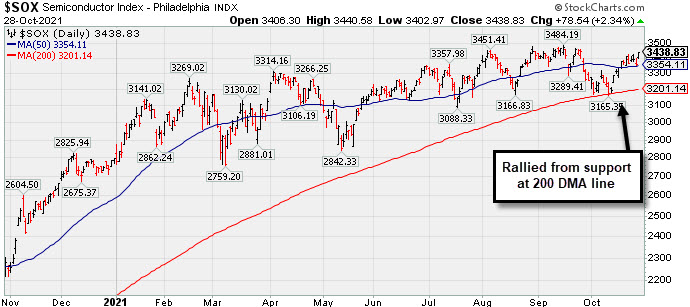
The Bank Index ($BKX +1.23%), Broker/Dealer Index ($XBD +0.93%), and Retail Index ($RLX +0.78%) posted unanimous gains. The tech sector also had a positive bias as the Semiconductor Index ($SOX +2.34%) and Biotech Index ($BTK +1.80%) led the tech sector while the Networking Index ($NWX +0.60%) posted a smaller gain. Commodity-linked groups were mixed as the Oil Services Index ($OSX +1.49%) and Integrated Oil Index ($XOI +0.43%) both posted gains while the Gold & Silver Index ($XAU -1.20%) lost ground.
PICTURED: The Semiconductor Index ($SOX +2.34%) has rallied since it found support near its 200-day moving average (DMA) line, approaching the record high.
| Oil Services |
$OSX |
62.31 |
+0.91 |
+1.49% |
+40.56% |
| Integrated Oil |
$XOI |
1,206.80 |
+5.23 |
+0.43% |
+52.28% |
| Semiconductor |
$SOX |
3,438.83 |
+78.54 |
+2.34% |
+23.01% |
| Networking |
$NWX |
835.58 |
+5.01 |
+0.60% |
+16.52% |
| Broker/Dealer |
$XBD |
496.10 |
+4.59 |
+0.93% |
+31.38% |
| Retail |
$RLX |
4,169.45 |
+32.41 |
+0.78% |
+17.01% |
| Gold & Silver |
$XAU |
133.50 |
-1.63 |
-1.20% |
-7.41% |
| Bank |
$BKX |
139.49 |
+1.69 |
+1.23% |
+42.47% |
| Biotech |
$BTK |
5,668.06 |
+100.29 |
+1.80% |
-1.24% |
|
|
|
 |
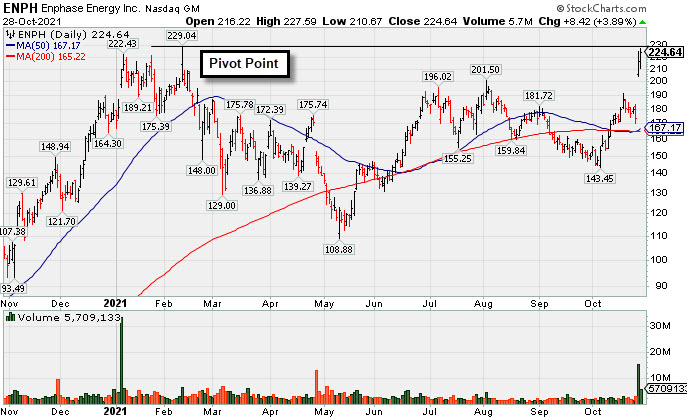
Enphase is Challenging its All-Time High With Volume-Driven Gains
Kenneth J. Gruneisen - Passed the CAN SLIM® Master's Exam
Enphase Energy Inc (ENPH +$8.42 or +3.89% to $224.64) was highlighted in yellow in the earlier mid-day report (read here) with pivot point cited based on its 2/10/21 high plus 10 cents. It challenged its 52-week high with today's 2nd consecutive volume-driven gain after a considerable gap up. Subsequent gains above the pivot point backed by at least +40% above average volume may trigger a technical buy signal.
ENPH has an Earnings Per Share Rating of 98. It reported very strong sales revenues and earnings increases in quarterly comparisons through Sep '21 versus the year ago periods, above the +25% minimum guideline (C criteria). It has a strong annual earnings (A criteria) history since FY '18 after years of losses.
The company hails from the Energy-Solar group which is currently ranked 23rd of the 197 Industry Groups (L criteria). The number of top-rated funds owning its shares rose from 1,068 in Dec '20 to 1,507 in Sep '21, a reassuring sign concerning the I criteria. |
|
|
Color Codes Explained :
Y - Better candidates highlighted by our
staff of experts.
G - Previously featured
in past reports as yellow but may no longer be buyable under the
guidelines.
***Last / Change / Volume data in this table is the closing quote data***
Symbol/Exchange
Company Name
Industry Group |
PRICE |
CHANGE
(%Change) |
Day High |
Volume
(% DAV)
(% 50 day avg vol) |
52 Wk Hi
% From Hi |
Featured
Date |
Price
Featured |
Pivot Featured |
|
Max Buy |
 SIVB
-
NASDAQ
SIVB
-
NASDAQ
S V B Financial Group
BANKING - Regional - Pacific Banks
|
$710.49
|
+2.34
0.33% |
$713.50
|
342,458
97.29% of 50 DAV
50 DAV is 352,000
|
$759.02
-6.39%
|
8/6/2021
|
$589.70
|
PP = $608.94
|
|
MB = $639.39
|
Most Recent Note - 10/27/2021 6:17:42 PM
G - Very extended from the previously noted base, it pulled back today with +12% above average volume. Reported Sep '21 quarterly earnings -14% on +43% sales revenues versus the year ago period, below the +25% minimum earnings guideline (C criteria) raising fundamental concerns. Its 50 DMA line ($629) and prior highs in the $608 area define important near-term support to watch on pullbacks. Completed a new Public Offering on 8/11/21.
>>> FEATURED STOCK ARTICLE : Pullback After 5 Straight Gains into New High Territory - 9/28/2021 |
View all notes |
Set NEW NOTE alert |
Company Profile |
SEC
News |
Chart |
Request a new note
C
A
S
I |
BLDR
-
NYSE
Builders Firstsource Inc
Bldg-Constr Prds/Misc
|
$58.24
|
+1.20
2.10% |
$58.47
|
1,579,430
86.31% of 50 DAV
50 DAV is 1,830,000
|
$60.51
-3.75%
|
8/12/2021
|
$52.38
|
PP = $54.09
|
|
MB = $56.79
|
Most Recent Note - 10/26/2021 5:25:53 PM
G - Pulled back after touching another new all-time high today, marking only its 2nd loss in the span of 16 sessions. Its 50 DMA line and prior highs in the $54 area define important near-term support to watch on pullbacks. Fundamentals remain strong.
>>> FEATURED STOCK ARTICLE : Sputtering After Wedging to New Highs - 10/1/2021 |
View all notes |
Set NEW NOTE alert |
Company Profile |
SEC
News |
Chart |
Request a new note
C
A
S
I |
KFRC
-
NASDAQ
Kforce Inc
Comml Svcs-Staffing
|
$64.42
|
+1.12
1.77% |
$64.81
|
64,415
62.54% of 50 DAV
50 DAV is 103,000
|
$69.00
-6.64%
|
9/10/2021
|
$59.53
|
PP = $64.48
|
|
MB = $67.70
|
Most Recent Note - 10/27/2021 6:26:10 PM
Y - Suffered a 4th consecutive small loss on light volume, testing support near prior highs in the $64 area. Fundamentals remain strong. Its 50 DMA line ($61.48) defines additional near-term support to watch.
>>> FEATURED STOCK ARTICLE : Pulling Back Near Prior Highs Following Technical Breakout - 10/15/2021 |
View all notes |
Set NEW NOTE alert |
Company Profile |
SEC
News |
Chart |
Request a new note
C
A
S
I |
GNRC
-
NYSE
Generac Hldgs Inc
Electrical-Power/Equipmt
|
$503.52
|
+14.64
2.99% |
$510.53
|
680,961
113.87% of 50 DAV
50 DAV is 598,000
|
$497.87
1.13%
|
8/30/2021
|
$449.36
|
PP = $457.10
|
|
MB = $479.96
|
Most Recent Note - 10/27/2021 6:12:45 PM
G - Color code is changed to green after it posted a gain above its "max buy" level today with +30% above average volume. Disciplined investors may noted that a gain and close above the pivot point must be backed by at least +40% above average volume to trigger a proper technical buy signal.
>>> FEATURED STOCK ARTICLE : Prior Lows Define Near-Term Support After 50 DMA Violation - 10/6/2021 |
View all notes |
Set NEW NOTE alert |
Company Profile |
SEC
News |
Chart |
Request a new note
C
A
S
I |
CAMT
-
NASDAQ
Camtek Ltd
ELECTRONICS - Scientific and Technical Instrum
|
$38.34
|
-0.37
-0.96% |
$40.27
|
175,867
113.46% of 50 DAV
50 DAV is 155,000
|
$46.01
-16.67%
|
8/4/2021
|
$39.67
|
PP = $40.57
|
|
MB = $42.60
|
Most Recent Note - 10/27/2021 12:23:19 PM
G - Violating its 50 DMA line ($40.43) with a big volume-driven loss today raising concerns. Weak action came after it reported Sep '21 quarterly earnings +150% versus the year ago period. Volume and volatility often increase near earnings news. The prior low ($34.68 on 8/17/21) defines the next important near-term support to watch. A rebound above the 50 DMA line is needed for its outlook to improve. Fundamentals remain strong.
>>> FEATURED STOCK ARTICLE : Fell Below Prior High and Violated 50-Day Moving Average - 10/5/2021 |
View all notes |
Set NEW NOTE alert |
Company Profile |
SEC
News |
Chart |
Request a new note
C
A
S
I |
Symbol/Exchange
Company Name
Industry Group |
PRICE |
CHANGE
(%Change) |
Day High |
Volume
(% DAV)
(% 50 day avg vol) |
52 Wk Hi
% From Hi |
Featured
Date |
Price
Featured |
Pivot Featured |
|
Max Buy |
PKI
-
NYSE
Perkinelmer Inc
ELECTRONICS - Scientific and Technical Instrum
|
$177.26
|
+3.47
2.00% |
$177.37
|
516,033
84.94% of 50 DAV
50 DAV is 607,500
|
$192.00
-7.68%
|
8/18/2021
|
$181.07
|
PP = $188.50
|
|
MB = $197.93
|
Most Recent Note - 10/27/2021 6:15:00 PM
G - Pulled back today after rebounding near its 50 DMA line which may act as resistance. Subsequent gains above the 50 DMA line ($179.38) are needed for its outlook to improve. Its Relative Strength Rating has slumped to 75, below the 80+ minimum guideline for buy candidates. Fundamentals remain strong.
>>> FEATURED STOCK ARTICLE : Rebound Above 50 DMA Line Needed to Help Outlook Improve - 10/19/2021 |
View all notes |
Set NEW NOTE alert |
Company Profile |
SEC
News |
Chart |
Request a new note
C
A
S
I |
AMD
-
NASDAQ
Advanced Micro Devices
ELECTRONICS - Semiconductor - Broad Line
|
$121.16
|
-1.12
-0.92% |
$123.50
|
55,358,369
121.18% of 50 DAV
50 DAV is 45,683,000
|
$128.08
-5.40%
|
10/27/2021
|
$124.91
|
PP = $122.59
|
|
MB = $128.72
|
Most Recent Note - 10/27/2021 6:07:20 PM
Y - There was a "negative reversal" today for a loss on heavy volume after hitting a new high following 5 consecutive gains. It was highlighted yellow with pivot point cited based on its 8/04/21 high plus 10 cents in the earlier mid-day report. AMD found support near prior highs in the $99 area during its consolidation. Its current Relative Strength rating of 90 is above the 80+ minimum guideline for buy candidates. Fundamentals remain strong after it reported Sep '21 quarterly earnings +78% on +54% sales revenues versus the year ago period. See the latest FSU analysis for more details and a new annotated graph.
>>> FEATURED STOCK ARTICLE : Encountered Distributional Pressure After Reaching New High - 10/27/2021 |
View all notes |
Set NEW NOTE alert |
Company Profile |
SEC
News |
Chart |
Request a new note
C
A
S
I |
UMC
-
NYSE
United Microelectrnc Adr
ELECTRONICS - Semiconductor - Integrated Cir
|
$10.59
|
-0.27
-2.49% |
$10.74
|
14,537,511
190.68% of 50 DAV
50 DAV is 7,624,000
|
$12.62
-16.09%
|
8/5/2021
|
$11.62
|
PP = $11.38
|
|
MB = $11.95
|
Most Recent Note - 10/27/2021 1:10:46 PM
G - Posting a 3rd consecutive volume-driven gain today. Reported Sep '21 quarterly earnings +100% on +30% sales revenues versus the year ago period. Found support above its 200 DMA line ($9.91). A rebound above the 50 DMA line ($11.17) still is needed for its outlook to improve. Volume and volatility often increase near earnings news. See the latest FSU analysis for more details and an annotated graph.
>>> FEATURED STOCK ARTICLE : Earnings News Due From Taiwan-Based Semiconductor Firm - 10/26/2021 |
View all notes |
Set NEW NOTE alert |
Company Profile |
SEC
News |
Chart |
Request a new note
C
A
S
I |
BRKS
-
NASDAQ
Brooks Automation
ELECTRONICS - Semiconductor Equipment and Mate
|
$113.65
|
+3.52
3.20% |
$114.21
|
571,588
95.74% of 50 DAV
50 DAV is 597,000
|
$111.39
2.03%
|
9/20/2021
|
$101.21
|
PP = $108.82
|
|
MB = $114.26
|
 Most Recent Note - 10/28/2021 4:52:00 PM
Y - Gapped up and hit a new high today with near average volume, not above average volume indicative of great institutional buying demand. Pivot point cited was based on its 4/27/21 high plus 10 cents. It has been repeatedly noted - "Subsequent gains above the pivot point or prior highs backed by at least 40% above average volume may trigger a convincing technical buy signal."
>>> FEATURED STOCK ARTICLE : 5th Quiet Gain Has Brooks Perched Near Prior Highs - 10/20/2021 |
View all notes |
Set NEW NOTE alert |
Company Profile |
SEC
News |
Chart |
Request a new note
C
A
S
I |
ENTG
-
NASDAQ
Entegris Inc
ELECTRONICS - Semiconductor Equipment and Mate
|
$138.71
|
+3.68
2.73% |
$139.26
|
844,811
112.64% of 50 DAV
50 DAV is 750,000
|
$138.70
0.01%
|
8/4/2021
|
$125.33
|
PP = $126.51
|
|
MB = $132.84
|
Most Recent Note - 10/27/2021 12:32:35 PM
G - Perched near its all-time high and consolidating above its "max buy" level. Its 50 DMA line ($124.73) defines near-term support to watch above the prior low ($118).
>>> FEATURED STOCK ARTICLE : Hit New Record High With Another Volume-Driven Gain - 10/22/2021 |
View all notes |
Set NEW NOTE alert |
Company Profile |
SEC
News |
Chart |
Request a new note
C
A
S
I |
Symbol/Exchange
Company Name
Industry Group |
PRICE |
CHANGE
(%Change) |
Day High |
Volume
(% DAV)
(% 50 day avg vol) |
52 Wk Hi
% From Hi |
Featured
Date |
Price
Featured |
Pivot Featured |
|
Max Buy |
CLFD
-
NASDAQ
Clearfield Inc
TELECOMMUNICATIONS - Cables / Satalite Equipment
|
$57.07
|
+2.58
4.73% |
$57.20
|
79,225
92.12% of 50 DAV
50 DAV is 86,000
|
$56.23
1.49%
|
7/23/2021
|
$40.23
|
PP = $43.74
|
|
MB = $45.93
|
Most Recent Note - 10/28/2021 4:53:38 PM
G -Hit yet another new all-time high with today's 3rd consecutive volume-driven gain, getting very extended from the previously noted base. Its 50 DMA line ($47.39) and prior highs in the $46 area define near-term support where damaging losses may trigger technical sell signals. Due to report Sep '21 quarterly results on 11/04/21.
>>> FEATURED STOCK ARTICLE : Extended From Prior Base After Latest Rally - 10/18/2021 |
View all notes |
Set NEW NOTE alert |
Company Profile |
SEC
News |
Chart |
Request a new note
C
A
S
I |
TGH
-
NYSE
Textainer Group Holdings
TRANSPORTATION - Logistics
|
$40.33
|
+1.96
5.11% |
$40.44
|
408,605
93.93% of 50 DAV
50 DAV is 435,000
|
$39.99
0.85%
|
10/7/2021
|
$36.97
|
PP = $36.80
|
|
MB = $38.64
|
Most Recent Note - 10/28/2021 4:42:30 PM
G - Color code is changed to green as it hit yet another new 52-week high and rallied above its "max buy" level with today's big gain backed by near average volume. Its 50 DMA line ($34.81) defines important near-term support to watch. Fundamentals remain strong.
>>> FEATURED STOCK ARTICLE : Perched Near High With Strong Fundamentals - 10/7/2021 |
View all notes |
Set NEW NOTE alert |
Company Profile |
SEC
News |
Chart |
Request a new note
C
A
S
I |
ENPH
-
NASDAQ
Enphase Energy Inc
Energy-Solar
|
$224.64
|
+8.42
3.89% |
$227.59
|
5,633,583
271.63% of 50 DAV
50 DAV is 2,074,000
|
$229.04
-1.92%
|
10/28/2021
|
$218.00
|
PP = $229.14
|
|
MB = $240.60
|
Most Recent Note - 10/28/2021 4:37:19 PM
Y - Color code was changed to yellow with pivot point cited based on its 2/10/21 high plus 10 cents when highlighted in the earlier mid-day report. Challenged its 52-week high with today's 2nd consecutive volume-driven gain after a considerable gap up. Subsequent gains above the pivot point backed by at least +40% above average volume may trigger a technical buy signal. Reported very strong sales revenues and earnings increases in quarterly comparisons through Sep '21 versus the year ago periods, satisfying the C criteria. Strong annual earnings since FY '18 after years of losses. See the latest FSU analysis for more details and a new annotated graph.
>>> FEATURED STOCK ARTICLE : Enphase is Challenging its All-Time High With Volume-Driven Gains - 10/28/2021 |
View all notes |
Set NEW NOTE alert |
Company Profile |
SEC
News |
Chart |
Request a new note
C
A
S
I |
SMPL
-
NASDAQ
Simply Good Foods Co
Food-Confectionery
|
$40.15
|
+1.29
3.32% |
$40.30
|
297,703
83.39% of 50 DAV
50 DAV is 357,000
|
$40.26
-0.27%
|
10/25/2021
|
$38.30
|
PP = $38.60
|
|
MB = $40.53
|
Most Recent Note - 10/28/2021 4:50:00 PM
Y - Hit another new 52-week high with today's gain approaching its "max buy" level. Volume-driven gains this week triggered a new (or add-on) technical buy signal. Bullish action came after it reported Aug '21 quarterly earnings +45% on +17% sales revenues versus the year ago period. Its Relative Strength Rating has improved to 87. Found support above its 200 DMA line ($33.78) and recent low ($33.55 on 9/20/21).
>>> FEATURED STOCK ARTICLE : Consolidating Just Above 50-Day Moving Average Line - 10/12/2021 |
View all notes |
Set NEW NOTE alert |
Company Profile |
SEC
News |
Chart |
Request a new note
C
A
S
I |
WDAY
-
NASDAQ
Workday Inc Cl A
Computer Sftwr-Enterprse
|
$286.74
|
+3.61
1.28% |
$288.58
|
871,576
56.01% of 50 DAV
50 DAV is 1,556,000
|
$286.55
0.07%
|
9/7/2021
|
$275.69
|
PP = $282.87
|
|
MB = $297.01
|
Most Recent Note - 10/25/2021 5:14:24 PM
Y - Posted a gain today with average volume for a best-ever close and no resistance remains due to overhead supply. Its 50 DMA line ($261.82).defines near-term support to watch where a violation would raise concerns. Fundamentals remain strong.
>>> FEATURED STOCK ARTICLE : Rebounding From 50-Day Moving Average Toward Prior Highs - 10/13/2021 |
View all notes |
Set NEW NOTE alert |
Company Profile |
SEC
News |
Chart |
Request a new note
C
A
S
I |
Symbol/Exchange
Company Name
Industry Group |
PRICE |
CHANGE
(%Change) |
Day High |
Volume
(% DAV)
(% 50 day avg vol) |
52 Wk Hi
% From Hi |
Featured
Date |
Price
Featured |
Pivot Featured |
|
Max Buy |
CTLT
-
NYSE
Catalent Inc
DRUGS - Biotechnology
|
$135.48
|
+2.46
1.85% |
$136.73
|
460,421
51.44% of 50 DAV
50 DAV is 895,000
|
$142.64
-5.02%
|
8/25/2021
|
$128.72
|
PP = $127.78
|
|
MB = $134.17
|
Most Recent Note - 10/26/2021 5:28:47 PM
Y - Posted a gain with higher volume today and closed back above its 50 DMA line ($132.56). Prior highs in the $124-127 area which define the next important near-term support to watch. Fundamentals remain strong. Due to report Sep '21 quarterly results on 11/02/21.
>>> FEATURED STOCK ARTICLE : Found Support Near Prior High While Consolidating - 10/8/2021 |
View all notes |
Set NEW NOTE alert |
Company Profile |
SEC
News |
Chart |
Request a new note
C
A
S
I |
MEDP
-
NASDAQ
Medpace Holdings Inc
Medical-Research Eqp/Svc
|
$219.71
|
+9.11
4.33% |
$219.92
|
194,453
107.43% of 50 DAV
50 DAV is 181,000
|
$217.31
1.10%
|
9/10/2021
|
$196.32
|
PP = $196.22
|
|
MB = $206.03
|
Most Recent Note - 10/28/2021 4:47:31 PM
G - Hit another new 52-week high and rallied above its "max buy" level with today's big gain on average volume and its color code is changed to green. Bullish action came after it reported Sep '21 earnings +18% on +28% sales revenues versus the year ago period, below the +25% minimum earnings guideline (C criteria), raising fundamental concerns. Prior highs in the $199 area define initial support above its 50 DMA line ($188.74).
>>> FEATURED STOCK ARTICLE : Found Prompt Support Near 50-Day Moving Average Line - 10/14/2021 |
View all notes |
Set NEW NOTE alert |
Company Profile |
SEC
News |
Chart |
Request a new note
C
A
S
I |
JEF
-
NYSE
Jefferies Financial Grp
Finance-Invest Bnk/Bkrs
|
$43.02
|
+0.83
1.97% |
$43.03
|
1,800,248
97.36% of 50 DAV
50 DAV is 1,849,000
|
$43.60
-1.33%
|
6/28/2021
|
$31.81
|
PP = $34.42
|
|
MB = $36.14
|
Most Recent Note - 10/25/2021 5:10:33 PM
G - Very extended from any sound base, it posted a 17th consecutive gain today for another new all-time high. Its 50 DMA line ($37.86) defines important near-term support to watch on pullbacks. Reported Aug '21 quarterly earnings +713% on +70% sales revenues versus the year ago period.
>>> FEATURED STOCK ARTICLE : Perched at 52-week High With Earnings News Due - 9/29/2021 |
View all notes |
Set NEW NOTE alert |
Company Profile |
SEC
News |
Chart |
Request a new note
C
A
S
I |
AVTR
-
NYSE
Avantor Inc
Medical-Research Eqp/Svc
|
$38.30
|
+1.37
3.71% |
$38.32
|
5,622,429
140.91% of 50 DAV
50 DAV is 3,990,000
|
$44.37
-13.68%
|
6/10/2021
|
$32.94
|
PP = $34.09
|
|
MB = $35.79
|
Most Recent Note - 10/28/2021 4:44:48 PM
G - Posted a volume-driven gain today. After the close it reported Sep '21 quarterly earnings +46% above the year ago period. Volume and volatility often increase near earnings news. A rebound above the 50 DMA line ($40.30) is needed for its outlook to improve. Completed a Secondary Offering on 9/13/21 while perched at its all-time high, very extended from any sound base.
>>> FEATURED STOCK ARTICLE : Pulled Back Finding Support Near 50-Day Moving Average - 10/11/2021 |
View all notes |
Set NEW NOTE alert |
Company Profile |
SEC
News |
Chart |
Request a new note
C
A
S
I |
MIME
-
NASDAQ
Mimecast Limited
Computer Sftwr-Security
|
$75.16
|
+6.22
9.02% |
$75.46
|
1,318,328
142.37% of 50 DAV
50 DAV is 926,000
|
$71.84
4.62%
|
10/18/2021
|
$68.17
|
PP = $71.55
|
|
MB = $75.13
|
Most Recent Note - 10/28/2021 4:40:35 PM
G - Color code is changed to green after today's big volume-driven gain for a new all-time high triggered a technical buy signal but it quickly rallied above its "max buy" level. Fundamentals remain strong. New pivot point cited was based on its 9/03/21 high plus 10 cents. Prior highs in the $71 area define initial support above its 50 DMA line ($66.64) .
>>> FEATURED STOCK ARTICLE : MIME Consolidating Less Than 4% Off High Building New Base - 10/21/2021 |
View all notes |
Set NEW NOTE alert |
Company Profile |
SEC
News |
Chart |
Request a new note
C
A
S
I |
Symbol/Exchange
Company Name
Industry Group |
PRICE |
CHANGE
(%Change) |
Day High |
Volume
(% DAV)
(% 50 day avg vol) |
52 Wk Hi
% From Hi |
Featured
Date |
Price
Featured |
Pivot Featured |
|
Max Buy |
ZD
-
NASDAQ
Ziff Davis Inc
Internet-Content
|
$128.60
|
+0.91
0.71% |
$130.45
|
433,204
106.70% of 50 DAV
50 DAV is 406,000
|
$130.90
-1.76%
|
10/25/2021
|
$126.07
|
PP = $128.19
|
|
MB = $134.60
|
Most Recent Note - 10/25/2021 5:04:54 PM
Y - Perched within close striking distance of its 52-week high after today's 5th consecutive gain. Color code was changed to yellow with pivot point cited based on its 7/29/21 high plus 10 cents. A solid gain and close above the pivot point backed by at least +40% above average volume may trigger a technical buy signal. Quarterly and annual earnings (C and A criteria) history has been strong. See the latest FSU analysis for more details and a new annotated graph.
>>> FEATURED STOCK ARTICLE : Internet Content Firm Perched Near Prior High - 10/25/2021 |
View all notes |
Set NEW NOTE alert |
Company Profile |
SEC
News |
Chart |
Request a new note
C
A
S
I |
|
|
|
THESE ARE NOT BUY RECOMMENDATIONS!
Comments contained in the body of this report are technical
opinions only. The material herein has been obtained
from sources believed to be reliable and accurate, however,
its accuracy and completeness cannot be guaranteed.
This site is not an investment advisor, hence it does
not endorse or recommend any securities or other investments.
Any recommendation contained in this report may not
be suitable for all investors and it is not to be deemed
an offer or solicitation on our part with respect to
the purchase or sale of any securities. All trademarks,
service marks and trade names appearing in this report
are the property of their respective owners, and are
likewise used for identification purposes only.
This report is a service available
only to active Paid Premium Members.
You may opt-out of receiving report notifications
at any time. Questions or comments may be submitted
by writing to Premium Membership Services 665 S.E. 10 Street, Suite 201 Deerfield Beach, FL 33441-5634 or by calling 1-800-965-8307
or 954-785-1121.
|
|
|