You are not logged in.
This means you
CAN ONLY VIEW reports that were published prior to Thursday, March 20, 2025.
You
MUST UPGRADE YOUR MEMBERSHIP if you want to see any current reports.
AFTER MARKET UPDATE - TUESDAY, OCTOBER 26TH, 2021
Previous After Market Report Next After Market Report >>>
|
|
|
|
DOW |
+15.73 |
35,756.88 |
+0.04% |
|
Volume |
801,191,270 |
-1% |
|
Volume |
6,979,516,700 |
+25% |
|
NASDAQ |
+9.01 |
15,235.71 |
+0.06% |
|
Advancers |
1,495 |
46% |
|
Advancers |
2,067 |
46% |
|
S&P 500 |
+8.31 |
4,574.79 |
+0.18% |
|
Decliners |
1,787 |
54% |
|
Decliners |
2,466 |
54% |
|
Russell 2000 |
-16.56 |
2,296.08 |
-0.72% |
|
52 Wk Highs |
202 |
|
|
52 Wk Highs |
236 |
|
|
S&P 600 |
-12.39 |
1,380.48 |
-0.89% |
|
52 Wk Lows |
26 |
|
|
52 Wk Lows |
83 |
|
|
 |
Breadth Slightly Negative While Major Indices Inched Higher
Kenneth J. Gruneisen - Passed the CAN SLIM® Master's Exam
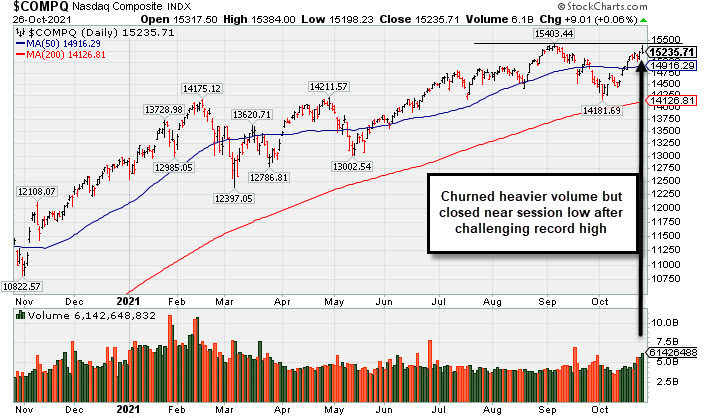
The Dow inched up for a third straight session, adding 15 points, while the S&P 500 rose 0.2%, with both benchmarks notching new record levels. The Nasdaq Composite edged 0.1% higher. The volume totals reported were mixed, lighter than the prior session on the NYSE and higher on the Nasdaq exchange. Breadth was negative as decliners led advancers by a 6-5 margin on the NYSE and by a 5-4 margin on the Nasdaq exchange. There were 90 high-ranked companies from the Leaders List that hit new 52-week highs and were listed on the BreakOuts Page versus the total of 115 on the prior session. New 52-week highs totals outnumbered new 52-week lows totals on both the NYSE and the Nasdaq exchange. The major indices (M criteria) are in a confirmed uptrend. Investors are reminded to only make proper new buys as per the fundamental and technical rules of the fact-based investment system.
PICTURED: The Nasdaq Composite Index churned heavier volume and closed near the session low after challenging its record high.
U.S. stocks finished higher on Tuesday as investors digested a flurry of corporate earnings results and economic updates. Developments in Washington also buoyed sentiment, with Democratic lawmakers reportedly nearing a social spending deal, which would pave the way for a House vote on the bipartisan infrastructure plan.
In earnings, Facebook (FB -3.92%) fell as a disappointing revenue outlook overshadowed robust user growth and a $50 billion buyback plan. In Industrials, United Parcel Service (UPS +6.95%) jumped after easily topping Wall Street estimates and increasing its 2021 operating margin projections. Meanwhile, defense contractor Lockheed Martin (LMT -11.80%) fell following a revenue miss and downbeat guidance. Elsewhere, Hasbro (HAS +3.23%) rose after exceeding expectations despite warning that supply chain bottlenecks would likely pressure holiday sales. In other corporate news, chipmaker NVIDA (NVDA +6.70%) surged to a fresh all-time high amid positive analyst commentary.
On the data front, the Conference Board’s gauge of consumer confidence unexpectedly improved in October, ending a three-month stretch of declines. Separately, new home sales surged 14% in September to the highest level since March. Additionally, S&P CoreLogic Case-Shiller’s measure of home prices in 20 U.S. cities moderated for the first time in 14 months in August. Treasuries were mixed, with the yield on the 10-year note down two basis points to 1.61%. In commodities, WTI crude rallied 1% to $84.62/barrel. |
 Kenneth J. Gruneisen started out as a licensed stockbroker in August 1987, a couple of months prior to the historic stock market crash that took the Dow Jones Industrial Average down -22.6% in a single day. He has published daily fact-based fundamental and technical analysis on high-ranked stocks online for two decades. Through FACTBASEDINVESTING.COM, Kenneth provides educational articles, news, market commentary, and other information regarding proven investment systems that work in good times and bad.
Comments contained in the body of this report are technical opinions only and are not necessarily those of Gruneisen Growth Corp. The material herein has been obtained from sources believed to be reliable and accurate, however, its accuracy and completeness cannot be guaranteed. Our firm, employees, and customers may effect transactions, including transactions contrary to any recommendation herein, or have positions in the securities mentioned herein or options with respect thereto. Any recommendation contained in this report may not be suitable for all investors and it is not to be deemed an offer or solicitation on our part with respect to the purchase or sale of any securities. |
|
 |
Retail and Integrated Oil Indexes Posted Gains
Kenneth J. Gruneisen - Passed the CAN SLIM® Master's Exam
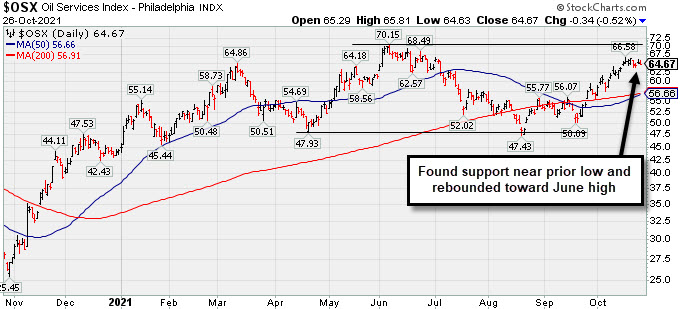
The Retail Index ($RLX +0.65%) had a positive influence on the major averages while the Broker/Dealer Index ($XBD -0.58%) and Bank Index ($BKX -0.43%) both fell and created a drag. The tech sector was indecisive as the Semiconductor Index ($SOX +0.02%) finished flat as the Biotech Index ($BTK -0.13%) and Networking Index ($NWX -0.22%) inched lower on the session. The Gold & Silver Index ($XAU -0.43%) and Oil Services Index ($OSX -0.52%) both edged lower while the Integrated Oil Index ($XOI +0.42%) posted a small gain.
PICTURED: The Oil Services Index ($OSX -0.52%) found support near the prior low and has rebounded above its 50-day and 200-day moving average (DMA) lines toward its June high.
| Oil Services |
$OSX |
64.67 |
-0.34 |
-0.52% |
+45.89% |
| Integrated Oil |
$XOI |
1,230.89 |
+5.15 |
+0.42% |
+55.32% |
| Semiconductor |
$SOX |
3,392.96 |
+0.57 |
+0.02% |
+21.37% |
| Networking |
$NWX |
823.17 |
-1.82 |
-0.22% |
+14.79% |
| Broker/Dealer |
$XBD |
500.65 |
-2.92 |
-0.58% |
+32.59% |
| Retail |
$RLX |
4,131.25 |
+26.80 |
+0.65% |
+15.94% |
| Gold & Silver |
$XAU |
136.12 |
-0.58 |
-0.43% |
-5.60% |
| Bank |
$BKX |
141.52 |
-0.61 |
-0.43% |
+44.55% |
| Biotech |
$BTK |
5,656.25 |
-7.44 |
-0.13% |
-1.44% |
|
|
|
 |
Earnings News Due From Taiwan-Based Semiconductor Firm
Kenneth J. Gruneisen - Passed the CAN SLIM® Master's Exam
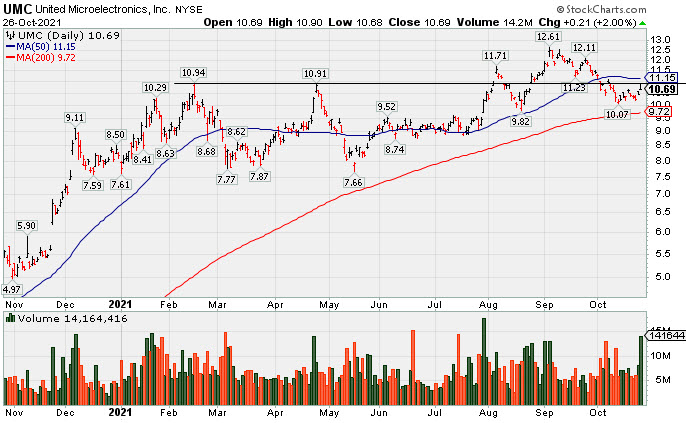
United Microelectronics Inc Adr (UMC +$0.21 or +2.00% to $10.69) posted a volume-driven gain today but ended near the session low. It recently found support above its 200-day moving average (DMA) line ($9.90). A rebound above the 50 DMA line ($11.15) still is needed for its outlook to improve. It is due to report Sep '21 quarterly results before the open on Wednesday, 10/27/21. Volume and volatility often increase near earnings news.
UMC was highlighted in yellow with pivot point cited based on its 2/16/21 high plus 10 cents in the 8/05/21 mid-day report (read here). It gapped up hitting a new all-time high with a solid gain and strong close above the pivot point backed by +72% above average volume triggering a technical buy signal. It was last shown in this FSU section on 9/27/21 with an annotated graph under the headline "Consolidating Above 50-day Moving Average Near 'Max Buy' Level".
The high-ranked ELECTRONICS - Semiconductor - Integrated Circuits firm reported Jun '21 quarterly earnings +100% on +21% sales revenues versus the year ago period. Recent quarters showed solid earnings and improved sales revenues increases satisfying the C criteria. Annual earnings (A criteria) growth has been strong after a noted downturn in FY '18. It has a 93 Earnings Per Share (EPS) rating.
The number of top rated funds owning its shares rose from 65 in Sep '20 to 97 in Sep '21, a reassuring sign concerning the I criteria. Its current Up/Down Volume Ratio of 1.0 is an unbiased indication its shares have been neutral concerning accumulation/distribution over the past 50 days.
|
|
|
Color Codes Explained :
Y - Better candidates highlighted by our
staff of experts.
G - Previously featured
in past reports as yellow but may no longer be buyable under the
guidelines.
***Last / Change / Volume data in this table is the closing quote data***
Symbol/Exchange
Company Name
Industry Group |
PRICE |
CHANGE
(%Change) |
Day High |
Volume
(% DAV)
(% 50 day avg vol) |
52 Wk Hi
% From Hi |
Featured
Date |
Price
Featured |
Pivot Featured |
|
Max Buy |
 SIVB
-
NASDAQ
SIVB
-
NASDAQ
S V B Financial Group
BANKING - Regional - Pacific Banks
|
$745.32
|
-0.69
-0.09% |
$751.84
|
228,774
64.99% of 50 DAV
50 DAV is 352,000
|
$759.02
-1.80%
|
8/6/2021
|
$589.70
|
PP = $608.94
|
|
MB = $639.39
|
Most Recent Note - 10/22/2021 5:22:39 PM
G - Reported Sep '21 quarterly earnings -26% on +43% sales revenues versus the year ago period, below the +25% minimum earnings guideline (C criteria) raising fundamental concerns. Gapped up today and hit another new new all-time high with a big gain on +84% above average volume, getting very extended from the previously noted base. Its 50 DMA line ($620) and prior highs in the $608 area define important near-term support to watch on pullbacks. Completed a new Public Offering on 8/11/21.
>>> FEATURED STOCK ARTICLE : Pullback After 5 Straight Gains into New High Territory - 9/28/2021 |
View all notes |
Set NEW NOTE alert |
Company Profile |
SEC
News |
Chart |
Request a new note
C
A
S
I |
BLDR
-
NYSE
Builders Firstsource Inc
Bldg-Constr Prds/Misc
|
$58.76
|
-1.38
-2.29% |
$60.51
|
2,014,536
107.56% of 50 DAV
50 DAV is 1,873,000
|
$60.18
-2.36%
|
8/12/2021
|
$52.38
|
PP = $54.09
|
|
MB = $56.79
|
 Most Recent Note - 10/26/2021 5:25:53 PM
G - Pulled back after touching another new all-time high today, marking only its 2nd loss in the span of 16 sessions. Its 50 DMA line and prior highs in the $54 area define important near-term support to watch on pullbacks. Fundamentals remain strong.
>>> FEATURED STOCK ARTICLE : Sputtering After Wedging to New Highs - 10/1/2021 |
View all notes |
Set NEW NOTE alert |
Company Profile |
SEC
News |
Chart |
Request a new note
C
A
S
I |
KFRC
-
NASDAQ
Kforce Inc
Comml Svcs-Staffing
|
$64.04
|
-1.06
-1.63% |
$64.98
|
51,604
49.15% of 50 DAV
50 DAV is 105,000
|
$69.00
-7.19%
|
9/10/2021
|
$59.53
|
PP = $64.48
|
|
MB = $67.70
|
Most Recent Note - 10/21/2021 8:56:15 PM
Y - Finding support near prior highs in the $64 area after volume-driven gains. Fundamentals remain strong. It s50 DMA line defines additional near-term support to watch.
>>> FEATURED STOCK ARTICLE : Pulling Back Near Prior Highs Following Technical Breakout - 10/15/2021 |
View all notes |
Set NEW NOTE alert |
Company Profile |
SEC
News |
Chart |
Request a new note
C
A
S
I |
GNRC
-
NYSE
Generac Hldgs Inc
Electrical-Power/Equipmt
|
$472.71
|
+2.59
0.55% |
$479.15
|
457,819
75.92% of 50 DAV
50 DAV is 603,000
|
$476.31
-0.76%
|
8/30/2021
|
$449.36
|
PP = $457.10
|
|
MB = $479.96
|
Most Recent Note - 10/21/2021 8:59:03 PM
Y - Posted a gain today with light volume for a best-ever close. Disciplined investors may watch for a gain and close above the pivot point backed by at least +40% above average volume to trigger a proper technical buy signal.
>>> FEATURED STOCK ARTICLE : Prior Lows Define Near-Term Support After 50 DMA Violation - 10/6/2021 |
View all notes |
Set NEW NOTE alert |
Company Profile |
SEC
News |
Chart |
Request a new note
C
A
S
I |
CAMT
-
NASDAQ
Camtek Ltd
ELECTRONICS - Scientific and Technical Instrum
|
$41.23
|
+1.14
2.84% |
$41.56
|
155,877
101.22% of 50 DAV
50 DAV is 154,000
|
$46.01
-10.39%
|
8/4/2021
|
$39.67
|
PP = $40.57
|
|
MB = $42.60
|
Most Recent Note - 10/21/2021 8:53:53 PM
G - Volume totals have been cooling while still sputtering below its 50 DMA line ($40.17), meeting resistance at that important short-term average. The prior low ($34.68 on 8/17/21) defines the next important near-term support to watch. A rebound above the 50 DMA line is needed for its outlook to improve. Fundamentals remain strong.
>>> FEATURED STOCK ARTICLE : Fell Below Prior High and Violated 50-Day Moving Average - 10/5/2021 |
View all notes |
Set NEW NOTE alert |
Company Profile |
SEC
News |
Chart |
Request a new note
C
A
S
I |
Symbol/Exchange
Company Name
Industry Group |
PRICE |
CHANGE
(%Change) |
Day High |
Volume
(% DAV)
(% 50 day avg vol) |
52 Wk Hi
% From Hi |
Featured
Date |
Price
Featured |
Pivot Featured |
|
Max Buy |
PKI
-
NYSE
Perkinelmer Inc
ELECTRONICS - Scientific and Technical Instrum
|
$176.98
|
-0.21
-0.12% |
$178.94
|
281,751
45.32% of 50 DAV
50 DAV is 621,700
|
$192.00
-7.82%
|
8/18/2021
|
$181.07
|
PP = $188.50
|
|
MB = $197.93
|
Most Recent Note - 10/20/2021 5:39:46 PM
G - Posted a 6th consecutive gain with below average volume. A rebound above the 50 DMA line ($180) is needed for its outlook to improve. Its Relative Strength Rating improved to 81, one notch above the 80+ minimum guideline for buy candidates. Fundamentals remain strong. See the latest FSU analysis for more details and an annotated graph.
>>> FEATURED STOCK ARTICLE : Rebound Above 50 DMA Line Needed to Help Outlook Improve - 10/19/2021 |
View all notes |
Set NEW NOTE alert |
Company Profile |
SEC
News |
Chart |
Request a new note
C
A
S
I |
UMC
-
NYSE
United Microelectrnc Adr
ELECTRONICS - Semiconductor - Integrated Cir
|
$10.69
|
+0.21
2.00% |
$10.90
|
14,164,416
195.72% of 50 DAV
50 DAV is 7,237,200
|
$12.62
-15.29%
|
8/5/2021
|
$11.62
|
PP = $11.38
|
|
MB = $11.95
|
Most Recent Note - 10/26/2021 5:22:37 PM
G - Posted a volume-driven gain today but ended near the session low. Found support above its 200 DMA line ($9.90). A rebound above the 50 DMA line ($11.15) still is needed for its outlook to improve. Due to report Sep '21 quarterly results before the open on Wednesday, 10/27/21. Volume and volatility often increase near earnings news. See the latest FSU analysis for more details and a new annotated graph.
>>> FEATURED STOCK ARTICLE : Earnings News Due From Taiwan-Based Semiconductor Firm - 10/26/2021 |
View all notes |
Set NEW NOTE alert |
Company Profile |
SEC
News |
Chart |
Request a new note
C
A
S
I |
BRKS
-
NASDAQ
Brooks Automation
ELECTRONICS - Semiconductor Equipment and Mate
|
$109.35
|
-0.48
-0.44% |
$111.39
|
665,056
112.34% of 50 DAV
50 DAV is 592,000
|
$110.40
-0.95%
|
9/20/2021
|
$101.21
|
PP = $108.82
|
|
MB = $114.26
|
Most Recent Note - 10/20/2021 5:28:10 PM
Y - Posted a 5th consecutive gain today with lighter than average volume. Still perched within striking distance of its 52-week high. Pivot point cited was based on its 4/27/21 high plus 10 cents. Subsequent gains above the pivot point or prior highs backed by at least 40% above average volume may trigger a convincing technical buy signal. See the latest FSU analysis for more details and a new annotated graph.
>>> FEATURED STOCK ARTICLE : 5th Quiet Gain Has Brooks Perched Near Prior Highs - 10/20/2021 |
View all notes |
Set NEW NOTE alert |
Company Profile |
SEC
News |
Chart |
Request a new note
C
A
S
I |
ENTG
-
NASDAQ
Entegris Inc
ELECTRONICS - Semiconductor Equipment and Mate
|
$132.85
|
-3.20
-2.35% |
$137.16
|
991,381
136.18% of 50 DAV
50 DAV is 728,000
|
$138.70
-4.22%
|
8/4/2021
|
$125.33
|
PP = $126.51
|
|
MB = $132.84
|
Most Recent Note - 10/26/2021 5:30:51 PM
G - Pulled back for a 2nd volume-driven loss today closing near its "max buy" level. Its 50 DMA line ($124) defines near-term support to watch above the prior low ($118).
>>> FEATURED STOCK ARTICLE : Hit New Record High With Another Volume-Driven Gain - 10/22/2021 |
View all notes |
Set NEW NOTE alert |
Company Profile |
SEC
News |
Chart |
Request a new note
C
A
S
I |
CLFD
-
NASDAQ
Clearfield Inc
TELECOMMUNICATIONS - Cables / Satalite Equipment
|
$53.28
|
+2.35
4.61% |
$53.49
|
115,955
139.70% of 50 DAV
50 DAV is 83,000
|
$54.49
-2.22%
|
7/23/2021
|
$40.23
|
PP = $43.74
|
|
MB = $45.93
|
Most Recent Note - 10/26/2021 5:27:35 PM
G - Posted a solid gain with above average volume today for its 2nd best ever close. It is extended from the previously noted base. Prior highs in the $46 area define near-term support along with its 50 DMA line ($46.80) where damaging losses may trigger technical sell signals. Due to report Sep '21 quarterly results on 11/04/21.
>>> FEATURED STOCK ARTICLE : Extended From Prior Base After Latest Rally - 10/18/2021 |
View all notes |
Set NEW NOTE alert |
Company Profile |
SEC
News |
Chart |
Request a new note
C
A
S
I |
Symbol/Exchange
Company Name
Industry Group |
PRICE |
CHANGE
(%Change) |
Day High |
Volume
(% DAV)
(% 50 day avg vol) |
52 Wk Hi
% From Hi |
Featured
Date |
Price
Featured |
Pivot Featured |
|
Max Buy |
TGH
-
NYSE
Textainer Group Holdings
TRANSPORTATION - Logistics
|
$38.85
|
-0.61
-1.55% |
$39.99
|
577,053
130.85% of 50 DAV
50 DAV is 441,000
|
$39.73
-2.21%
|
10/7/2021
|
$36.97
|
PP = $36.80
|
|
MB = $38.64
|
Most Recent Note - 10/25/2021 1:05:55 PM
Y - Hitting another new 52-week high and trading near its "max buy" level with today's big gain backed by above average volume. Its 50 DMA line ($34.46) defines important near-term support to watch. Fundamentals remain strong.
>>> FEATURED STOCK ARTICLE : Perched Near High With Strong Fundamentals - 10/7/2021 |
View all notes |
Set NEW NOTE alert |
Company Profile |
SEC
News |
Chart |
Request a new note
C
A
S
I |
SMPL
-
NASDAQ
Simply Good Foods Co
Food-Confectionery
|
$39.70
|
+0.88
2.27% |
$39.91
|
654,750
186.01% of 50 DAV
50 DAV is 352,000
|
$39.45
0.63%
|
10/25/2021
|
$38.30
|
PP = $38.60
|
|
MB = $40.53
|
Most Recent Note - 10/26/2021 5:34:19 PM
Y - Hit another new 52-week high with today's 4th consecutive volume-driven gain. Color code was changed to yellow with new pivot point cited based on its 7/01/21 high plus 10 cents. A gain and strong close above its pivot point on the prior session triggered a new (or add-on) technical buy signal. Bullish action came after it reported Aug '21 quarterly earnings +45% on +17% sales revenues versus the year ago period. Volume and volatility often increase near earnings news. Its Relative Strength Rating has improved to 87. Found support above its 200 DMA line ($33.67) and recent low ($33.55 on 9/20/21).
>>> FEATURED STOCK ARTICLE : Consolidating Just Above 50-Day Moving Average Line - 10/12/2021 |
View all notes |
Set NEW NOTE alert |
Company Profile |
SEC
News |
Chart |
Request a new note
C
A
S
I |
WDAY
-
NYSE
Workday Inc Cl A
Computer Sftwr-Enterprse
|
$282.76
|
+0.61
0.22% |
$285.85
|
867,660
55.57% of 50 DAV
50 DAV is 1,561,300
|
$284.80
-0.72%
|
9/7/2021
|
$275.69
|
PP = $282.87
|
|
MB = $297.01
|
Most Recent Note - 10/25/2021 5:14:24 PM
Y - Posted a gain today with average volume for a best-ever close and no resistance remains due to overhead supply. Its 50 DMA line ($261.82).defines near-term support to watch where a violation would raise concerns. Fundamentals remain strong.
>>> FEATURED STOCK ARTICLE : Rebounding From 50-Day Moving Average Toward Prior Highs - 10/13/2021 |
View all notes |
Set NEW NOTE alert |
Company Profile |
SEC
News |
Chart |
Request a new note
C
A
S
I |
CTLT
-
NYSE
"Catalent, Inc"
DRUGS - Biotechnology
|
$133.51
|
+2.62
2.00% |
$134.14
|
943,553
105.46% of 50 DAV
50 DAV is 894,700
|
$142.64
-6.40%
|
8/25/2021
|
$128.72
|
PP = $127.78
|
|
MB = $134.17
|
Most Recent Note - 10/26/2021 5:28:47 PM
Y - Posted a gain with higher volume today and closed back above its 50 DMA line ($132.56). Prior highs in the $124-127 area which define the next important near-term support to watch. Fundamentals remain strong. Due to report Sep '21 quarterly results on 11/02/21.
>>> FEATURED STOCK ARTICLE : Found Support Near Prior High While Consolidating - 10/8/2021 |
View all notes |
Set NEW NOTE alert |
Company Profile |
SEC
News |
Chart |
Request a new note
C
A
S
I |
MEDP
-
NASDAQ
Medpace Holdings Inc
Medical-Research Eqp/Svc
|
$213.02
|
+24.64
13.08% |
$217.31
|
893,731
541.00% of 50 DAV
50 DAV is 165,200
|
$199.04
7.02%
|
9/10/2021
|
$196.32
|
PP = $196.22
|
|
MB = $206.03
|
Most Recent Note - 10/26/2021 12:38:14 PM
Y - Hit a new 52-week high today with a "breakaway gap" and volume-driven gain triggering a technical buy signal. Bullish action came after it reported Sep '21 earnings +18% on +28% sales revenues versus the year ago period, below the +25% minimum earnings guideline (C criteria), raising fundamental concerns. Found support near its 50 DMA line ($187). Pivot point cited was based on its 4/26/21 high plus 10 cents.
>>> FEATURED STOCK ARTICLE : Found Prompt Support Near 50-Day Moving Average Line - 10/14/2021 |
View all notes |
Set NEW NOTE alert |
Company Profile |
SEC
News |
Chart |
Request a new note
C
A
S
I |
Symbol/Exchange
Company Name
Industry Group |
PRICE |
CHANGE
(%Change) |
Day High |
Volume
(% DAV)
(% 50 day avg vol) |
52 Wk Hi
% From Hi |
Featured
Date |
Price
Featured |
Pivot Featured |
|
Max Buy |
JEF
-
NYSE
Jefferies Financial Grp
Finance-Invest Bnk/Bkrs
|
$43.10
|
-0.22
-0.51% |
$43.60
|
1,166,612
63.23% of 50 DAV
50 DAV is 1,845,000
|
$43.50
-0.92%
|
6/28/2021
|
$31.81
|
PP = $34.42
|
|
MB = $36.14
|
Most Recent Note - 10/25/2021 5:10:33 PM
G - Very extended from any sound base, it posted a 17th consecutive gain today for another new all-time high. Its 50 DMA line ($37.86) defines important near-term support to watch on pullbacks. Reported Aug '21 quarterly earnings +713% on +70% sales revenues versus the year ago period.
>>> FEATURED STOCK ARTICLE : Perched at 52-week High With Earnings News Due - 9/29/2021 |
View all notes |
Set NEW NOTE alert |
Company Profile |
SEC
News |
Chart |
Request a new note
C
A
S
I |
AVTR
-
NYSE
Avantor Inc
Medical-Research Eqp/Svc
|
$37.70
|
-0.20
-0.53% |
$38.15
|
2,749,301
69.54% of 50 DAV
50 DAV is 3,953,600
|
$44.37
-15.03%
|
6/10/2021
|
$32.94
|
PP = $34.09
|
|
MB = $35.79
|
Most Recent Note - 10/21/2021 12:45:43 PM
G - Still sputtering below its 50 DMA line ($40.39) and below the prior low ($39.24 on 10/01/21) after damaging volume-driven losses triggering technical sell signals. A rebound above the 50 DMA line is needed for its outlook to improve. Completed a Secondary Offering on 9/13/21 while perched at its all-time high, very extended from any sound base.
>>> FEATURED STOCK ARTICLE : Pulled Back Finding Support Near 50-Day Moving Average - 10/11/2021 |
View all notes |
Set NEW NOTE alert |
Company Profile |
SEC
News |
Chart |
Request a new note
C
A
S
I |
MIME
-
NASDAQ
Mimecast Limited
Computer Sftwr-Security
|
$70.57
|
-0.29
-0.41% |
$71.84
|
435,823
46.96% of 50 DAV
50 DAV is 928,000
|
$71.45
-1.23%
|
10/18/2021
|
$68.17
|
PP = $71.55
|
|
MB = $75.13
|
Most Recent Note - 10/21/2021 8:52:26 PM
Y - Volume totals have been cooling while consolidating above its 50 DMA line ($65.45) and perched less that -4% from its all-time high. Fundamentals remain strong. Color code was changed to yellow with new pivot point cited based on its 9/03/21 high plus 10 cents. See the latest FSU analysis for more details and a new annotated graph.
>>> FEATURED STOCK ARTICLE : MIME Consolidating Less Than 4% Off High Building New Base - 10/21/2021 |
View all notes |
Set NEW NOTE alert |
Company Profile |
SEC
News |
Chart |
Request a new note
C
A
S
I |
ZD
-
NASDAQ
Ziff Davis Inc
Internet-Content
|
$128.10
|
+0.55
0.43% |
$128.94
|
559,910
139.28% of 50 DAV
50 DAV is 402,000
|
$128.09
0.01%
|
10/25/2021
|
$126.07
|
PP = $128.19
|
|
MB = $134.60
|
Most Recent Note - 10/25/2021 5:04:54 PM
Y - Perched within close striking distance of its 52-week high after today's 5th consecutive gain. Color code was changed to yellow with pivot point cited based on its 7/29/21 high plus 10 cents. A solid gain and close above the pivot point backed by at least +40% above average volume may trigger a technical buy signal. Quarterly and annual earnings (C and A criteria) history has been strong. See the latest FSU analysis for more details and a new annotated graph.
>>> FEATURED STOCK ARTICLE : Internet Content Firm Perched Near Prior High - 10/25/2021 |
View all notes |
Set NEW NOTE alert |
Company Profile |
SEC
News |
Chart |
Request a new note
C
A
S
I |
|
|
|
THESE ARE NOT BUY RECOMMENDATIONS!
Comments contained in the body of this report are technical
opinions only. The material herein has been obtained
from sources believed to be reliable and accurate, however,
its accuracy and completeness cannot be guaranteed.
This site is not an investment advisor, hence it does
not endorse or recommend any securities or other investments.
Any recommendation contained in this report may not
be suitable for all investors and it is not to be deemed
an offer or solicitation on our part with respect to
the purchase or sale of any securities. All trademarks,
service marks and trade names appearing in this report
are the property of their respective owners, and are
likewise used for identification purposes only.
This report is a service available
only to active Paid Premium Members.
You may opt-out of receiving report notifications
at any time. Questions or comments may be submitted
by writing to Premium Membership Services 665 S.E. 10 Street, Suite 201 Deerfield Beach, FL 33441-5634 or by calling 1-800-965-8307
or 954-785-1121.
|
|
|