***Last / Change / Volume data in this table is the closing quote data***
Symbol/Exchange
Company Name
Industry Group |
PRICE |
CHANGE
(%Change) |
Day High |
Volume
(% DAV)
(% 50 day avg vol) |
52 Wk Hi
% From Hi |
Featured
Date |
Price
Featured |
Pivot Featured |
|
Max Buy |
 SIVB
-
NASDAQ
SIVB
-
NASDAQ
S V B Financial Group
BANKING - Regional - Pacific Banks
|
$708.15
|
-37.17
-4.99% |
$738.54
|
396,688
113.02% of 50 DAV
50 DAV is 351,000
|
$759.02
-6.70%
|
8/6/2021
|
$589.70
|
PP = $608.94
|
|
MB = $639.39
|
 Most Recent Note - 10/27/2021 6:17:42 PM
G - Very extended from the previously noted base, it pulled back today with +12% above average volume. Reported Sep '21 quarterly earnings -14% on +43% sales revenues versus the year ago period, below the +25% minimum earnings guideline (C criteria) raising fundamental concerns. Its 50 DMA line ($629) and prior highs in the $608 area define important near-term support to watch on pullbacks. Completed a new Public Offering on 8/11/21.
>>> FEATURED STOCK ARTICLE : Pullback After 5 Straight Gains into New High Territory - 9/28/2021 |
View all notes |
Set NEW NOTE alert |
Company Profile |
SEC
News |
Chart |
Request a new note
C
A
S
I |
BLDR
-
NYSE
Builders Firstsource Inc
Bldg-Constr Prds/Misc
|
$57.04
|
-1.72
-2.93% |
$59.59
|
1,861,108
99.58% of 50 DAV
50 DAV is 1,869,000
|
$60.51
-5.73%
|
8/12/2021
|
$52.38
|
PP = $54.09
|
|
MB = $56.79
|
Most Recent Note - 10/26/2021 5:25:53 PM
G - Pulled back after touching another new all-time high today, marking only its 2nd loss in the span of 16 sessions. Its 50 DMA line and prior highs in the $54 area define important near-term support to watch on pullbacks. Fundamentals remain strong.
>>> FEATURED STOCK ARTICLE : Sputtering After Wedging to New Highs - 10/1/2021 |
View all notes |
Set NEW NOTE alert |
Company Profile |
SEC
News |
Chart |
Request a new note
C
A
S
I |
KFRC
-
NASDAQ
Kforce Inc
Comml Svcs-Staffing
|
$63.30
|
-0.74
-1.16% |
$64.38
|
65,205
63.31% of 50 DAV
50 DAV is 103,000
|
$69.00
-8.26%
|
9/10/2021
|
$59.53
|
PP = $64.48
|
|
MB = $67.70
|
Most Recent Note - 10/27/2021 6:26:10 PM
Y - Suffered a 4th consecutive small loss on light volume, testing support near prior highs in the $64 area. Fundamentals remain strong. Its 50 DMA line ($61.48) defines additional near-term support to watch.
>>> FEATURED STOCK ARTICLE : Pulling Back Near Prior Highs Following Technical Breakout - 10/15/2021 |
View all notes |
Set NEW NOTE alert |
Company Profile |
SEC
News |
Chart |
Request a new note
C
A
S
I |
GNRC
-
NYSE
Generac Hldgs Inc
Electrical-Power/Equipmt
|
$488.88
|
+16.17
3.42% |
$497.87
|
789,467
131.36% of 50 DAV
50 DAV is 601,000
|
$479.15
2.03%
|
8/30/2021
|
$449.36
|
PP = $457.10
|
|
MB = $479.96
|
Most Recent Note - 10/27/2021 6:12:45 PM
G - Color code is changed to green after it posted a gain above its "max buy" level today with +30% above average volume. Disciplined investors may noted that a gain and close above the pivot point must be backed by at least +40% above average volume to trigger a proper technical buy signal.
>>> FEATURED STOCK ARTICLE : Prior Lows Define Near-Term Support After 50 DMA Violation - 10/6/2021 |
View all notes |
Set NEW NOTE alert |
Company Profile |
SEC
News |
Chart |
Request a new note
C
A
S
I |
CAMT
-
NASDAQ
Camtek Ltd
ELECTRONICS - Scientific and Technical Instrum
|
$38.71
|
-2.52
-6.11% |
$42.18
|
326,992
213.72% of 50 DAV
50 DAV is 153,000
|
$46.01
-15.87%
|
8/4/2021
|
$39.67
|
PP = $40.57
|
|
MB = $42.60
|
Most Recent Note - 10/27/2021 12:23:19 PM
G - Violating its 50 DMA line ($40.43) with a big volume-driven loss today raising concerns. Weak action came after it reported Sep '21 quarterly earnings +150% versus the year ago period. Volume and volatility often increase near earnings news. The prior low ($34.68 on 8/17/21) defines the next important near-term support to watch. A rebound above the 50 DMA line is needed for its outlook to improve. Fundamentals remain strong.
>>> FEATURED STOCK ARTICLE : Fell Below Prior High and Violated 50-Day Moving Average - 10/5/2021 |
View all notes |
Set NEW NOTE alert |
Company Profile |
SEC
News |
Chart |
Request a new note
C
A
S
I |
Symbol/Exchange
Company Name
Industry Group |
PRICE |
CHANGE
(%Change) |
Day High |
Volume
(% DAV)
(% 50 day avg vol) |
52 Wk Hi
% From Hi |
Featured
Date |
Price
Featured |
Pivot Featured |
|
Max Buy |
PKI
-
NYSE
Perkinelmer Inc
ELECTRONICS - Scientific and Technical Instrum
|
$173.79
|
-3.19
-1.80% |
$177.06
|
439,117
71.66% of 50 DAV
50 DAV is 612,800
|
$192.00
-9.48%
|
8/18/2021
|
$181.07
|
PP = $188.50
|
|
MB = $197.93
|
Most Recent Note - 10/27/2021 6:15:00 PM
G - Pulled back today after rebounding near its 50 DMA line which may act as resistance. Subsequent gains above the 50 DMA line ($179.38) are needed for its outlook to improve. Its Relative Strength Rating has slumped to 75, below the 80+ minimum guideline for buy candidates. Fundamentals remain strong.
>>> FEATURED STOCK ARTICLE : Rebound Above 50 DMA Line Needed to Help Outlook Improve - 10/19/2021 |
View all notes |
Set NEW NOTE alert |
Company Profile |
SEC
News |
Chart |
Request a new note
C
A
S
I |
AMD
-
NASDAQ
Advanced Micro Devices
ELECTRONICS - Semiconductor - Broad Line
|
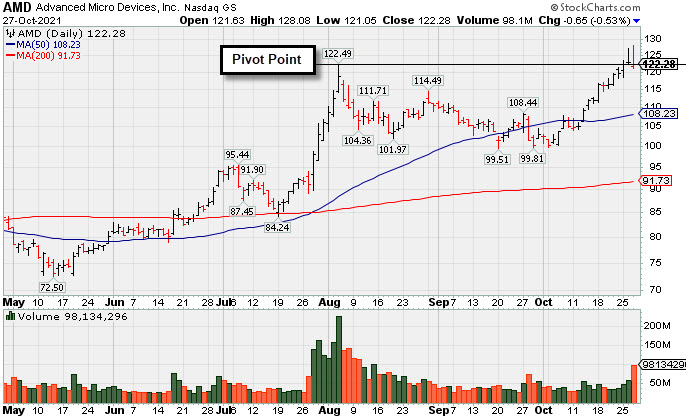
$122.28
|
-0.65
-0.53% |
$128.08
|
98,163,204
217.18% of 50 DAV
50 DAV is 45,199,000
|
$127.20
-3.87%
|
10/27/2021
|
$124.91
|
PP = $122.59
|
|
MB = $128.72
|
Most Recent Note - 10/27/2021 6:07:20 PM
Y - There was a "negative reversal" today for a loss on heavy volume after hitting a new high following 5 consecutive gains. It was highlighted yellow with pivot point cited based on its 8/04/21 high plus 10 cents in the earlier mid-day report. AMD found support near prior highs in the $99 area during its consolidation. Its current Relative Strength rating of 90 is above the 80+ minimum guideline for buy candidates. Fundamentals remain strong after it reported Sep '21 quarterly earnings +78% on +54% sales revenues versus the year ago period. See the latest FSU analysis for more details and a new annotated graph.
>>> FEATURED STOCK ARTICLE : Encountered Distributional Pressure After Reaching New High - 10/27/2021 |
View all notes |
Set NEW NOTE alert |
Company Profile |
SEC
News |
Chart |
Request a new note
C
A
S
I |
UMC
-
NYSE
United Microelectrnc Adr
ELECTRONICS - Semiconductor - Integrated Cir
|
$10.86
|
+0.17
1.59% |
$11.39
|
14,872,742
198.86% of 50 DAV
50 DAV is 7,479,000
|
$12.62
-13.95%
|
8/5/2021
|
$11.62
|
PP = $11.38
|
|
MB = $11.95
|
Most Recent Note - 10/27/2021 1:10:46 PM
G - Posting a 3rd consecutive volume-driven gain today. Reported Sep '21 quarterly earnings +100% on +30% sales revenues versus the year ago period. Found support above its 200 DMA line ($9.91). A rebound above the 50 DMA line ($11.17) still is needed for its outlook to improve. Volume and volatility often increase near earnings news. See the latest FSU analysis for more details and an annotated graph.
>>> FEATURED STOCK ARTICLE : Earnings News Due From Taiwan-Based Semiconductor Firm - 10/26/2021 |
View all notes |
Set NEW NOTE alert |
Company Profile |
SEC
News |
Chart |
Request a new note
C
A
S
I |
BRKS
-
NASDAQ
Brooks Automation
ELECTRONICS - Semiconductor Equipment and Mate
|
$110.13
|
+0.78
0.71% |
$111.35
|
498,930
83.43% of 50 DAV
50 DAV is 598,000
|
$111.39
-1.13%
|
9/20/2021
|
$101.21
|
PP = $108.82
|
|
MB = $114.26
|
Most Recent Note - 10/27/2021 6:10:28 PM
Y - Posted a small gain today with lighter than average volume, leaving it perched at its 52-week high. Pivot point cited was based on its 4/27/21 high plus 10 cents. It has been repeatedly noted - "Subsequent gains above the pivot point or prior highs backed by at least 40% above average volume may trigger a convincing technical buy signal."
>>> FEATURED STOCK ARTICLE : 5th Quiet Gain Has Brooks Perched Near Prior Highs - 10/20/2021 |
View all notes |
Set NEW NOTE alert |
Company Profile |
SEC
News |
Chart |
Request a new note
C
A
S
I |
ENTG
-
NASDAQ
Entegris Inc
ELECTRONICS - Semiconductor Equipment and Mate
|
$135.03
|
+2.18
1.64% |
$136.15
|
1,116,481
150.67% of 50 DAV
50 DAV is 741,000
|
$138.70
-2.65%
|
8/4/2021
|
$125.33
|
PP = $126.51
|
|
MB = $132.84
|
Most Recent Note - 10/27/2021 12:32:35 PM
G - Perched near its all-time high and consolidating above its "max buy" level. Its 50 DMA line ($124.73) defines near-term support to watch above the prior low ($118).
>>> FEATURED STOCK ARTICLE : Hit New Record High With Another Volume-Driven Gain - 10/22/2021 |
View all notes |
Set NEW NOTE alert |
Company Profile |
SEC
News |
Chart |
Request a new note
C
A
S
I |
Symbol/Exchange
Company Name
Industry Group |
PRICE |
CHANGE
(%Change) |
Day High |
Volume
(% DAV)
(% 50 day avg vol) |
52 Wk Hi
% From Hi |
Featured
Date |
Price
Featured |
Pivot Featured |
|
Max Buy |
CLFD
-
NASDAQ
Clearfield Inc
TELECOMMUNICATIONS - Cables / Satalite Equipment
|
$54.49
|
+1.21
2.27% |
$56.23
|
189,486
225.58% of 50 DAV
50 DAV is 84,000
|
$54.49
0.00%
|
7/23/2021
|
$40.23
|
PP = $43.74
|
|
MB = $45.93
|
Most Recent Note - 10/27/2021 12:24:55 PM
G -Hitting a new all-time high with today's 2nd consecutive volume-driven gain, getting more extended from the previously noted base. Prior highs in the $46 area define near-term support along with its 50 DMA line ($47) where damaging losses may trigger technical sell signals. Due to report Sep '21 quarterly results on 11/04/21.
>>> FEATURED STOCK ARTICLE : Extended From Prior Base After Latest Rally - 10/18/2021 |
View all notes |
Set NEW NOTE alert |
Company Profile |
SEC
News |
Chart |
Request a new note
C
A
S
I |
TGH
-
NYSE
Textainer Group Holdings
TRANSPORTATION - Logistics
|
$38.37
|
-0.48
-1.24% |
$39.18
|
374,433
84.91% of 50 DAV
50 DAV is 441,000
|
$39.99
-4.05%
|
10/7/2021
|
$36.97
|
PP = $36.80
|
|
MB = $38.64
|
Most Recent Note - 10/25/2021 1:05:55 PM
Y - Hitting another new 52-week high and trading near its "max buy" level with today's big gain backed by above average volume. Its 50 DMA line ($34.46) defines important near-term support to watch. Fundamentals remain strong.
>>> FEATURED STOCK ARTICLE : Perched Near High With Strong Fundamentals - 10/7/2021 |
View all notes |
Set NEW NOTE alert |
Company Profile |
SEC
News |
Chart |
Request a new note
C
A
S
I |
SMPL
-
NASDAQ
Simply Good Foods Co
Food-Confectionery
|
$38.86
|
-0.84
-2.12% |
$40.26
|
377,966
104.99% of 50 DAV
50 DAV is 360,000
|
$39.91
-2.63%
|
10/25/2021
|
$38.30
|
PP = $38.60
|
|
MB = $40.53
|
Most Recent Note - 10/26/2021 5:34:19 PM
Y - Hit another new 52-week high with today's 4th consecutive volume-driven gain. Color code was changed to yellow with new pivot point cited based on its 7/01/21 high plus 10 cents. A gain and strong close above its pivot point on the prior session triggered a new (or add-on) technical buy signal. Bullish action came after it reported Aug '21 quarterly earnings +45% on +17% sales revenues versus the year ago period. Volume and volatility often increase near earnings news. Its Relative Strength Rating has improved to 87. Found support above its 200 DMA line ($33.67) and recent low ($33.55 on 9/20/21).
>>> FEATURED STOCK ARTICLE : Consolidating Just Above 50-Day Moving Average Line - 10/12/2021 |
View all notes |
Set NEW NOTE alert |
Company Profile |
SEC
News |
Chart |
Request a new note
C
A
S
I |
WDAY
-
NYSE
Workday Inc Cl A
Computer Sftwr-Enterprse
|
$283.13
|
+0.37
0.13% |
$286.55
|
1,092,071
70.19% of 50 DAV
50 DAV is 1,555,900
|
$285.85
-0.95%
|
9/7/2021
|
$275.69
|
PP = $282.87
|
|
MB = $297.01
|
Most Recent Note - 10/25/2021 5:14:24 PM
Y - Posted a gain today with average volume for a best-ever close and no resistance remains due to overhead supply. Its 50 DMA line ($261.82).defines near-term support to watch where a violation would raise concerns. Fundamentals remain strong.
>>> FEATURED STOCK ARTICLE : Rebounding From 50-Day Moving Average Toward Prior Highs - 10/13/2021 |
View all notes |
Set NEW NOTE alert |
Company Profile |
SEC
News |
Chart |
Request a new note
C
A
S
I |
CTLT
-
NYSE
Catalent Inc
DRUGS - Biotechnology
|
$133.02
|
-0.49
-0.37% |
$135.29
|
591,009
65.67% of 50 DAV
50 DAV is 900,000
|
$142.64
-6.74%
|
8/25/2021
|
$128.72
|
PP = $127.78
|
|
MB = $134.17
|
Most Recent Note - 10/26/2021 5:28:47 PM
Y - Posted a gain with higher volume today and closed back above its 50 DMA line ($132.56). Prior highs in the $124-127 area which define the next important near-term support to watch. Fundamentals remain strong. Due to report Sep '21 quarterly results on 11/02/21.
>>> FEATURED STOCK ARTICLE : Found Support Near Prior High While Consolidating - 10/8/2021 |
View all notes |
Set NEW NOTE alert |
Company Profile |
SEC
News |
Chart |
Request a new note
C
A
S
I |
Symbol/Exchange
Company Name
Industry Group |
PRICE |
CHANGE
(%Change) |
Day High |
Volume
(% DAV)
(% 50 day avg vol) |
52 Wk Hi
% From Hi |
Featured
Date |
Price
Featured |
Pivot Featured |
|
Max Buy |
MEDP
-
NASDAQ
Medpace Holdings Inc
Medical-Research Eqp/Svc
|
$210.60
|
-2.42
-1.14% |
$215.85
|
268,953
150.25% of 50 DAV
50 DAV is 179,000
|
$217.31
-3.09%
|
9/10/2021
|
$196.32
|
PP = $196.22
|
|
MB = $206.03
|
Most Recent Note - 10/26/2021 12:38:14 PM
Y - Hit a new 52-week high today with a "breakaway gap" and volume-driven gain triggering a technical buy signal. Bullish action came after it reported Sep '21 earnings +18% on +28% sales revenues versus the year ago period, below the +25% minimum earnings guideline (C criteria), raising fundamental concerns. Found support near its 50 DMA line ($187). Pivot point cited was based on its 4/26/21 high plus 10 cents.
>>> FEATURED STOCK ARTICLE : Found Prompt Support Near 50-Day Moving Average Line - 10/14/2021 |
View all notes |
Set NEW NOTE alert |
Company Profile |
SEC
News |
Chart |
Request a new note
C
A
S
I |
JEF
-
NYSE
Jefferies Financial Grp
Finance-Invest Bnk/Bkrs
|
$42.19
|
-0.91
-2.11% |
$43.21
|
1,324,632
71.33% of 50 DAV
50 DAV is 1,857,000
|
$43.60
-3.23%
|
6/28/2021
|
$31.81
|
PP = $34.42
|
|
MB = $36.14
|
Most Recent Note - 10/25/2021 5:10:33 PM
G - Very extended from any sound base, it posted a 17th consecutive gain today for another new all-time high. Its 50 DMA line ($37.86) defines important near-term support to watch on pullbacks. Reported Aug '21 quarterly earnings +713% on +70% sales revenues versus the year ago period.
>>> FEATURED STOCK ARTICLE : Perched at 52-week High With Earnings News Due - 9/29/2021 |
View all notes |
Set NEW NOTE alert |
Company Profile |
SEC
News |
Chart |
Request a new note
C
A
S
I |
AVTR
-
NYSE
Avantor Inc
Medical-Research Eqp/Svc
|
$36.93
|
-0.77
-2.04% |
$37.73
|
5,354,555
135.81% of 50 DAV
50 DAV is 3,942,600
|
$44.37
-16.77%
|
6/10/2021
|
$32.94
|
PP = $34.09
|
|
MB = $35.79
|
Most Recent Note - 10/27/2021 6:24:39 PM
G - Due to report Sep '21 quarterly results on the morning of Friday, 10/29/21. Volume and volatility often increase near earnings news. Suffered a 4th consecutive loss today. A rebound above the 50 DMA line ($40.30) is needed for its outlook to improve. Completed a Secondary Offering on 9/13/21 while perched at its all-time high, very extended from any sound base.
>>> FEATURED STOCK ARTICLE : Pulled Back Finding Support Near 50-Day Moving Average - 10/11/2021 |
View all notes |
Set NEW NOTE alert |
Company Profile |
SEC
News |
Chart |
Request a new note
C
A
S
I |
MIME
-
NASDAQ
Mimecast Limited
Computer Sftwr-Security
|
$68.94
|
-1.63
-2.31% |
$70.83
|
385,398
41.57% of 50 DAV
50 DAV is 927,000
|
$71.84
-4.04%
|
10/18/2021
|
$68.17
|
PP = $71.55
|
|
MB = $75.13
|
Most Recent Note - 10/27/2021 6:21:07 PM
Y - Pulled back today while quietly perched at its all-time high. Fundamentals remain strong. Color code was changed to yellow with new pivot point cited based on its 9/03/21 high plus 10 cents. Subsequent volume-driven gains for more highs may trigger a technical buy signal. Its 50 DMA line ($66.30) defines near-term support to watch.
>>> FEATURED STOCK ARTICLE : MIME Consolidating Less Than 4% Off High Building New Base - 10/21/2021 |
View all notes |
Set NEW NOTE alert |
Company Profile |
SEC
News |
Chart |
Request a new note
C
A
S
I |
ZD
-
NASDAQ
Ziff Davis Inc
Internet-Content
|
$127.69
|
-0.41
-0.32% |
$130.90
|
310,127
76.39% of 50 DAV
50 DAV is 406,000
|
$128.94
-0.97%
|
10/25/2021
|
$126.07
|
PP = $128.19
|
|
MB = $134.60
|
Most Recent Note - 10/25/2021 5:04:54 PM
Y - Perched within close striking distance of its 52-week high after today's 5th consecutive gain. Color code was changed to yellow with pivot point cited based on its 7/29/21 high plus 10 cents. A solid gain and close above the pivot point backed by at least +40% above average volume may trigger a technical buy signal. Quarterly and annual earnings (C and A criteria) history has been strong. See the latest FSU analysis for more details and a new annotated graph.
>>> FEATURED STOCK ARTICLE : Internet Content Firm Perched Near Prior High - 10/25/2021 |
View all notes |
Set NEW NOTE alert |
Company Profile |
SEC
News |
Chart |
Request a new note
C
A
S
I |
Symbol/Exchange
Company Name
Industry Group |
PRICE |
CHANGE
(%Change) |
Day High |
Volume
(% DAV)
(% 50 day avg vol) |
52 Wk Hi
% From Hi |
Featured
Date |
Price
Featured |
Pivot Featured |
|
Max Buy |