***Last / Change / Volume data in this table is the closing quote data***
Symbol/Exchange
Company Name
Industry Group |
PRICE |
CHANGE
(%Change) |
Day High |
Volume
(% DAV)
(% 50 day avg vol) |
52 Wk Hi
% From Hi |
Featured
Date |
Price
Featured |
Pivot Featured |
|
Max Buy |
 SIVB
-
NASDAQ
SIVB
-
NASDAQ
S V B Financial Group
BANKING - Regional - Pacific Banks
|
$750.47
|
+8.42
1.13% |
$750.94
|
270,191
76.98% of 50 DAV
50 DAV is 351,000
|
$762.95
-1.64%
|
8/6/2021
|
$589.70
|
PP = $608.94
|
|
MB = $639.39
|
Most Recent Note - 11/5/2021 1:14:43 PM
G - Hovering near its all-time high, extended from the previously noted base. Recently reported Sep '21 quarterly earnings -14% on +43% sales revenues versus the year ago period, below the +25% minimum earnings guideline (C criteria), raising fundamental concerns. Its 50 DMA line ($654) defines important near-term support to watch on pullbacks. Completed a new Public Offering on 8/11/21.
>>> FEATURED STOCK ARTICLE : Latest Quarter Raised Fundamental Concerns - 10/29/2021 |
View all notes |
Set NEW NOTE alert |
Company Profile |
SEC
News |
Chart |
Request a new note
C
A
S
I |
BLDR
-
NYSE
Builders Firstsource Inc
Bldg-Constr Prds/Misc
|
$67.68
|
+0.84
1.26% |
$68.45
|
2,177,340
114.90% of 50 DAV
50 DAV is 1,895,000
|
$68.92
-1.80%
|
8/12/2021
|
$52.38
|
PP = $54.09
|
|
MB = $56.79
|
Most Recent Note - 11/4/2021 12:40:14 PM
G - Gapped up today hitting a new all-time high, getting very extended from any sound base. Bullish action came after it reported Sep '21 quarterly earnings +308% on +140% sales revenues versus the year ago period. Its 50 DMA line and prior highs in the $55 area define important near-term support to watch on pullbacks.
>>> FEATURED STOCK ARTICLE : Earnings News Due Thursday for High-Ranked Building Products Firm - 11/2/2021 |
View all notes |
Set NEW NOTE alert |
Company Profile |
SEC
News |
Chart |
Request a new note
C
A
S
I |
KFRC
-
NASDAQ
Kforce Inc
Comml Svcs-Staffing
|
$76.12
|
+0.31
0.41% |
$76.48
|
82,273
77.62% of 50 DAV
50 DAV is 106,000
|
$76.35
-0.30%
|
9/10/2021
|
$59.53
|
PP = $64.48
|
|
MB = $67.70
|
Most Recent Note - 11/5/2021 1:11:18 PM
G - Extended from any sound base and hitting a new all-time high with today's 7th consecutive gain. Fundamentals remain strong. Its 50 DMA line ($63) and recent low define important near-term support to watch on pullbacks.
>>> FEATURED STOCK ARTICLE : Pulling Back Near Prior Highs Following Technical Breakout - 10/15/2021 |
View all notes |
Set NEW NOTE alert |
Company Profile |
SEC
News |
Chart |
Request a new note
C
A
S
I |
GNRC
-
NYSE
Generac Hldgs Inc
Electrical-Power/Equipmt
|
$439.80
|
-8.75
-1.95% |
$450.00
|
695,018
104.51% of 50 DAV
50 DAV is 665,000
|
$524.31
-16.12%
|
8/30/2021
|
$449.36
|
PP = $457.10
|
|
MB = $479.96
|
Most Recent Note - 11/8/2021 6:09:29 PM
G - Halted its slide at its 50 DMA line ($444) with a gain today on light volume. Churned above average volume after a "negative reversal" last week at its all-time high. Weak action came after it reported Sep '21 quarterly earnings +13% on +34% sales revenues versus the year ago period, below the +25% minimum earnings guideline (C criteria), raising fundamental concerns. See the latest FSU analysis for more details and a new annotated graph.
>>> FEATURED STOCK ARTICLE : Halted Slide at 50-Day Moving Average After Earnings News - 11/8/2021 |
View all notes |
Set NEW NOTE alert |
Company Profile |
SEC
News |
Chart |
Request a new note
C
A
S
I |
CAMT
-
NASDAQ
Camtek Ltd
ELECTRONICS - Scientific and Technical Instrum
|
$45.13
|
+0.88
1.99% |
$45.98
|
183,831
117.09% of 50 DAV
50 DAV is 157,000
|
$46.01
-1.91%
|
11/9/2021
|
$45.43
|
PP = $46.11
|
|
MB = $48.42
|
 Most Recent Note - 11/9/2021 12:28:34 PM
Y - Color code is changed to yellow and a new pivot point is cited based on its 9/23/21 high plus 10 cents. Challenging its 52-week high with today's 5th consecutive gain following a 6-week base during which it traded above and below its 50 DMA line ($40.89). Subsequent gains above its pivot point backed by at least +40% above average volume may trigger a new (or add-on) technical buy signal. Reported Sep '21 quarterly earnings +150% versus the year ago period. Fundamentals remain strong.
>>> FEATURED STOCK ARTICLE : Rebound Above 50-Day Moving Average Helped Outlook - 11/5/2021 |
View all notes |
Set NEW NOTE alert |
Company Profile |
SEC
News |
Chart |
Request a new note
C
A
S
I |
Symbol/Exchange
Company Name
Industry Group |
PRICE |
CHANGE
(%Change) |
Day High |
Volume
(% DAV)
(% 50 day avg vol) |
52 Wk Hi
% From Hi |
Featured
Date |
Price
Featured |
Pivot Featured |
|
Max Buy |
PKI
-
NYSE
Perkinelmer Inc
Medical-Research Eqp/Svc
|
$174.55
|
+1.36
0.79% |
$176.77
|
799,835
125.27% of 50 DAV
50 DAV is 638,500
|
$192.00
-9.09%
|
8/18/2021
|
$181.07
|
PP = $188.50
|
|
MB = $197.93
|
Most Recent Note - 11/3/2021 1:01:31 PM
G - Reported Sep '21 quarterly earnings +11% versus the year ago period, below the +25% minimum earnings guideline (C criteria), raising concerns. Meeting resistance at its 50 DMA line ($178.84) in recent weeks. Its Relative Strength Rating has slumped to 70, below the 80+ minimum guideline for buy candidates.
>>> FEATURED STOCK ARTICLE : Rebound Above 50 DMA Line Needed to Help Outlook Improve - 10/19/2021 |
View all notes |
Set NEW NOTE alert |
Company Profile |
SEC
News |
Chart |
Request a new note
C
A
S
I |
AMD
-
NASDAQ
Advanced Micro Devices
ELECTRONICS - Semiconductor - Broad Line
|
$148.92
|
-1.24
-0.83% |
$155.65
|
97,998,381
207.58% of 50 DAV
50 DAV is 47,211,000
|
$153.60
-3.05%
|
10/27/2021
|
$124.91
|
PP = $122.59
|
|
MB = $128.72
|
Most Recent Note - 11/9/2021 12:17:04 PM
G - Perched at its all-time high today following considerable volume-driven gains, very extended from the previously noted base. Disciplined investors avoid chasing extended stocks. Prior high in the $122 area defines initial support to watch on pullbacks. Fundamentals remain strong after it reported Sep '21 quarterly earnings +78% on +54% sales revenues versus the year ago period.
>>> FEATURED STOCK ARTICLE : Encountered Distributional Pressure After Reaching New High - 10/27/2021 |
View all notes |
Set NEW NOTE alert |
Company Profile |
SEC
News |
Chart |
Request a new note
C
A
S
I |
UMC
-
NYSE
United Microelectrnc Adr
ELECTRONICS - Semiconductor - Integrated Cir
|
$11.23
|
+0.05
0.45% |
$11.44
|
8,638,164
112.48% of 50 DAV
50 DAV is 7,680,000
|
$12.62
-11.01%
|
8/5/2021
|
$11.62
|
PP = $11.38
|
|
MB = $11.95
|
Most Recent Note - 11/9/2021 1:20:35 PM
G - On track today for a 7th consecutive gain, rising above the 50 DMA line ($11.15) helping its outlook to improve. Reported Sep '21 quarterly earnings +100% on +30% sales revenues versus the year ago period. Recently found support above its 200 DMA line ($9.95).
>>> FEATURED STOCK ARTICLE : Earnings News Due From Taiwan-Based Semiconductor Firm - 10/26/2021 |
View all notes |
Set NEW NOTE alert |
Company Profile |
SEC
News |
Chart |
Request a new note
C
A
S
I |
BRKS
-
NASDAQ
Brooks Automation
ELECTRONICS - Semiconductor Equipment and Mate
|
$123.13
|
-1.02
-0.82% |
$124.79
|
368,151
65.04% of 50 DAV
50 DAV is 566,000
|
$124.44
-1.05%
|
9/20/2021
|
$101.21
|
PP = $108.82
|
|
MB = $114.26
|
Most Recent Note - 11/8/2021 6:15:01 PM
G - Today's 9th consecutive gain with below average volume helped it hit another new all-time high. Prior high in the $110 area defines initial support to watch above its 50 DMA line.
>>> FEATURED STOCK ARTICLE : 5th Quiet Gain Has Brooks Perched Near Prior Highs - 10/20/2021 |
View all notes |
Set NEW NOTE alert |
Company Profile |
SEC
News |
Chart |
Request a new note
C
A
S
I |
ENTG
-
NASDAQ
Entegris Inc
ELECTRONICS - Semiconductor Equipment and Mate
|
$148.47
|
+0.52
0.35% |
$149.40
|
705,019
87.36% of 50 DAV
50 DAV is 807,000
|
$149.47
-0.67%
|
8/4/2021
|
$125.33
|
PP = $126.51
|
|
MB = $132.84
|
Most Recent Note - 11/3/2021 5:21:59 PM
G - Wedged to a new all-time high with today's 6th consecutive gain. Its 50 DMA line ($127.63) defines near-term support to watch on pullbacks. Fundamentals remain strong after it recently reported Sep '21 quarterly earnings +37% on +20% sales revenues versus the year ago period.
>>> FEATURED STOCK ARTICLE : Hit New Record High With Another Volume-Driven Gain - 10/22/2021 |
View all notes |
Set NEW NOTE alert |
Company Profile |
SEC
News |
Chart |
Request a new note
C
A
S
I |
Symbol/Exchange
Company Name
Industry Group |
PRICE |
CHANGE
(%Change) |
Day High |
Volume
(% DAV)
(% 50 day avg vol) |
52 Wk Hi
% From Hi |
Featured
Date |
Price
Featured |
Pivot Featured |
|
Max Buy |
SKY
-
NYSE
Skyline Champion Corp
Bldg-Mobile/Mfg andamp; RV
|
$76.44
|
+1.44
1.92% |
$77.40
|
395,643
101.97% of 50 DAV
50 DAV is 388,000
|
$75.81
0.83%
|
11/3/2021
|
$72.19
|
PP = $66.92
|
|
MB = $70.27
|
Most Recent Note - 11/4/2021 5:35:27 PM
G - Color code is changed to green after today's 2nd volume-driven gain lifted it above its "max buy" level. Highlighted in yellow on the prior session with pivot point cited based on its 8/27/21 high plus 10 cents. Its "breakaway gap" triggered a technical buy signal. Found support near its 50 DMA line ($63) in recent weeks while building an orderly flat base. Reported very strong Mar, Jun and Sep '21 quarterly results versus the year ago periods well above the +25% minimum earnings guideline (C criteria). Annual earnings (A criteria) history has been strong. Prior highs in the $66 area define initial support to watch on pullbacks.
>>> FEATURED STOCK ARTICLE : Breakaway Gap After 10-Week Flat Base - 11/3/2021 |
View all notes |
Set NEW NOTE alert |
Company Profile |
SEC
News |
Chart |
Request a new note
C
A
S
I |
WSM
-
NYSE
Williams Sonoma Inc
RETAIL - Home Furnishing Stores
|
$204.59
|
+1.22
0.60% |
$208.40
|
551,793
64.24% of 50 DAV
50 DAV is 859,000
|
$211.14
-3.10%
|
11/3/2021
|
$205.00
|
PP = $195.09
|
|
MB = $204.84
|
Most Recent Note - 11/4/2021 5:15:19 PM
G - Posted a 6th consecutive gain today for a best-ever close above its "max buy" level and its color code is changed to green. Highlighted in yellow in the 11/03/21 mid-day report with pivot point cited based on its 9/27/21 high. It cleared a "double bottom" base as it gapped up and rallied to hit a new 52-week high with +61% above average volume triggering a technical buy signal. See the latest FSU analysis for more details and a new annotated graph.
>>> FEATURED STOCK ARTICLE : Volume-Driven Gains May Signal a New Meaningful Leg Up - 11/4/2021 |
View all notes |
Set NEW NOTE alert |
Company Profile |
SEC
News |
Chart |
Request a new note
C
A
S
I |
CLFD
-
NASDAQ
Clearfield Inc
TELECOMMUNICATIONS - Cables / Satalite Equipment
|
$64.47
|
-0.09
-0.14% |
$66.81
|
139,240
142.08% of 50 DAV
50 DAV is 98,000
|
$67.79
-4.90%
|
7/23/2021
|
$40.23
|
PP = $43.74
|
|
MB = $45.93
|
Most Recent Note - 11/8/2021 12:09:07 PM
G - Hitting yet another new all-time high with today's 6th consecutive volume-driven gain, getting very extended from the previously noted base. Its 50 DMA line ($49.72) and prior highs in the $46 area define near-term support to watch on pullbacks. Reported Sep '21 quarterly earnings +141% above the year ago period.
>>> FEATURED STOCK ARTICLE : Extended From Prior Base After Latest Rally - 10/18/2021 |
View all notes |
Set NEW NOTE alert |
Company Profile |
SEC
News |
Chart |
Request a new note
C
A
S
I |
TGH
-
NYSE
Textainer Group Holdings
TRANSPORTATION - Logistics
|
$39.52
|
-0.15
-0.38% |
$40.19
|
512,575
110.71% of 50 DAV
50 DAV is 463,000
|
$41.24
-4.17%
|
10/7/2021
|
$36.97
|
PP = $36.80
|
|
MB = $38.64
|
Most Recent Note - 11/8/2021 6:16:02 PM
G - Hovering near its 52-week high and above its "max buy" level. Its 50 DMA line ($35.73) defines important near-term support to watch. Fundamentals remain strong.
>>> FEATURED STOCK ARTICLE : Perched Near High With Strong Fundamentals - 10/7/2021 |
View all notes |
Set NEW NOTE alert |
Company Profile |
SEC
News |
Chart |
Request a new note
C
A
S
I |
ENPH
-
NASDAQ
Enphase Energy Inc
Energy-Solar
|
$239.39
|
-2.23
-0.92% |
$244.38
|
1,188,839
51.13% of 50 DAV
50 DAV is 2,325,000
|
$246.54
-2.90%
|
10/28/2021
|
$218.00
|
PP = $229.14
|
|
MB = $240.60
|
Most Recent Note - 11/4/2021 5:21:26 PM
G - Hit another new 52-week high and rose above its "max buy" level with today's gain and its color code is changed to green. Prior high ($229) defines initial support to watch on pullbacks.
>>> FEATURED STOCK ARTICLE : Enphase is Challenging its All-Time High With Volume-Driven Gains - 10/28/2021 |
View all notes |
Set NEW NOTE alert |
Company Profile |
SEC
News |
Chart |
Request a new note
C
A
S
I |
Symbol/Exchange
Company Name
Industry Group |
PRICE |
CHANGE
(%Change) |
Day High |
Volume
(% DAV)
(% 50 day avg vol) |
52 Wk Hi
% From Hi |
Featured
Date |
Price
Featured |
Pivot Featured |
|
Max Buy |
SMPL
-
NASDAQ
Simply Good Foods Co
Food-Confectionery
|
$40.40
|
-0.48
-1.17% |
$41.25
|
276,032
75.83% of 50 DAV
50 DAV is 364,000
|
$41.35
-2.30%
|
10/25/2021
|
$38.30
|
PP = $38.60
|
|
MB = $40.53
|
Most Recent Note - 11/5/2021 5:51:32 PM
G - Color code is changed to green after hitting a new 52-week high today with +27% above average volume as it rose above its "max buy" level. Prior highs in the $38 area define initial support to watch above its 50 DMA line ($36).
>>> FEATURED STOCK ARTICLE : Consolidating Just Above 50-Day Moving Average Line - 10/12/2021 |
View all notes |
Set NEW NOTE alert |
Company Profile |
SEC
News |
Chart |
Request a new note
C
A
S
I |
WDAY
-
NYSE
Workday Inc Cl A
Computer Sftwr-Enterprse
|
$293.48
|
+0.75
0.26% |
$294.49
|
894,744
66.43% of 50 DAV
50 DAV is 1,346,800
|
$293.82
-0.12%
|
9/7/2021
|
$275.69
|
PP = $282.87
|
|
MB = $297.01
|
Most Recent Note - 11/8/2021 6:13:50 PM
Y - Posted another gain today lacking great volume conviction as it wedged into new high territory. No resistance remains due to overhead supply. Its 50 DMA line ($271).defines near-term support to watch where a violation would raise concerns. Fundamentals remain strong.
>>> FEATURED STOCK ARTICLE : Rebounding From 50-Day Moving Average Toward Prior Highs - 10/13/2021 |
View all notes |
Set NEW NOTE alert |
Company Profile |
SEC
News |
Chart |
Request a new note
C
A
S
I |
CTLT
-
NYSE
"Catalent, Inc"
DRUGS - Biotechnology
|
$125.04
|
+1.04
0.84% |
$125.38
|
768,923
82.53% of 50 DAV
50 DAV is 931,700
|
$142.64
-12.34%
|
8/25/2021
|
$128.72
|
PP = $127.78
|
|
MB = $134.17
|
Most Recent Note - 11/5/2021 12:34:04 PM
G - Gapped down today violating prior lows in the $126-127 area with a 4th consecutive loss after violating its 50 DMA line on the prior session, triggering technical sell signals. Its Relative Strength Rating has slumped to 69, below the 80+ minimum guideline for buy candidates. Fundamentals remain strong after it reported Sep '21 quarterly earnings +65% on +21% sales revenues versus the year ago period, continuing its strong earnings track record.
>>> FEATURED STOCK ARTICLE : Found Support Near Prior High While Consolidating - 10/8/2021 |
View all notes |
Set NEW NOTE alert |
Company Profile |
SEC
News |
Chart |
Request a new note
C
A
S
I |
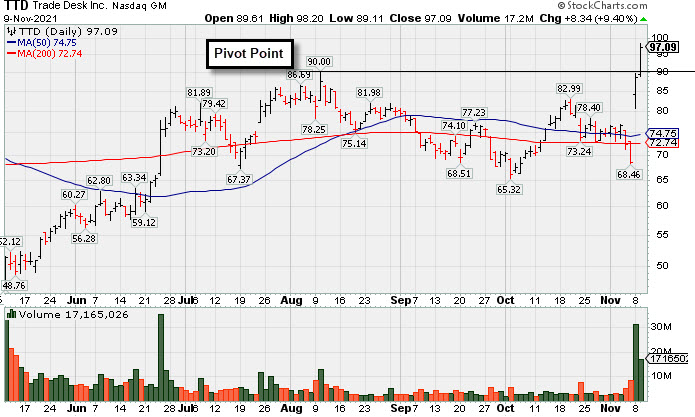
TTD
-
NASDAQ
The Trade Desk Inc Cl A
Comml Svcs-Advertising
|
$97.09
|
+8.34
9.40% |
$98.20
|
17,064,416
430.38% of 50 DAV
50 DAV is 3,965,000
|
$97.28
-0.20%
|
11/9/2021
|
$95.16
|
PP = $90.00
|
|
MB = $94.50
|
Most Recent Note - 11/9/2021 5:50:15 PM
Y - Finished strong after highlighted in yellow in the earlier mid-day report with new pivot point cited based on its 8/10/21 high after a 9-month cup-with-handle shaped base. Hit a new all-time high with today's 2nd consecutive big volume-driven gain triggering a technical buy signal. Do not be confused as a 10:1 split impacted the share price as of 6/17/21. Reported Sep '21 quarterly earnings +38% on +39% sales revenues versus the year ago period, and prior quarterly comparisons showed very strong sales revenues and earnings increases well above the +25% minimum earnings guideline (C criteria). Annual earnings history has been strong. See the latest FSU analysis for more details and a new annotated graph.
>>> FEATURED STOCK ARTICLE : Powerful Volume-Driven Gains for New Highs - 11/9/2021 |
View all notes |
Set NEW NOTE alert |
Company Profile |
SEC
News |
Chart |
Request a new note
C
A
S
I |
MEDP
-
NASDAQ
Medpace Holdings Inc
Medical-Research Eqp/Svc
|
$223.20
|
-1.36
-0.61% |
$225.23
|
86,976
45.78% of 50 DAV
50 DAV is 190,000
|
$229.49
-2.74%
|
9/10/2021
|
$196.32
|
PP = $196.22
|
|
MB = $206.03
|
Most Recent Note - 11/5/2021 1:13:00 PM
G - Volume totals have been cooling while stubbornly holding its ground near its 52-week high. Recent bullish action came even after it reported Sep '21 earnings +18% on +28% sales revenues versus the year ago period, below the +25% minimum earnings guideline (C criteria), raising fundamental concerns. Prior highs in the $199 area define initial support above its 50 DMA line ($194).
>>> FEATURED STOCK ARTICLE : Found Prompt Support Near 50-Day Moving Average Line - 10/14/2021 |
View all notes |
Set NEW NOTE alert |
Company Profile |
SEC
News |
Chart |
Request a new note
C
A
S
I |
Symbol/Exchange
Company Name
Industry Group |
PRICE |
CHANGE
(%Change) |
Day High |
Volume
(% DAV)
(% 50 day avg vol) |
52 Wk Hi
% From Hi |
Featured
Date |
Price
Featured |
Pivot Featured |
|
Max Buy |
JEF
-
NYSE
Jefferies Financial Grp
Finance-Invest Bnk/Bkrs
|
$42.62
|
-0.77
-1.77% |
$43.25
|
1,732,887
95.63% of 50 DAV
50 DAV is 1,812,000
|
$44.47
-4.16%
|
6/28/2021
|
$31.81
|
PP = $34.42
|
|
MB = $36.14
|
Most Recent Note - 11/8/2021 6:10:29 PM
G - Extended from any sound base and still stubbornly holding its ground near its all-time high. Its 50 DMA line ($39.40) defines important near-term support to watch on pullbacks. Reported Aug '21 quarterly earnings +40% on +20% sales revenues versus the year ago period.
>>> FEATURED STOCK ARTICLE : Extended From Prior Highs and Stubbornly Holding Ground - 11/1/2021 |
View all notes |
Set NEW NOTE alert |
Company Profile |
SEC
News |
Chart |
Request a new note
C
A
S
I |
AVTR
-
NYSE
Avantor Inc
Medical-Research Eqp/Svc
|
$39.10
|
+0.13
0.33% |
$39.49
|
3,149,016
70.78% of 50 DAV
50 DAV is 4,449,300
|
$44.37
-11.88%
|
6/10/2021
|
$32.94
|
PP = $34.09
|
|
MB = $35.79
|
Most Recent Note - 11/5/2021 1:08:54 PM
G - Sputtering after meeting resistance at its 50 DMA line ($40.33) since last noted on 10/29/21. Bullish action came after it reported Sep '21 quarterly earnings +46% above the year ago period. Completed a Secondary Offering on 9/13/21. Resistance remains due to overhead supply up to the $44 level.
>>> FEATURED STOCK ARTICLE : Pulled Back Finding Support Near 50-Day Moving Average - 10/11/2021 |
View all notes |
Set NEW NOTE alert |
Company Profile |
SEC
News |
Chart |
Request a new note
C
A
S
I |
MIME
-
NASDAQ
Mimecast Limited
Computer Sftwr-Security
|
$79.46
|
+0.46
0.58% |
$79.84
|
591,736
98.79% of 50 DAV
50 DAV is 599,000
|
$80.84
-1.71%
|
10/18/2021
|
$68.17
|
PP = $71.55
|
|
MB = $75.13
|
Most Recent Note - 11/3/2021 5:23:46 PM
G - Hit another new all-time high with today's big gain, getting very extended from the previously noted base. Prior highs in the $71 area define initial support above its 50 DMA line ($68) .
>>> FEATURED STOCK ARTICLE : MIME Consolidating Less Than 4% Off High Building New Base - 10/21/2021 |
View all notes |
Set NEW NOTE alert |
Company Profile |
SEC
News |
Chart |
Request a new note
C
A
S
I |
ZD
-
NASDAQ
Ziff Davis Inc
Internet-Content
|
$132.98
|
+1.47
1.12% |
$134.99
|
338,517
78.91% of 50 DAV
50 DAV is 429,000
|
$135.00
-1.50%
|
10/25/2021
|
$126.07
|
PP = $128.19
|
|
MB = $134.60
|
Most Recent Note - 11/8/2021 6:12:45 PM
Y - Posted a big gain today with +46% above average volume for a close above the pivot point helping clinch a convincing technical buy signal. Quarterly and annual earnings (C and A criteria) history has been strong.
>>> FEATURED STOCK ARTICLE : Internet Content Firm Perched Near Prior High - 10/25/2021 |
View all notes |
Set NEW NOTE alert |
Company Profile |
SEC
News |
Chart |
Request a new note
C
A
S
I |