You are not logged in.
This means you
CAN ONLY VIEW reports that were published prior to Friday, April 11, 2025.
You
MUST UPGRADE YOUR MEMBERSHIP if you want to see any current reports.
AFTER MARKET UPDATE - THURSDAY, OCTOBER 14TH, 2021
Previous After Market Report Next After Market Report >>>
|
|
|
|
DOW |
+534.75 |
34,912.56 |
+1.56% |
|
Volume |
795,276,964 |
+0% |
|
Volume |
4,240,308,200 |
+5% |
|
NASDAQ |
+251.79 |
14,823.43 |
+1.73% |
|
Advancers |
2,506 |
77% |
|
Advancers |
2,935 |
66% |
|
S&P 500 |
+74.46 |
4,438.26 |
+1.71% |
|
Decliners |
751 |
23% |
|
Decliners |
1,484 |
34% |
|
Russell 2000 |
+32.21 |
2,274.18 |
+1.44% |
|
52 Wk Highs |
156 |
|
|
52 Wk Highs |
107 |
|
|
S&P 600 |
+16.71 |
1,370.25 |
+1.23% |
|
52 Wk Lows |
23 |
|
|
52 Wk Lows |
53 |
|
|
With today's big gains the direction of the major averages (M) has shifted to a new "confirmed uptrend" and new buying is now warranted based on the noted follow-through day.
|
 |
Follow-Through Day of Big Gains for Major Averages
Kenneth J. Gruneisen - Passed the CAN SLIM® Master's Exam
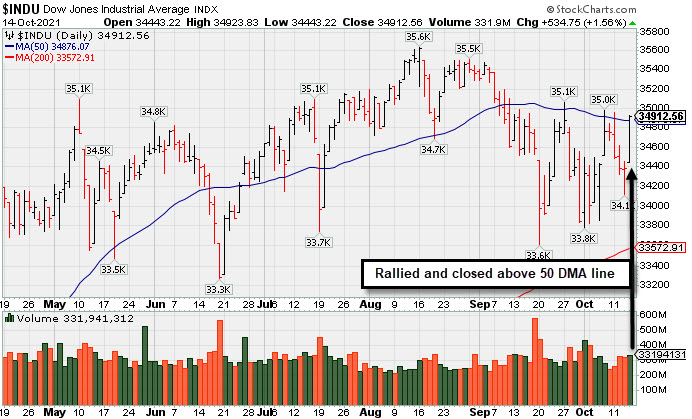
The S&P 500 and Nasdaq Composite both rallied 1.7%, with the benchmarks notching their biggest one-day gain since March and May, respectively. The Dow jumped 534 points, snapping a four-day losing streak.The volume totals reported were higher than the prior session on the NYSE and on the Nasdaq exchange. Advancers led decliners by more than a 3-1 margin on the NYSE and by 2-1 on the Nasdaq exchange. There were 16 high-ranked companies from the Leaders List that hit new 52-week highs and were listed on the BreakOuts Page versus the total of 16 on the prior session. New 52-week highs totals expanded and outnumbered shrinking new 52-week lows on the NYSE and on the Nasdaq exchange. The solid gains on Thursday met the definition of a follow-through day confirming a new rally for the major indices (M criteria). Investors are reminded to only make proper new buys as per the fundamental and technical rules of the fact-based investment system.
PICTURED: The Dow Jones Industrial Average rallied and closed back above its 50-day moving average (DMA) line. Disciplined investors following the fact-based investment system will note the session as a proper follow-through day - which requires a solid gain from at least one of the major averages backed by higher volume and coupled with an expansion in the number of stocks hitting new highs.
U.S. stocks finished firmly higher on Thursday as strong corporate earnings reports and better-than-anticipated economic updates helped overshadow lingering supply chain worries. All 11 S&P 500 sectors ended in positive territory, with just the Consumer Discretionary group failing to rise more than 1%. Profit tallies from Wall Street’s biggest banks remained in focus, with Bank of America (BAC +4.47%) rising and Morgan Stanley (MS +2.48%) up amid a standout quarter for each of its investment banking units. Elsewhere, UnitedHealth Group (UNH +4.17%) rose after boosting its full-year forecast. Walgreens Boots Alliance (WBA +7.43%) rose after topping analysts’ expectations and announcing plans to expand its services in primary care and home care. Chipmakers outperformed, with the Philadelphia Semiconductor Index gaining 3% after Taiwan Semiconductor (TSM +2.35%) issued upbeat guidance.
On the data front, weekly initial jobless claims came in at a fresh pandemic low of 293,000. Separately, the producer price index (PPI) rose 0.5% in September, versus estimates of a 0.6% gain and the previous month’s 0.7% uptick. Core PPI (excluding food and energy) advanced just 0.2% during the month, slowing from August’s 0.6% increase. Treasuries advanced, with the yield on the 10-year note down three basis points to 1.51%. In commodities, WTI crude rose 1.2% to $81.38/barrel, as a sharp drawdown in stockpiles at a key storage hub in Cushing, Oklahoma outweighed a 6 million barrel jump in overall domestic crude supplies. |
 Kenneth J. Gruneisen started out as a licensed stockbroker in August 1987, a couple of months prior to the historic stock market crash that took the Dow Jones Industrial Average down -22.6% in a single day. He has published daily fact-based fundamental and technical analysis on high-ranked stocks online for two decades. Through FACTBASEDINVESTING.COM, Kenneth provides educational articles, news, market commentary, and other information regarding proven investment systems that work in good times and bad.
Comments contained in the body of this report are technical opinions only and are not necessarily those of Gruneisen Growth Corp. The material herein has been obtained from sources believed to be reliable and accurate, however, its accuracy and completeness cannot be guaranteed. Our firm, employees, and customers may effect transactions, including transactions contrary to any recommendation herein, or have positions in the securities mentioned herein or options with respect thereto. Any recommendation contained in this report may not be suitable for all investors and it is not to be deemed an offer or solicitation on our part with respect to the purchase or sale of any securities. |
|
 |
Retail, Financial, Tech, and Commodity-Linked Groups Rose
Kenneth J. Gruneisen - Passed the CAN SLIM® Master's Exam
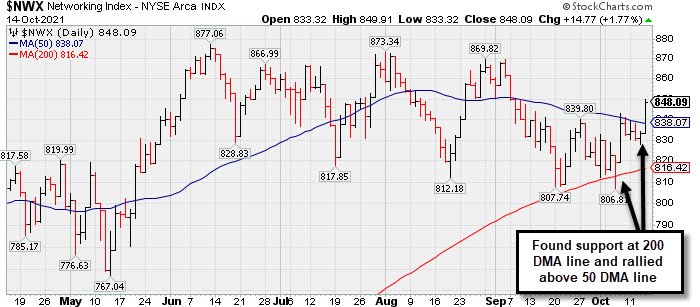
The Broker/Dealer Index ($XBD +1.30%), Bank Index ($BKX +1.32%), and Retail Index ($RLX +1.02%) posted unanimous gains helping lift the major averages. The Semiconductor Index ($SOX +3.08%) led the tech sector higher while the Networking Index ($NWX +1.77%) and Biotech Index ($BTK +1.31%) posted smaller gains. Commodity-linked groups also had a positive bias as the Gold & Silver Index ($XAU +2.37%) outpaced the Oil Services Index ($OSX +1.09%) and Integrated Oil Index ($XOI +1.06%).
PICTURED: The Networking Index ($NWX +1.77%) found prompt support near its 200-day moving average (DMA) line and rallied above its 50 DMA line with Thursday's big gain.
| Oil Services |
$OSX |
63.55 |
+0.68 |
+1.09% |
+43.37% |
| Integrated Oil |
$XOI |
1,194.85 |
+12.48 |
+1.06% |
+50.77% |
| Semiconductor |
$SOX |
3,291.24 |
+98.48 |
+3.08% |
+17.73% |
| Networking |
$NWX |
848.09 |
+14.77 |
+1.77% |
+18.26% |
| Broker/Dealer |
$XBD |
486.83 |
+6.25 |
+1.30% |
+28.93% |
| Retail |
$RLX |
3,972.92 |
+39.96 |
+1.02% |
+11.50% |
| Gold & Silver |
$XAU |
132.85 |
+3.07 |
+2.37% |
-7.86% |
| Bank |
$BKX |
135.18 |
+1.76 |
+1.32% |
+38.07% |
| Biotech |
$BTK |
5,644.41 |
+72.89 |
+1.31% |
-1.65% |
|
|
|
 |
Found Prompt Support Near 50-Day Moving Average Line
Kenneth J. Gruneisen - Passed the CAN SLIM® Master's Exam
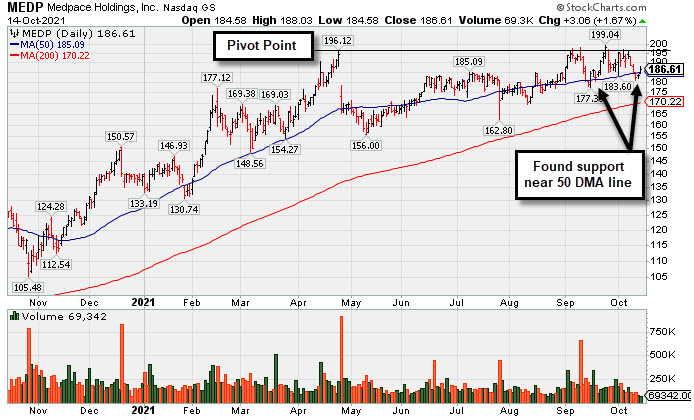
Medpace Holdings Inc (MEDP +$3.06 or +1.67% to $186.61) recently slumped from near its 52-week high with losses on light volume and found support near its 50-day moving average (DMA) line ($185). More damaging losses below recent lows would raise serious concerns and trigger technical sell signals. It was highlighted in yellow with pivot point cited based on its 4/26/21 high plus 10 cents in the 9/10/21 mid-day report. Subsequent gains and strong close above the pivot point backed by at least +40% above average volume may trigger a technical buy signal. It was last shown in this FSU section on 9/10/21 with an annotated graph under the headline, Negative Reversal Indicative of Distributional Pressure".
It has a 98 Earnings Per Share Rating, putting it in the top 5% of all publicly traded companies. MEDP reported Jun '21 earnings +66% on +36% sales revenues versus the year ago period, its 4rd strong earnings increase above the +25% minimum guideline (C criteria), helping it better match the winning models of the fact-based investment system. Annual earnings history has still been strong. It made choppy progress since dropped from the Featured Stocks list on 3/05/19.
There is a small supply of only 35.8 million shares outstanding (S criteria) which can contribute to greater price volatility in the event of institutional buying or selling. The number of top-rated funds owning its shares rose from 188 in Dec '17 to 635 in Sep '21, a reassuring sign concerning the I criteria. Its current Up/Down Volume Ratio of 1.1 is an unbiased indication its shares have been under slight accumulation over the past 50 days. It has earned a Timeliness Rating of B and Sponsorship rating of C. Completed Secondary Offerings on 6/12/18, 5/04/18, and 12/01/17.
Charts courtesy of www.stockcharts.com |
|
|
Color Codes Explained :
Y - Better candidates highlighted by our
staff of experts.
G - Previously featured
in past reports as yellow but may no longer be buyable under the
guidelines.
***Last / Change / Volume data in this table is the closing quote data***
Symbol/Exchange
Company Name
Industry Group |
PRICE |
CHANGE
(%Change) |
Day High |
Volume
(% DAV)
(% 50 day avg vol) |
52 Wk Hi
% From Hi |
Featured
Date |
Price
Featured |
Pivot Featured |
|
Max Buy |
 SIVB
-
NASDAQ
SIVB
-
NASDAQ
S V B Financial Group
BANKING - Regional - Pacific Banks
|
$683.89
|
+16.17
2.42% |
$685.64
|
341,388
85.78% of 50 DAV
50 DAV is 398,000
|
$692.21
-1.20%
|
8/6/2021
|
$589.70
|
PP = $608.94
|
|
MB = $639.39
|
Most Recent Note - 10/12/2021 5:43:56 PM
G - There was a "negative reversal" on the prior session after hitting a new all-time high. Extended from the previously noted base, the prior highs in the $608 area define initial support to watch above its 50 DMA line ($600). Completed a new Public Offering on 8/11/21.
>>> FEATURED STOCK ARTICLE : Pullback After 5 Straight Gains into New High Territory - 9/28/2021 |
View all notes |
Set NEW NOTE alert |
Company Profile |
SEC
News |
Chart |
Request a new note
C
A
S
I |
BLDR
-
NYSE
Builders Firstsource Inc
Bldg-Constr Prds/Misc
|
$56.81
|
+0.39
0.69% |
$57.81
|
2,030,826
99.31% of 50 DAV
50 DAV is 2,045,000
|
$56.61
0.35%
|
8/12/2021
|
$52.38
|
PP = $54.09
|
|
MB = $56.79
|
 Most Recent Note - 10/14/2021 6:13:34 PM
Y - Posted an 8th consecutive gain today for a new all-time high and it closed near its "max buy" level. Gains did not have the +40% above average volume needed to trigger a proper technical buy signal. Fundamentals remain strong.
>>> FEATURED STOCK ARTICLE : Sputtering After Wedging to New Highs - 10/1/2021 |
View all notes |
Set NEW NOTE alert |
Company Profile |
SEC
News |
Chart |
Request a new note
C
A
S
I |
KFRC
-
NASDAQ
Kforce Inc
Comml Svcs-Staffing
|
$65.17
|
-1.55
-2.32% |
$67.69
|
118,829
103.33% of 50 DAV
50 DAV is 115,000
|
$69.00
-5.55%
|
9/10/2021
|
$59.53
|
PP = $64.48
|
|
MB = $67.70
|
Most Recent Note - 10/14/2021 6:20:31 PM
Y - Pulled back today with higher (near average) volume. Stalled since its 10/07/21 gain for a new all-time high backed by +58% above average volume triggered a technical buy signal. Fundamentals are strong.
>>> FEATURED STOCK ARTICLE : Staffing Firm Still Faces Some Overhead Supply - 9/13/2021 |
View all notes |
Set NEW NOTE alert |
Company Profile |
SEC
News |
Chart |
Request a new note
C
A
S
I |
GNRC
-
NYSE
Generac Hldgs Inc
Electrical-Power/Equipmt
|
$433.75
|
+14.84
3.54% |
$434.77
|
528,297
86.32% of 50 DAV
50 DAV is 612,000
|
$466.92
-7.10%
|
8/30/2021
|
$449.36
|
PP = $457.10
|
|
MB = $479.96
|
Most Recent Note - 10/14/2021 6:17:52 PM
Y - Color code is changed to yellow after a rebound above its 50 DMA line ($424) with today's gain helped its outlook improve. Some resistance remains due to overhead supply up to the $466 level
>>> FEATURED STOCK ARTICLE : Prior Lows Define Near-Term Support After 50 DMA Violation - 10/6/2021 |
View all notes |
Set NEW NOTE alert |
Company Profile |
SEC
News |
Chart |
Request a new note
C
A
S
I |
CAMT
-
NASDAQ
Camtek Ltd
ELECTRONICS - Scientific and Technical Instrum
|
$38.67
|
+0.20
0.52% |
$39.12
|
111,573
66.41% of 50 DAV
50 DAV is 168,000
|
$46.01
-15.95%
|
8/4/2021
|
$39.67
|
PP = $40.57
|
|
MB = $42.60
|
Most Recent Note - 10/8/2021 5:45:55 PM
G - Slumped today with light volume as it fell below its 50 DMA line ($39.97). The prior low ($34.68 on 8/17/21) defines the next important near-term support to watch. Fundamentals remain strong.
>>> FEATURED STOCK ARTICLE : Fell Below Prior High and Violated 50-Day Moving Average - 10/5/2021 |
View all notes |
Set NEW NOTE alert |
Company Profile |
SEC
News |
Chart |
Request a new note
C
A
S
I |
Symbol/Exchange
Company Name
Industry Group |
PRICE |
CHANGE
(%Change) |
Day High |
Volume
(% DAV)
(% 50 day avg vol) |
52 Wk Hi
% From Hi |
Featured
Date |
Price
Featured |
Pivot Featured |
|
Max Buy |
PKI
-
NYSE
Perkinelmer Inc
ELECTRONICS - Scientific and Technical Instrum
|
$169.68
|
+1.68
1.00% |
$172.56
|
472,485
71.59% of 50 DAV
50 DAV is 660,000
|
$192.00
-11.63%
|
8/18/2021
|
$181.07
|
PP = $188.50
|
|
MB = $197.93
|
Most Recent Note - 10/12/2021 5:47:58 PM
G - Suffered a 3rd consecutive loss. A rebound above the 50 DMA line ($181.78) is needed for its outlook to improve. Its Relative Strength Rating has slumped to 78. Fundamentals remain strong.
>>> FEATURED STOCK ARTICLE : Stalled But Holding Ground After Recent "3 Weeks Tight" - 9/17/2021 |
View all notes |
Set NEW NOTE alert |
Company Profile |
SEC
News |
Chart |
Request a new note
C
A
S
I |
UMC
-
NYSE
United Microelectrnc Adr
ELECTRONICS - Semiconductor - Integrated Cir
|
$10.24
|
+0.08
0.79% |
$10.43
|
7,041,119
97.09% of 50 DAV
50 DAV is 7,252,000
|
$12.62
-18.86%
|
8/5/2021
|
$11.62
|
PP = $11.38
|
|
MB = $11.95
|
Most Recent Note - 10/14/2021 6:27:36 PM
G - Posted a small gain today after 4 consecutive losses slumping near its 200 DMA line ($9.82). A rebound above the 50 DMA line ($11.23) is needed for its outlook to improve.
>>> FEATURED STOCK ARTICLE : Consolidating Above 50-day Moving Average Near "Max Buy" Level - 9/27/2021 |
View all notes |
Set NEW NOTE alert |
Company Profile |
SEC
News |
Chart |
Request a new note
C
A
S
I |
BRKS
-
NASDAQ
Brooks Automation
ELECTRONICS - Semiconductor Equipment and Mate
|
$101.14
|
+2.47
2.50% |
$102.43
|
439,597
68.79% of 50 DAV
50 DAV is 639,000
|
$110.40
-8.39%
|
9/20/2021
|
$101.21
|
PP = $108.82
|
|
MB = $114.26
|
Most Recent Note - 10/14/2021 6:15:05 PM
Y - Posted a gain today with lighter than average volume. Still perched within striking distance of its 52-week high. Pivot point cited was based on its 4/27/21 high plus 10 cents. Subsequent gains above the pivot point or prior highs backed by at least 40% above average volume may trigger a convincing technical buy signal.
>>> FEATURED STOCK ARTICLE : Rallying Near High After Brief Consolidation Below 200 DMA Line - 9/20/2021 |
View all notes |
Set NEW NOTE alert |
Company Profile |
SEC
News |
Chart |
Request a new note
C
A
S
I |
ENTG
-
NASDAQ
Entegris Inc
ELECTRONICS - Semiconductor Equipment and Mate
|
$127.90
|
+6.79
5.61% |
$127.96
|
1,035,171
149.35% of 50 DAV
50 DAV is 693,100
|
$135.99
-5.95%
|
8/4/2021
|
$125.33
|
PP = $126.51
|
|
MB = $132.84
|
Most Recent Note - 10/14/2021 6:30:15 PM
Y - Posted a big volume-driven gain today and its color code is changed to yellow. Found support near its 50 DMA line ($122) after damaging losses. Its prior low and 200 DMA line define the next important support in the $109 area.
>>> FEATURED STOCK ARTICLE : Hit New High and Rose Above its Max Buy Level - 9/23/2021 |
View all notes |
Set NEW NOTE alert |
Company Profile |
SEC
News |
Chart |
Request a new note
C
A
S
I |
CLFD
-
NASDAQ
Clearfield Inc
TELECOMMUNICATIONS - Cables / Satalite Equipment
|
$53.70
|
+1.37
2.62% |
$53.94
|
84,956
103.60% of 50 DAV
50 DAV is 82,000
|
$53.52
0.34%
|
7/23/2021
|
$40.23
|
PP = $43.74
|
|
MB = $45.93
|
Most Recent Note - 10/11/2021 4:54:06 PM
G - Posted a gain with above average volume today. Perched at its 52-week high, extended from the previously noted base. Found prompt support near its 50 DMA line ($44.58) after testing the prior low ($42.34) where more damaging losses may trigger technical sell signals. Fundamentals remain strong.
>>> FEATURED STOCK ARTICLE : Quietly Consolidating Near All-Time High - 9/14/2021 |
View all notes |
Set NEW NOTE alert |
Company Profile |
SEC
News |
Chart |
Request a new note
C
A
S
I |
Symbol/Exchange
Company Name
Industry Group |
PRICE |
CHANGE
(%Change) |
Day High |
Volume
(% DAV)
(% 50 day avg vol) |
52 Wk Hi
% From Hi |
Featured
Date |
Price
Featured |
Pivot Featured |
|
Max Buy |
TGH
-
NYSE
Textainer Group Holdings
TRANSPORTATION - Logistics
|
$36.86
|
-0.14
-0.38% |
$37.53
|
358,091
80.29% of 50 DAV
50 DAV is 446,000
|
$37.88
-2.69%
|
10/7/2021
|
$36.97
|
PP = $36.80
|
|
MB = $38.64
|
Most Recent Note - 10/14/2021 6:25:56 PM
Y - Stubbornly holding its ground near its 52-week high. Its 50 DMA line ($34.12) defines important near-term support to watch above recent lows in the $30-31 area. Subsequent gains above the pivot point backed by at least +40% above average volume may trigger a proper technical buy signal. Fundamentals remain strong.
>>> FEATURED STOCK ARTICLE : Perched Near High With Strong Fundamentals - 10/7/2021 |
View all notes |
Set NEW NOTE alert |
Company Profile |
SEC
News |
Chart |
Request a new note
C
A
S
I |
SMPL
-
NASDAQ
Simply Good Foods Co
Food-Confectionery
|
$34.63
|
+0.18
0.52% |
$35.01
|
290,962
89.39% of 50 DAV
50 DAV is 325,500
|
$38.50
-10.05%
|
12/28/2020
|
$30.40
|
PP = $31.44
|
|
MB = $33.01
|
Most Recent Note - 10/12/2021 5:39:46 PM
G - Consolidating just above its 50 DMA line ($35.37). Its Relative Strength Rating has slumped to 78. Recent low ($33.55 on 9/20/21) and 200 DMA line define important support where more damaging losses would raise greater concerns. Fundamentals remain strong. See the latest FSU analysis for more details and a new annotated graph.
>>> FEATURED STOCK ARTICLE : Consolidating Just Above 50-Day Moving Average Line - 10/12/2021 |
View all notes |
Set NEW NOTE alert |
Company Profile |
SEC
News |
Chart |
Request a new note
C
A
S
I |
WDAY
-
NYSE
Workday Inc Cl A
Computer Sftwr-Enterprse
|
$271.11
|
+4.51
1.69% |
$273.39
|
1,353,727
87.11% of 50 DAV
50 DAV is 1,554,000
|
$282.77
-4.12%
|
9/7/2021
|
$275.69
|
PP = $282.87
|
|
MB = $297.01
|
Most Recent Note - 10/13/2021 6:16:10 PM
Y - Gapped up today, but encountered pressure and ended near the middle of its intra-day range after larger early gains. Its 50 DMA line ($255).and recent lows ($246) define near-term support to watch where violations would raise concerns. Faces resistance due to overhead supply up to the $278 level after trading higher for the past month. Fundamentals remain strong. See the latest FSU analysis for more details and a new annotated graph.
>>> FEATURED STOCK ARTICLE : Rebounding From 50-Day Moving Average Toward Prior Highs - 10/13/2021 |
View all notes |
Set NEW NOTE alert |
Company Profile |
SEC
News |
Chart |
Request a new note
C
A
S
I |
CTLT
-
NYSE
Catalent Inc
DRUGS - Biotechnology
|
$128.94
|
+0.78
0.61% |
$130.98
|
384,390
43.53% of 50 DAV
50 DAV is 883,000
|
$142.64
-9.60%
|
8/25/2021
|
$128.72
|
PP = $127.78
|
|
MB = $134.17
|
Most Recent Note - 10/11/2021 4:52:39 PM
Y - Volume totals have been cooling. Sputtering below Its 50 DMA line ($130) and testing prior highs in the $124-127 area which define important near-term support to watch. Fundamentals remain strong.
>>> FEATURED STOCK ARTICLE : Found Support Near Prior High While Consolidating - 10/8/2021 |
View all notes |
Set NEW NOTE alert |
Company Profile |
SEC
News |
Chart |
Request a new note
C
A
S
I |
MEDP
-
NASDAQ
Medpace Holdings Inc
Medical-Research Eqp/Svc
|
$186.61
|
+3.06
1.67% |
$188.03
|
69,342
41.92% of 50 DAV
50 DAV is 165,400
|
$199.04
-6.24%
|
9/10/2021
|
$196.32
|
PP = $196.22
|
|
MB = $206.03
|
Most Recent Note - 10/14/2021 6:22:43 PM
Y - Quietly slumped from near its 52-week high finding prompt support near its 50 DMA line ($185). More damaging losses would raise concerns. Pivot point cited was based on its 4/26/21 high plus 10 cents. Subsequent gains and strong close above the pivot point backed by at least +40% above average volume may trigger a technical buy signal. See the latest FSU analysis for more details and a new annotated graph.
>>> FEATURED STOCK ARTICLE : Found Prompt Support Near 50-Day Moving Average Line - 10/14/2021 |
View all notes |
Set NEW NOTE alert |
Company Profile |
SEC
News |
Chart |
Request a new note
C
A
S
I |
Symbol/Exchange
Company Name
Industry Group |
PRICE |
CHANGE
(%Change) |
Day High |
Volume
(% DAV)
(% 50 day avg vol) |
52 Wk Hi
% From Hi |
Featured
Date |
Price
Featured |
Pivot Featured |
|
Max Buy |
JEF
-
NYSE
Jefferies Financial Grp
Finance-Invest Bnk/Bkrs
|
$41.35
|
+0.79
1.95% |
$41.44
|
1,827,047
104.28% of 50 DAV
50 DAV is 1,752,000
|
$40.94
1.00%
|
6/28/2021
|
$31.81
|
PP = $34.42
|
|
MB = $36.14
|
Most Recent Note - 10/11/2021 12:35:18 PM
G - Posting a 7th consecutive gain today for another new all-time high. Its 50 DMA line ($36.43) defines important near-term support to watch on pullbacks. Reported Aug '21 quarterly earnings +713% on +70% sales revenues versus the year ago period.
>>> FEATURED STOCK ARTICLE : Perched at 52-week High With Earnings News Due - 9/29/2021 |
View all notes |
Set NEW NOTE alert |
Company Profile |
SEC
News |
Chart |
Request a new note
C
A
S
I |
AVTR
-
NYSE
Avantor Inc
Medical-Research Eqp/Svc
|
$37.54
|
+0.34
0.91% |
$37.96
|
3,237,231
84.59% of 50 DAV
50 DAV is 3,827,000
|
$44.37
-15.39%
|
6/10/2021
|
$32.94
|
PP = $34.09
|
|
MB = $35.79
|
Most Recent Note - 10/12/2021 12:00:13 PM
G - Gapped down today violating its 50 DMA line ($40.39) and also undercutting the recent low ($39.24 on 10/01/21) with a damaging volume-driven loss triggering technical sell signals. Completed a Secondary Offering on 9/13/21 while perched at its all-time high, very extended from any sound base.
>>> FEATURED STOCK ARTICLE : Pulled Back Finding Support Near 50-Day Moving Average - 10/11/2021 |
View all notes |
Set NEW NOTE alert |
Company Profile |
SEC
News |
Chart |
Request a new note
C
A
S
I |
MIME
-
NASDAQ
Mimecast Limited
Computer Sftwr-Security
|
$66.67
|
+2.28
3.54% |
$66.77
|
435,080
46.14% of 50 DAV
50 DAV is 943,000
|
$71.45
-6.69%
|
8/2/2021
|
$56.12
|
PP = $59.58
|
|
MB = $62.56
|
Most Recent Note - 10/12/2021 5:42:21 PM
G - Recently slumped below its 50 DMA line ($64.27) toward prior highs in the $59 area defining near-term support to watch. Fundamentals remain strong. A rebound above the 50 DMA line is needed for its outlook to improve.
>>> FEATURED STOCK ARTICLE : Consolidating After Getting Extended from Previous Base Noted - 9/21/2021 |
View all notes |
Set NEW NOTE alert |
Company Profile |
SEC
News |
Chart |
Request a new note
C
A
S
I |
|
|
|
THESE ARE NOT BUY RECOMMENDATIONS!
Comments contained in the body of this report are technical
opinions only. The material herein has been obtained
from sources believed to be reliable and accurate, however,
its accuracy and completeness cannot be guaranteed.
This site is not an investment advisor, hence it does
not endorse or recommend any securities or other investments.
Any recommendation contained in this report may not
be suitable for all investors and it is not to be deemed
an offer or solicitation on our part with respect to
the purchase or sale of any securities. All trademarks,
service marks and trade names appearing in this report
are the property of their respective owners, and are
likewise used for identification purposes only.
This report is a service available
only to active Paid Premium Members.
You may opt-out of receiving report notifications
at any time. Questions or comments may be submitted
by writing to Premium Membership Services 665 S.E. 10 Street, Suite 201 Deerfield Beach, FL 33441-5634 or by calling 1-800-965-8307
or 954-785-1121.
|
|
|