You are not logged in.
This means you
CAN ONLY VIEW reports that were published prior to Friday, March 21, 2025.
You
MUST UPGRADE YOUR MEMBERSHIP if you want to see any current reports.
AFTER MARKET UPDATE - TUESDAY, OCTOBER 12TH, 2021
Previous After Market Report Next After Market Report >>>
|
|
|
|
DOW |
-117.72 |
34,378.34 |
-0.34% |
|
Volume |
781,316,336 |
+11% |
|
Volume |
4,027,249,800 |
+16% |
|
NASDAQ |
-20.28 |
14,465.92 |
-0.14% |
|
Advancers |
1,942 |
60% |
|
Advancers |
2,517 |
58% |
|
S&P 500 |
-10.54 |
4,350.65 |
-0.24% |
|
Decliners |
1,284 |
40% |
|
Decliners |
1,841 |
42% |
|
Russell 2000 |
+13.63 |
2,234.27 |
+0.61% |
|
52 Wk Highs |
86 |
|
|
52 Wk Highs |
59 |
|
|
S&P 600 |
+4.66 |
1,354.25 |
+0.35% |
|
52 Wk Lows |
60 |
|
|
52 Wk Lows |
118 |
|
|
We have repeatedly posted this notice that the direction of the major averages (M) has shifted to a "market correction" and new buying is to be avoided. Greater caution is now warranted until a new confirmed rally with a follow-through day is noted.
|
 |
Leadership Thinned as Major Indices Sputtered
Kenneth J. Gruneisen - Passed the CAN SLIM® Master's Exam
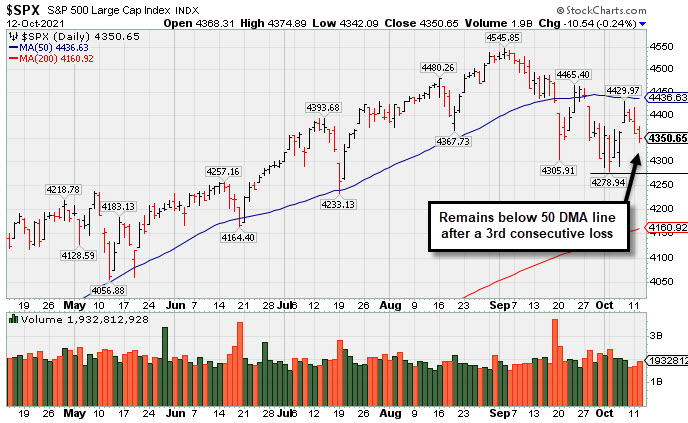
The Dow fell 117 points, while the S&P 500 edged 0.2% lower. The Nasdaq Composite slipped 0.1%. The volume totals reported were higher than the prior session on the NYSE and on the Nasdaq exchange. Advancers led decliners by a 3-2 margin on the NYSE and by 5-3 on the Nasdaq exchange. There were 20 high-ranked companies from the Leaders List that hit new 52-week highs and were listed on the BreakOuts Page versus the total of 66 on the prior session. New 52-week highs outnumbered new 52-week lows on the NYSE, but new lows still outnumbered new highs on the Nasdaq exchange. The major indices (M criteria) have come under greater pressure and earned the label of a "market correction". During corrections investors are reminded to avoid new buying decisions and to sell weakening stocks on a case-by-case basis, reducing exposure and raising cash as per the rules of the fact-based investment system.
PICTURED: The S&P 500 Index pulled back on Tuesday with higher volume for a 3rd consecutive loss. Disciplined investors following the fact-based investment system will wait to make new buys only after a proper follow-through day - which requires a solid gain from at least one of the major averages backed by higher volume and coupled with an expansion in the number of stocks hitting new highs. U.S. stocks turned lower in the final hours of trading on Tuesday as investors anticipated the start of third-quarter corporate earnings season and monitored inflationary pressures. The losses capped a three-day losing streak for all three benchmarks as worries surrounding a global energy crunch and its impact on economic growth continued to weigh on risk sentiment. WTI crude was little changed at $80.54/barrel, remaining near a seven-year high. Meanwhile, a New York Fed survey indicated consumers’ expectations for inflation increased last month to the highest on records going back eight years.
Treasuries were mixed, with the yield curve flattening. The benchmark 10-year note rate fell three basis points to 1.57% following a well-received $38 billion auction of the maturity, while the yield on the two-year note added two basis points to 0.34%, near its highest level since March 2020. On the data front, a measure of small business optimism fell to the lowest level since March last month. Separately, the Jobs Openings and Labor Turnover Survey (JOLTS) showed available positions fell to 10.4 million in August, easing from the previous month’s record high of 11 million. In central bank news, Fed Vice Chair Clarida stated that the conditions necessary to start dialing back monetary stimulus have “all but been met.”
Six of 11 S&P 500 sectors finished in negative territory, with Communication Services and Technology stocks lagging. The Consumer Discretionary group outperformed, with MGM Resorts International (MGM +9.61%) advancing on the heels of an analyst upgrade. |
 Kenneth J. Gruneisen started out as a licensed stockbroker in August 1987, a couple of months prior to the historic stock market crash that took the Dow Jones Industrial Average down -22.6% in a single day. He has published daily fact-based fundamental and technical analysis on high-ranked stocks online for two decades. Through FACTBASEDINVESTING.COM, Kenneth provides educational articles, news, market commentary, and other information regarding proven investment systems that work in good times and bad.
Comments contained in the body of this report are technical opinions only and are not necessarily those of Gruneisen Growth Corp. The material herein has been obtained from sources believed to be reliable and accurate, however, its accuracy and completeness cannot be guaranteed. Our firm, employees, and customers may effect transactions, including transactions contrary to any recommendation herein, or have positions in the securities mentioned herein or options with respect thereto. Any recommendation contained in this report may not be suitable for all investors and it is not to be deemed an offer or solicitation on our part with respect to the purchase or sale of any securities. |
|
 |
Gold & Silver, Biotech, and Retail Indexes Rose
Kenneth J. Gruneisen - Passed the CAN SLIM® Master's Exam
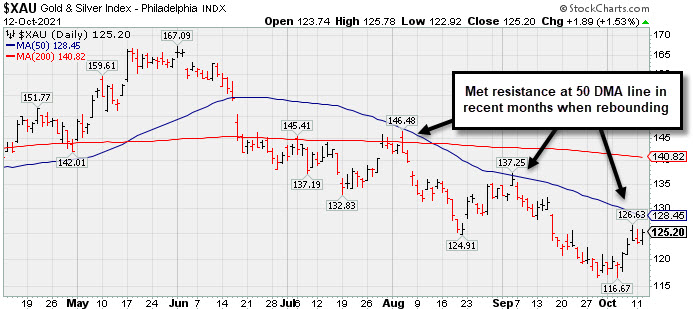
The Retail Index ($RLX +0.21%) eked out a small gain while the Bank Index ($BKX -0.36%) and Broker/Dealer Index ($XBD -0.12%) both ended slightly in the red. The Semiconductor Index ($SOX -1.34%) outpaced the Networking Index ($NWX -0.40%) to the downside while the Biotech Index ($BTK +0.50%) edged higher. The Gold & Silver Index ($XAU +1.53%) posted a solid gain while the Oil Services Index ($OSX +0.18%) and Integrated Oil Index ($XOI -0.21%) both were little changed.
PICTURED: The Gold & Silver Index ($XAU +1.53%) recently met resistance at its 50-day moving average (DMA) line when rebounding.
| Oil Services |
$OSX |
62.33 |
+0.11 |
+0.18% |
+40.61% |
| Integrated Oil |
$XOI |
1,179.89 |
-2.45 |
-0.21% |
+48.89% |
| Semiconductor |
$SOX |
3,178.15 |
-43.08 |
-1.34% |
+13.69% |
| Networking |
$NWX |
830.73 |
-3.32 |
-0.40% |
+15.84% |
| Broker/Dealer |
$XBD |
482.35 |
-0.60 |
-0.12% |
+27.74% |
| Retail |
$RLX |
3,895.58 |
+7.97 |
+0.21% |
+9.33% |
| Gold & Silver |
$XAU |
125.20 |
+1.89 |
+1.53% |
-13.17% |
| Bank |
$BKX |
134.46 |
-0.49 |
-0.36% |
+37.33% |
| Biotech |
$BTK |
5,597.50 |
+28.10 |
+0.50% |
-2.47% |
|
|
|
 |
Consolidating Just Above 50-Day Moving Average Line
Kenneth J. Gruneisen - Passed the CAN SLIM® Master's Exam
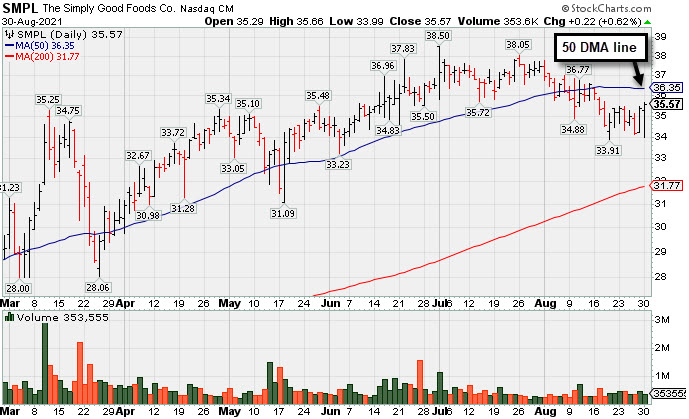
Simply Good Foods Co (SMPL +$0.02 or +0.06% to $35.43) posted a small gain today with light volume. It stalled after hitting a new all-time high on 7/01/21. It has found support and recently rebounded above its 50-day moving average (DMA) line ($35.37) helping its outlook to improve.
Recently it reported May '21 quarterly earnings +65% on +32% sales revenues versus the year ago period, well above the +25% minimum earnings guideline (C criteria). In 4 of the past 6 quarterly comparisons earnings were above the +25% minimum guideline (C criteria). Its annual earnings history (A criteria) has been strong. It currently has a 91 Earnings Per Share Rating.
Its current Relative Strength Rating is 78, a couple of notches below the 80+ minimum guideline for buy candidates. SMPL completed a new Pubic Offering on 10/09/19. The company has a Timeliness Rating of B and Sponsorship Rating of C. The number of top-rated funds owning its shares rose from 357 in Dec '20 to 430 in Sep '21. Its current Up/Down Volume Ratio of 0.9 is an unbiased indication its shares have been under slight distributional pressure over the past 50 days.
SMPL was last shown in this FSU section on 8/30/21 with an annotated graph included under the headline, "Still Lingering Below 50-Day Moving Average Line". It was first highlighted in yellow with pivot point cited based on its 9/09/19 high plus 10 cents in the 12/28/20 mid-day report (read here).
Some leadership has been provided by other companies in the Food/Beverage Sector, however, the Food-Confectionery industry group has a Group Relative Strength Rating of 58 (C+) which is a concern regarding the L criteria. There are only 5 companies listed in the group.
|
|
|
Color Codes Explained :
Y - Better candidates highlighted by our
staff of experts.
G - Previously featured
in past reports as yellow but may no longer be buyable under the
guidelines.
***Last / Change / Volume data in this table is the closing quote data***
Symbol/Exchange
Company Name
Industry Group |
PRICE |
CHANGE
(%Change) |
Day High |
Volume
(% DAV)
(% 50 day avg vol) |
52 Wk Hi
% From Hi |
Featured
Date |
Price
Featured |
Pivot Featured |
|
Max Buy |
 SIVB
-
NASDAQ
SIVB
-
NASDAQ
S V B Financial Group
BANKING - Regional - Pacific Banks
|
$659.09
|
-7.42
-1.11% |
$666.94
|
307,406
77.43% of 50 DAV
50 DAV is 397,000
|
$692.21
-4.78%
|
8/6/2021
|
$589.70
|
PP = $608.94
|
|
MB = $639.39
|
 Most Recent Note - 10/12/2021 5:43:56 PM
G - There was a "negative reversal" on the prior session after hitting a new all-time high. Extended from the previously noted base, the prior highs in the $608 area define initial support to watch above its 50 DMA line ($600). Completed a new Public Offering on 8/11/21.
>>> FEATURED STOCK ARTICLE : Pullback After 5 Straight Gains into New High Territory - 9/28/2021 |
View all notes |
Set NEW NOTE alert |
Company Profile |
SEC
News |
Chart |
Request a new note
C
A
S
I |
BLDR
-
NYSE
Builders Firstsource Inc
Bldg-Constr Prds/Misc
|
$55.45
|
+0.25
0.45% |
$56.31
|
1,641,354
79.29% of 50 DAV
50 DAV is 2,070,000
|
$56.00
-0.98%
|
8/12/2021
|
$52.38
|
PP = $54.09
|
|
MB = $56.79
|
Most Recent Note - 10/7/2021 5:49:13 PM
Y - Posted a 3rd consecutive gain today with light volume for its 2nd best ever close. Its 50 DMA line ($51.50) defines important near term support. Subsequent gains for new highs backed by at least +40% above average volume may clinch a proper technical buy signal. Fundamentals remain strong.
>>> FEATURED STOCK ARTICLE : Sputtering After Wedging to New Highs - 10/1/2021 |
View all notes |
Set NEW NOTE alert |
Company Profile |
SEC
News |
Chart |
Request a new note
C
A
S
I |
KFRC
-
NASDAQ
Kforce Inc
Comml Svcs-Staffing
|
$67.21
|
+0.85
1.28% |
$68.99
|
65,412
56.39% of 50 DAV
50 DAV is 116,000
|
$69.00
-2.59%
|
9/10/2021
|
$59.53
|
PP = $64.48
|
|
MB = $67.70
|
Most Recent Note - 10/7/2021 12:28:12 PM
Y - Hitting a new all-time high with today's gain. Previously noted - "Subsequent gains above its pivot point backed by at least +40% above average volume are needed to trigger a proper technical buy signal. Fundamentals are strong."
>>> FEATURED STOCK ARTICLE : Staffing Firm Still Faces Some Overhead Supply - 9/13/2021 |
View all notes |
Set NEW NOTE alert |
Company Profile |
SEC
News |
Chart |
Request a new note
C
A
S
I |
GNRC
-
NYSE
Generac Hldgs Inc
Electrical-Power/Equipmt
|
$421.43
|
+11.86
2.90% |
$423.45
|
473,497
74.68% of 50 DAV
50 DAV is 634,000
|
$466.92
-9.74%
|
8/30/2021
|
$449.36
|
PP = $457.10
|
|
MB = $479.96
|
Most Recent Note - 10/7/2021 5:59:02 PM
G - Rebounded toward its 50 DMA line ($423.46) which may act as resistance after damaging volume-driven losses. A rebound above the 50 DMA line is needed for its outlook to improve. See the latest FSU analysis for more details and an annotated graph.
>>> FEATURED STOCK ARTICLE : Prior Lows Define Near-Term Support After 50 DMA Violation - 10/6/2021 |
View all notes |
Set NEW NOTE alert |
Company Profile |
SEC
News |
Chart |
Request a new note
C
A
S
I |
CAMT
-
NASDAQ
Camtek Ltd
ELECTRONICS - Scientific and Technical Instrum
|
$38.80
|
+0.00
0.00% |
$39.19
|
71,908
42.30% of 50 DAV
50 DAV is 170,000
|
$46.01
-15.67%
|
8/4/2021
|
$39.67
|
PP = $40.57
|
|
MB = $42.60
|
Most Recent Note - 10/8/2021 5:45:55 PM
G - Slumped today with light volume as it fell below its 50 DMA line ($39.97). The prior low ($34.68 on 8/17/21) defines the next important near-term support to watch. Fundamentals remain strong.
>>> FEATURED STOCK ARTICLE : Fell Below Prior High and Violated 50-Day Moving Average - 10/5/2021 |
View all notes |
Set NEW NOTE alert |
Company Profile |
SEC
News |
Chart |
Request a new note
C
A
S
I |
Symbol/Exchange
Company Name
Industry Group |
PRICE |
CHANGE
(%Change) |
Day High |
Volume
(% DAV)
(% 50 day avg vol) |
52 Wk Hi
% From Hi |
Featured
Date |
Price
Featured |
Pivot Featured |
|
Max Buy |
PKI
-
NYSE
Perkinelmer Inc
ELECTRONICS - Scientific and Technical Instrum
|
$166.66
|
-1.86
-1.10% |
$170.06
|
860,243
126.60% of 50 DAV
50 DAV is 679,500
|
$192.00
-13.20%
|
8/18/2021
|
$181.07
|
PP = $188.50
|
|
MB = $197.93
|
Most Recent Note - 10/12/2021 5:47:58 PM
G - Suffered a 3rd consecutive loss. A rebound above the 50 DMA line ($181.78) is needed for its outlook to improve. Its Relative Strength Rating has slumped to 78. Fundamentals remain strong.
>>> FEATURED STOCK ARTICLE : Stalled But Holding Ground After Recent "3 Weeks Tight" - 9/17/2021 |
View all notes |
Set NEW NOTE alert |
Company Profile |
SEC
News |
Chart |
Request a new note
C
A
S
I |
UMC
-
NYSE
United Microelectrnc Adr
ELECTRONICS - Semiconductor - Integrated Cir
|
$10.34
|
-0.27
-2.54% |
$10.53
|
11,538,290
160.37% of 50 DAV
50 DAV is 7,195,000
|
$12.62
-18.07%
|
8/5/2021
|
$11.62
|
PP = $11.38
|
|
MB = $11.95
|
Most Recent Note - 10/7/2021 5:55:19 PM
G - Gapped up today rebounding toward the 50 DMA line ($11.24) which may act as resistance. Gains above the 50 DMA line are needed for its outlook to improve.
>>> FEATURED STOCK ARTICLE : Consolidating Above 50-day Moving Average Near "Max Buy" Level - 9/27/2021 |
View all notes |
Set NEW NOTE alert |
Company Profile |
SEC
News |
Chart |
Request a new note
C
A
S
I |
BRKS
-
NASDAQ
Brooks Automation
ELECTRONICS - Semiconductor Equipment and Mate
|
$99.40
|
+0.60
0.61% |
$99.71
|
392,357
60.83% of 50 DAV
50 DAV is 645,000
|
$110.40
-9.96%
|
9/20/2021
|
$101.21
|
PP = $108.82
|
|
MB = $114.26
|
Most Recent Note - 10/7/2021 5:57:10 PM
Y - Posted a gain today with higher volume. Perched within striking distance of its 52-week high hit last week. Pivot point cited was based on its 4/27/21 high plus 10 cents. Subsequent gains above the pivot point backed by at least 40% above average volume may trigger a convincing technical buy signal.
>>> FEATURED STOCK ARTICLE : Rallying Near High After Brief Consolidation Below 200 DMA Line - 9/20/2021 |
View all notes |
Set NEW NOTE alert |
Company Profile |
SEC
News |
Chart |
Request a new note
C
A
S
I |
ENTG
-
NASDAQ
Entegris Inc
ELECTRONICS - Semiconductor Equipment and Mate
|
$121.67
|
-0.88
-0.72% |
$123.98
|
595,136
85.43% of 50 DAV
50 DAV is 696,600
|
$135.99
-10.53%
|
8/4/2021
|
$125.33
|
PP = $126.51
|
|
MB = $132.84
|
Most Recent Note - 10/11/2021 4:50:38 PM
G - Finding prompt support near its 50 DMA line ($121.97) after damaging losses. Its prior low and 200 DMA line define the next important support in the $109 area.
>>> FEATURED STOCK ARTICLE : Hit New High and Rose Above its Max Buy Level - 9/23/2021 |
View all notes |
Set NEW NOTE alert |
Company Profile |
SEC
News |
Chart |
Request a new note
C
A
S
I |
CLFD
-
NASDAQ
Clearfield Inc
TELECOMMUNICATIONS - Cables / Satalite Equipment
|
$51.89
|
+0.66
1.29% |
$52.15
|
70,497
85.97% of 50 DAV
50 DAV is 82,000
|
$53.52
-3.05%
|
7/23/2021
|
$40.23
|
PP = $43.74
|
|
MB = $45.93
|
Most Recent Note - 10/11/2021 4:54:06 PM
G - Posted a gain with above average volume today. Perched at its 52-week high, extended from the previously noted base. Found prompt support near its 50 DMA line ($44.58) after testing the prior low ($42.34) where more damaging losses may trigger technical sell signals. Fundamentals remain strong.
>>> FEATURED STOCK ARTICLE : Quietly Consolidating Near All-Time High - 9/14/2021 |
View all notes |
Set NEW NOTE alert |
Company Profile |
SEC
News |
Chart |
Request a new note
C
A
S
I |
Symbol/Exchange
Company Name
Industry Group |
PRICE |
CHANGE
(%Change) |
Day High |
Volume
(% DAV)
(% 50 day avg vol) |
52 Wk Hi
% From Hi |
Featured
Date |
Price
Featured |
Pivot Featured |
|
Max Buy |
TGH
-
NYSE
Textainer Group Holdings
TRANSPORTATION - Logistics
|
$37.36
|
+1.36
3.78% |
$37.49
|
543,242
123.46% of 50 DAV
50 DAV is 440,000
|
$37.88
-1.37%
|
10/7/2021
|
$36.97
|
PP = $36.80
|
|
MB = $38.64
|
Most Recent Note - 10/7/2021 5:44:35 PM
Y - Finished near the session low today after churning above average volume. Color code was changed to yellow in the earlier mid-day report with pivot point cited based on its 9/29/21 high while building on a cup-with-handle base. It is perched within close striking distance of its 52-week high after finding prompt support near its 50 DMA line ($33.73) during an orderly consolidation. Subsequent gains above the pivot point backed by at least +40% above average volume may trigger a proper technical buy signal. Reported Jun '21 quarterly earnings +429% on +29% sales revenues versus the year ago period, its 5th strong earnings comparison. Sales revenues growth has been improving and accelerating in the 3 latest quarterly comparisons after years of sub-par and negative comparisons, not a match with with regard to the fact-based investment system's fundamental guidelines. Annual earnings (A criteria) history has been strong after a downturn and loss in FY '16. See the latest FSU analysis for more details and an annotated graph.
>>> FEATURED STOCK ARTICLE : Perched Near High With Strong Fundamentals - 10/7/2021 |
View all notes |
Set NEW NOTE alert |
Company Profile |
SEC
News |
Chart |
Request a new note
C
A
S
I |
SMPL
-
NASDAQ
Simply Good Foods Co
Food-Confectionery
|
$35.43
|
+0.02
0.06% |
$35.75
|
222,366
67.75% of 50 DAV
50 DAV is 328,200
|
$38.50
-7.97%
|
12/28/2020
|
$30.40
|
PP = $31.44
|
|
MB = $33.01
|
Most Recent Note - 10/12/2021 5:39:46 PM
G - Consolidating just above its 50 DMA line ($35.37). Its Relative Strength Rating has slumped to 78. Recent low ($33.55 on 9/20/21) and 200 DMA line define important support where more damaging losses would raise greater concerns. Fundamentals remain strong. See the latest FSU analysis for more details and a new annotated graph.
>>> FEATURED STOCK ARTICLE : Consolidating Just Above 50-Day Moving Average Line - 10/12/2021 |
View all notes |
Set NEW NOTE alert |
Company Profile |
SEC
News |
Chart |
Request a new note
C
A
S
I |
WDAY
-
NYSE
Workday Inc Cl A
Computer Sftwr-Enterprse
|
$257.19
|
+3.52
1.39% |
$260.48
|
1,164,116
75.63% of 50 DAV
50 DAV is 1,539,300
|
$282.77
-9.05%
|
9/7/2021
|
$275.69
|
PP = $282.87
|
|
MB = $297.01
|
Most Recent Note - 10/12/2021 5:45:44 PM
Y - Consolidating above its 50 DMA line ($254). Any violation of the 50 DMA line and recent lows ($246) would raise greater concerns. Faces resistance due to overhead supply up to the $278 level after trading higher for the past month. Fundamentals remain strong.
>>> FEATURED STOCK ARTICLE : Gap Up and Recent Gains Challenge All-Time High - 9/7/2021 |
View all notes |
Set NEW NOTE alert |
Company Profile |
SEC
News |
Chart |
Request a new note
C
A
S
I |
CTLT
-
NYSE
Catalent Inc
DRUGS - Biotechnology
|
$128.63
|
+0.10
0.08% |
$129.76
|
407,039
45.53% of 50 DAV
50 DAV is 894,000
|
$142.64
-9.82%
|
8/25/2021
|
$128.72
|
PP = $127.78
|
|
MB = $134.17
|
Most Recent Note - 10/11/2021 4:52:39 PM
Y - Volume totals have been cooling. Sputtering below Its 50 DMA line ($130) and testing prior highs in the $124-127 area which define important near-term support to watch. Fundamentals remain strong.
>>> FEATURED STOCK ARTICLE : Found Support Near Prior High While Consolidating - 10/8/2021 |
View all notes |
Set NEW NOTE alert |
Company Profile |
SEC
News |
Chart |
Request a new note
C
A
S
I |
MEDP
-
NASDAQ
Medpace Holdings Inc
Medical-Research Eqp/Svc
|
$182.74
|
-1.64
-0.89% |
$185.17
|
109,055
65.42% of 50 DAV
50 DAV is 166,700
|
$199.04
-8.19%
|
9/10/2021
|
$196.32
|
PP = $196.22
|
|
MB = $206.03
|
Most Recent Note - 10/11/2021 4:55:46 PM
Y - Quietly slumped from near its 52-week high with a loss today on light volume testing its 50 DMA line ($184.63). More damaging losses would raise concerns. Highlighted in yellow with pivot point cited based on its 4/26/21 high plus 10 cents in the 9/10/21 mid-day report. Subsequent gains and strong close above the pivot point backed by at least +40% above average volume may trigger a technical buy signal.
>>> FEATURED STOCK ARTICLE : Negative Reversal Indicative of Distributional Pressure - 9/10/2021 |
View all notes |
Set NEW NOTE alert |
Company Profile |
SEC
News |
Chart |
Request a new note
C
A
S
I |
Symbol/Exchange
Company Name
Industry Group |
PRICE |
CHANGE
(%Change) |
Day High |
Volume
(% DAV)
(% 50 day avg vol) |
52 Wk Hi
% From Hi |
Featured
Date |
Price
Featured |
Pivot Featured |
|
Max Buy |
JEF
-
NYSE
Jefferies Financial Grp
Finance-Invest Bnk/Bkrs
|
$40.44
|
+0.03
0.07% |
$40.77
|
2,058,867
119.77% of 50 DAV
50 DAV is 1,719,000
|
$40.94
-1.22%
|
6/28/2021
|
$31.81
|
PP = $34.42
|
|
MB = $36.14
|
Most Recent Note - 10/11/2021 12:35:18 PM
G - Posting a 7th consecutive gain today for another new all-time high. Its 50 DMA line ($36.43) defines important near-term support to watch on pullbacks. Reported Aug '21 quarterly earnings +713% on +70% sales revenues versus the year ago period.
>>> FEATURED STOCK ARTICLE : Perched at 52-week High With Earnings News Due - 9/29/2021 |
View all notes |
Set NEW NOTE alert |
Company Profile |
SEC
News |
Chart |
Request a new note
C
A
S
I |
AVTR
-
NYSE
Avantor Inc
Medical-Research Eqp/Svc
|
$37.15
|
-3.33
-8.23% |
$39.10
|
11,385,934
313.92% of 50 DAV
50 DAV is 3,627,000
|
$44.37
-16.27%
|
6/10/2021
|
$32.94
|
PP = $34.09
|
|
MB = $35.79
|
Most Recent Note - 10/12/2021 12:00:13 PM
G - Gapped down today violating its 50 DMA line ($40.39) and also undercutting the recent low ($39.24 on 10/01/21) with a damaging volume-driven loss triggering technical sell signals. Completed a Secondary Offering on 9/13/21 while perched at its all-time high, very extended from any sound base.
>>> FEATURED STOCK ARTICLE : Pulled Back Finding Support Near 50-Day Moving Average - 10/11/2021 |
View all notes |
Set NEW NOTE alert |
Company Profile |
SEC
News |
Chart |
Request a new note
C
A
S
I |
MIME
-
NASDAQ
Mimecast Limited
Computer Sftwr-Security
|
$62.90
|
+0.70
1.13% |
$63.41
|
338,668
34.07% of 50 DAV
50 DAV is 994,000
|
$71.45
-11.97%
|
8/2/2021
|
$56.12
|
PP = $59.58
|
|
MB = $62.56
|
Most Recent Note - 10/12/2021 5:42:21 PM
G - Recently slumped below its 50 DMA line ($64.27) toward prior highs in the $59 area defining near-term support to watch. Fundamentals remain strong. A rebound above the 50 DMA line is needed for its outlook to improve.
>>> FEATURED STOCK ARTICLE : Consolidating After Getting Extended from Previous Base Noted - 9/21/2021 |
View all notes |
Set NEW NOTE alert |
Company Profile |
SEC
News |
Chart |
Request a new note
C
A
S
I |
|
|
|
THESE ARE NOT BUY RECOMMENDATIONS!
Comments contained in the body of this report are technical
opinions only. The material herein has been obtained
from sources believed to be reliable and accurate, however,
its accuracy and completeness cannot be guaranteed.
This site is not an investment advisor, hence it does
not endorse or recommend any securities or other investments.
Any recommendation contained in this report may not
be suitable for all investors and it is not to be deemed
an offer or solicitation on our part with respect to
the purchase or sale of any securities. All trademarks,
service marks and trade names appearing in this report
are the property of their respective owners, and are
likewise used for identification purposes only.
This report is a service available
only to active Paid Premium Members.
You may opt-out of receiving report notifications
at any time. Questions or comments may be submitted
by writing to Premium Membership Services 665 S.E. 10 Street, Suite 201 Deerfield Beach, FL 33441-5634 or by calling 1-800-965-8307
or 954-785-1121.
|
|
|