You are not logged in.
This means you
CAN ONLY VIEW reports that were published prior to Monday, March 31, 2025.
You
MUST UPGRADE YOUR MEMBERSHIP if you want to see any current reports.
AFTER MARKET UPDATE - FRIDAY, OCTOBER 29TH, 2021
Previous After Market Report Next After Market Report >>>
|
|
|
|
DOW |
+89.08 |
35,819.56 |
+0.25% |
|
Volume |
1,130,721,652 |
+29% |
|
Volume |
5,252,134,300 |
-6% |
|
NASDAQ |
+50.27 |
15,498.39 |
+0.33% |
|
Advancers |
1,599 |
49% |
|
Advancers |
2,244 |
50% |
|
S&P 500 |
+8.96 |
4,605.38 |
+0.19% |
|
Decliners |
1,675 |
51% |
|
Decliners |
2,203 |
50% |
|
Russell 2000 |
-0.79 |
2,297.19 |
-0.03% |
|
52 Wk Highs |
155 |
|
|
52 Wk Highs |
192 |
|
|
S&P 600 |
-2.25 |
1,376.46 |
-0.16% |
|
52 Wk Lows |
46 |
|
|
52 Wk Lows |
87 |
|
|
 |
Major Indices Rose With Better Leadership
Kenneth J. Gruneisen - Passed the CAN SLIM® Master's Exam
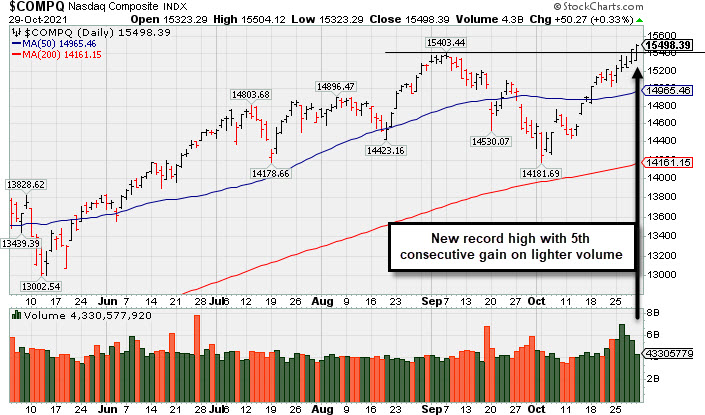
The S&P 500 surpassed the 4,600 level for the first time, up 0.2%. The Nasdaq Composite rose 0.3% to its own all-time high. Both benchmarks posted their strongest monthly performances since November 2020 (up 6.9% and 7.3%, respectively) on weekly gains of 1.3% and 2.7%. The Dow added 89 points to a fresh peak, with its five-day increase of 0.4% enough to notch its largest monthly advance since March (+5.8%). The volume totals reported were mixed, higher than the prior session on the NYSE and lighter on the Nasdaq exchange. Advancers and decliners were evenly mixed on the NYSE and on the Nasdaq exchange. There were 84 high-ranked companies from the Leaders List that hit new 52-week highs and were listed on the BreakOuts Page versus 71 on the prior session. New 52-week highs totals expanded and outnumbered new 52-week lows on the NYSE and on the Nasdaq exchange. The major indices (M criteria) are in a confirmed uptrend. Investors are reminded to only make proper new buys as per the fundamental and technical rules of the fact-based investment system.
PICTURED: The Nasdaq Composite Index posted a 5th consecutive gain on lighter volume and hit a new record high.
U.S. stocks finished at records on Friday, with the major averages logging their fourth straight weekly advance to cap their best October since 2015. Earnings were in focus, with Amazon (AMZN -2.15%) down on a disappointing profit tally, flagging headwinds related to supply chain disruptions and labor shortages. Apple (AAPL -1.81%) fell as supply chain problems hampered iPhone production. In other corporate news, Pfizer (PFE +1.30%) rose after the FDA approved the use of its COVID-19 vaccine in young children.
Treasuries strengthened, with the yield on the 10-year note down two basis points to 1.55%. The U.S. Treasury yield curve flattened significantly in October, with the two-year note yield spiking 19 basis points to 0.48% as market participants priced in a faster pace of monetary policy tightening by the Federal Reserve. In commodities, WTI crude rose 0.6% to $83.28/barrel, capping an 11% monthly gain. The U.S. dollar surged 0.9% for its biggest uptick since June.
On the data front, personal spending rose in September, though personal income declined during the period. Separately, the core PCE deflator (the Fed’s preferred proxy for inflation) reflected a 3.6% year-over-year advance last month, matching August’s three-decade peak. |
 Kenneth J. Gruneisen started out as a licensed stockbroker in August 1987, a couple of months prior to the historic stock market crash that took the Dow Jones Industrial Average down -22.6% in a single day. He has published daily fact-based fundamental and technical analysis on high-ranked stocks online for two decades. Through FACTBASEDINVESTING.COM, Kenneth provides educational articles, news, market commentary, and other information regarding proven investment systems that work in good times and bad.
Comments contained in the body of this report are technical opinions only and are not necessarily those of Gruneisen Growth Corp. The material herein has been obtained from sources believed to be reliable and accurate, however, its accuracy and completeness cannot be guaranteed. Our firm, employees, and customers may effect transactions, including transactions contrary to any recommendation herein, or have positions in the securities mentioned herein or options with respect thereto. Any recommendation contained in this report may not be suitable for all investors and it is not to be deemed an offer or solicitation on our part with respect to the purchase or sale of any securities. |
|
 |
Retail, Financial, and Commodity-Linked Groups Fell
Kenneth J. Gruneisen - Passed the CAN SLIM® Master's Exam
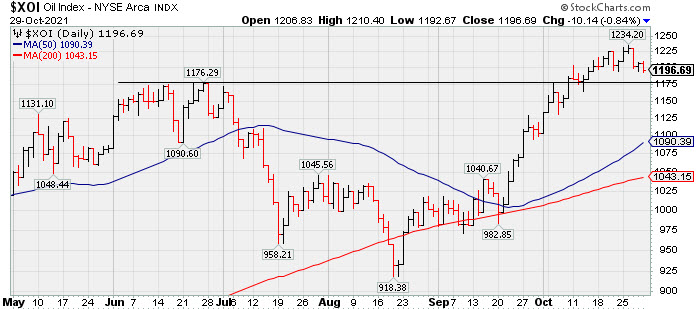
The Retail Index ($RLX -0.90%), Broker/Dealer Index ($XBD -0.92%), and Bank Index ($BKX -0.62%) suffered unanimous losses that weighed on the major averages on Friday. The Semiconductor Index ($SOX +0.36%) and Networking Index ($NWX +0.15%) both posted small gains while the Biotech Index ($BTK +0.15%) ended slightly in the red. Commodity-linked groups also had a negative bias as the Gold & Silver Index ($XAU -2.91%), Oil Services Index ($OSX -2.89%), and Integrated Oil Index ($XOI -0.84%) each lost ground.
PICTURED: The Integrated Oil Index ($XOI -0.84%) has been consolidating after rallying above its June high. It found support near its 200-day moving average (DMA) line in recent months.
| Oil Services |
$OSX |
60.51 |
-1.80 |
-2.89% |
+36.50% |
| Integrated Oil |
$XOI |
1,196.71 |
-10.12 |
-0.84% |
+51.01% |
| Semiconductor |
$SOX |
3,451.27 |
+12.44 |
+0.36% |
+23.46% |
| Networking |
$NWX |
836.44 |
+1.29 |
+0.15% |
+16.64% |
| Broker/Dealer |
$XBD |
491.52 |
-4.59 |
-0.92% |
+30.17% |
| Retail |
$RLX |
4,131.78 |
-37.67 |
-0.90% |
+15.96% |
| Gold & Silver |
$XAU |
129.61 |
-3.89 |
-2.91% |
-10.11% |
| Bank |
$BKX |
138.64 |
-0.86 |
-0.62% |
+41.60% |
| Biotech |
$BTK |
5,676.90 |
+8.78 |
+0.15% |
-1.08% |
|
|
|
 |
Latest Quarter Raised Fundamental Concerns
Kenneth J. Gruneisen - Passed the CAN SLIM® Master's Exam
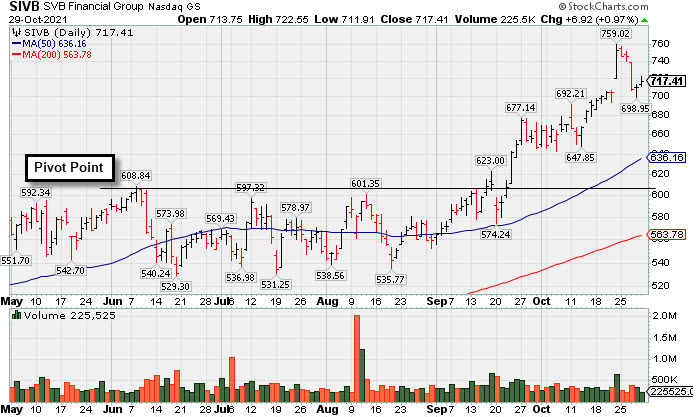
S V B Financial Group (SIVB +$6.91 or +0.97% to $717.40) is very extended from the previously noted base. Recently it reported Sep '21 quarterly earnings -14% on +43% sales revenues versus the year ago period, below the +25% minimum earnings guideline (C criteria), raising fundamental concerns. Its 50-day moving average (DMA) line ($636) defines important near-term support to watch on pullbacks.
Its Earnings Per Share Rating has slumped to 85. Jun '21 quarterly earnings rose +106% on +69% sales revenues versus the year ago period, but that capped a streak of 4 strong comparisons above the +25% minimum guideline (C criteria) of the fact-based investment system's guidelines. It has a great annual earnings history (A criteria).
SIVB completed new Public Offerings on 8/11/21 and on 3/24/21. It was last shown in this FSU section on 9/28/21 with an annotated graph under the headline, "Pullback After 5 Straight Gains into New High Territory". The number of top-rated funds owning its shares rose from 761 in Mar '17 to 1,864 in Sep '21, a reassuring sign concerning the I criteria. Its current Up/Down Volume Ratio of 1.9 is an unbiased indication its shares have been under slight accumulation over the past 50 days. It currently has a Timeliness rating of B and a Sponsorship Rating of A. There are only 56.4 million shares outstanding (S criteria) which can contribute to greater price volatility in the event of institutional buying or selling. |
|
|
Color Codes Explained :
Y - Better candidates highlighted by our
staff of experts.
G - Previously featured
in past reports as yellow but may no longer be buyable under the
guidelines.
***Last / Change / Volume data in this table is the closing quote data***
Symbol/Exchange
Company Name
Industry Group |
PRICE |
CHANGE
(%Change) |
Day High |
Volume
(% DAV)
(% 50 day avg vol) |
52 Wk Hi
% From Hi |
Featured
Date |
Price
Featured |
Pivot Featured |
|
Max Buy |
 SIVB
-
NASDAQ
SIVB
-
NASDAQ
S V B Financial Group
BANKING - Regional - Pacific Banks
|
$717.40
|
+6.91
0.97% |
$722.55
|
354,260
100.36% of 50 DAV
50 DAV is 353,000
|
$759.02
-5.48%
|
8/6/2021
|
$589.70
|
PP = $608.94
|
|
MB = $639.39
|
 Most Recent Note - 10/29/2021 4:38:20 PM
G - Very extended from the previously noted base, it pulled back this week. Weakness came after it reported Sep '21 quarterly earnings -14% on +43% sales revenues versus the year ago period, below the +25% minimum earnings guideline (C criteria) raising fundamental concerns. Its 50 DMA line ($636) defines important near-term support to watch. Completed a new Public Offering on 8/11/21. See the latest FSU analysis for more details and a new annotated graph.
>>> FEATURED STOCK ARTICLE : Latest Quarter Raised Fundamental Concerns - 10/29/2021 |
View all notes |
Set NEW NOTE alert |
Company Profile |
SEC
News |
Chart |
Request a new note
C
A
S
I |
BLDR
-
NYSE
Builders Firstsource Inc
Bldg-Constr Prds/Misc
|
$58.27
|
+0.03
0.05% |
$58.48
|
1,461,752
80.85% of 50 DAV
50 DAV is 1,808,000
|
$60.51
-3.70%
|
8/12/2021
|
$52.38
|
PP = $54.09
|
|
MB = $56.79
|
Most Recent Note - 10/26/2021 5:25:53 PM
G - Pulled back after touching another new all-time high today, marking only its 2nd loss in the span of 16 sessions. Its 50 DMA line and prior highs in the $54 area define important near-term support to watch on pullbacks. Fundamentals remain strong.
>>> FEATURED STOCK ARTICLE : Sputtering After Wedging to New Highs - 10/1/2021 |
View all notes |
Set NEW NOTE alert |
Company Profile |
SEC
News |
Chart |
Request a new note
C
A
S
I |
KFRC
-
NASDAQ
Kforce Inc
Comml Svcs-Staffing
|
$64.76
|
+0.34
0.53% |
$65.25
|
67,015
65.06% of 50 DAV
50 DAV is 103,000
|
$69.00
-6.14%
|
9/10/2021
|
$59.53
|
PP = $64.48
|
|
MB = $67.70
|
Most Recent Note - 10/27/2021 6:26:10 PM
Y - Suffered a 4th consecutive small loss on light volume, testing support near prior highs in the $64 area. Fundamentals remain strong. Its 50 DMA line ($61.48) defines additional near-term support to watch.
>>> FEATURED STOCK ARTICLE : Pulling Back Near Prior Highs Following Technical Breakout - 10/15/2021 |
View all notes |
Set NEW NOTE alert |
Company Profile |
SEC
News |
Chart |
Request a new note
C
A
S
I |
GNRC
-
NYSE
Generac Hldgs Inc
Electrical-Power/Equipmt
|
$498.56
|
-4.96
-0.99% |
$503.50
|
649,194
108.02% of 50 DAV
50 DAV is 601,000
|
$510.53
-2.34%
|
8/30/2021
|
$449.36
|
PP = $457.10
|
|
MB = $479.96
|
Most Recent Note - 10/27/2021 6:12:45 PM
G - Color code is changed to green after it posted a gain above its "max buy" level today with +30% above average volume. Disciplined investors may noted that a gain and close above the pivot point must be backed by at least +40% above average volume to trigger a proper technical buy signal.
>>> FEATURED STOCK ARTICLE : Prior Lows Define Near-Term Support After 50 DMA Violation - 10/6/2021 |
View all notes |
Set NEW NOTE alert |
Company Profile |
SEC
News |
Chart |
Request a new note
C
A
S
I |
CAMT
-
NASDAQ
Camtek Ltd
ELECTRONICS - Scientific and Technical Instrum
|
$38.87
|
+0.53
1.38% |
$38.92
|
192,305
121.71% of 50 DAV
50 DAV is 158,000
|
$46.01
-15.52%
|
8/4/2021
|
$39.67
|
PP = $40.57
|
|
MB = $42.60
|
Most Recent Note - 10/27/2021 12:23:19 PM
G - Violating its 50 DMA line ($40.43) with a big volume-driven loss today raising concerns. Weak action came after it reported Sep '21 quarterly earnings +150% versus the year ago period. Volume and volatility often increase near earnings news. The prior low ($34.68 on 8/17/21) defines the next important near-term support to watch. A rebound above the 50 DMA line is needed for its outlook to improve. Fundamentals remain strong.
>>> FEATURED STOCK ARTICLE : Fell Below Prior High and Violated 50-Day Moving Average - 10/5/2021 |
View all notes |
Set NEW NOTE alert |
Company Profile |
SEC
News |
Chart |
Request a new note
C
A
S
I |
Symbol/Exchange
Company Name
Industry Group |
PRICE |
CHANGE
(%Change) |
Day High |
Volume
(% DAV)
(% 50 day avg vol) |
52 Wk Hi
% From Hi |
Featured
Date |
Price
Featured |
Pivot Featured |
|
Max Buy |
PKI
-
NYSE
Perkinelmer Inc
ELECTRONICS - Scientific and Technical Instrum
|
$176.89
|
-0.44
-0.25% |
$178.24
|
574,216
94.61% of 50 DAV
50 DAV is 606,900
|
$192.00
-7.87%
|
8/18/2021
|
$181.07
|
PP = $188.50
|
|
MB = $197.93
|
Most Recent Note - 10/27/2021 6:15:00 PM
G - Pulled back today after rebounding near its 50 DMA line which may act as resistance. Subsequent gains above the 50 DMA line ($179.38) are needed for its outlook to improve. Its Relative Strength Rating has slumped to 75, below the 80+ minimum guideline for buy candidates. Fundamentals remain strong.
>>> FEATURED STOCK ARTICLE : Rebound Above 50 DMA Line Needed to Help Outlook Improve - 10/19/2021 |
View all notes |
Set NEW NOTE alert |
Company Profile |
SEC
News |
Chart |
Request a new note
C
A
S
I |
AMD
-
NASDAQ
Advanced Micro Devices
ELECTRONICS - Semiconductor - Broad Line
|
$120.16
|
-1.00
-0.83% |
$122.57
|
40,878,748
90.33% of 50 DAV
50 DAV is 45,255,000
|
$128.08
-6.18%
|
10/27/2021
|
$124.91
|
PP = $122.59
|
|
MB = $128.72
|
Most Recent Note - 10/27/2021 6:07:20 PM
Y - There was a "negative reversal" today for a loss on heavy volume after hitting a new high following 5 consecutive gains. It was highlighted yellow with pivot point cited based on its 8/04/21 high plus 10 cents in the earlier mid-day report. AMD found support near prior highs in the $99 area during its consolidation. Its current Relative Strength rating of 90 is above the 80+ minimum guideline for buy candidates. Fundamentals remain strong after it reported Sep '21 quarterly earnings +78% on +54% sales revenues versus the year ago period. See the latest FSU analysis for more details and a new annotated graph.
>>> FEATURED STOCK ARTICLE : Encountered Distributional Pressure After Reaching New High - 10/27/2021 |
View all notes |
Set NEW NOTE alert |
Company Profile |
SEC
News |
Chart |
Request a new note
C
A
S
I |
UMC
-
NYSE
United Microelectrnc Adr
ELECTRONICS - Semiconductor - Integrated Cir
|
$10.27
|
-0.32
-3.02% |
$10.37
|
12,644,023
163.11% of 50 DAV
50 DAV is 7,752,000
|
$12.62
-18.62%
|
8/5/2021
|
$11.62
|
PP = $11.38
|
|
MB = $11.95
|
Most Recent Note - 10/29/2021 4:41:17 PM
G - Pulled back today for a 2nd consecutive volume-driven loss. Reported Sep '21 quarterly earnings +100% on +30% sales revenues versus the year ago period. Found support above its 200 DMA line ($9.93). A rebound above the 50 DMA line ($11.18) still is needed for its outlook to improve. Volume and volatility often increase near earnings news. See the latest FSU analysis for more details and an annotated graph.
>>> FEATURED STOCK ARTICLE : Earnings News Due From Taiwan-Based Semiconductor Firm - 10/26/2021 |
View all notes |
Set NEW NOTE alert |
Company Profile |
SEC
News |
Chart |
Request a new note
C
A
S
I |
BRKS
-
NASDAQ
Brooks Automation
ELECTRONICS - Semiconductor Equipment and Mate
|
$116.46
|
+2.81
2.47% |
$116.53
|
477,704
80.42% of 50 DAV
50 DAV is 594,000
|
$114.21
1.97%
|
9/20/2021
|
$101.21
|
PP = $108.82
|
|
MB = $114.26
|
Most Recent Note - 10/28/2021 4:52:00 PM
Y - Gapped up and hit a new high today with near average volume, not above average volume indicative of great institutional buying demand. Pivot point cited was based on its 4/27/21 high plus 10 cents. It has been repeatedly noted - "Subsequent gains above the pivot point or prior highs backed by at least 40% above average volume may trigger a convincing technical buy signal."
>>> FEATURED STOCK ARTICLE : 5th Quiet Gain Has Brooks Perched Near Prior Highs - 10/20/2021 |
View all notes |
Set NEW NOTE alert |
Company Profile |
SEC
News |
Chart |
Request a new note
C
A
S
I |
ENTG
-
NASDAQ
Entegris Inc
ELECTRONICS - Semiconductor Equipment and Mate
|
$140.78
|
+2.07
1.49% |
$140.93
|
668,944
88.02% of 50 DAV
50 DAV is 760,000
|
$139.26
1.09%
|
8/4/2021
|
$125.33
|
PP = $126.51
|
|
MB = $132.84
|
Most Recent Note - 10/27/2021 12:32:35 PM
G - Perched near its all-time high and consolidating above its "max buy" level. Its 50 DMA line ($124.73) defines near-term support to watch above the prior low ($118).
>>> FEATURED STOCK ARTICLE : Hit New Record High With Another Volume-Driven Gain - 10/22/2021 |
View all notes |
Set NEW NOTE alert |
Company Profile |
SEC
News |
Chart |
Request a new note
C
A
S
I |
Symbol/Exchange
Company Name
Industry Group |
PRICE |
CHANGE
(%Change) |
Day High |
Volume
(% DAV)
(% 50 day avg vol) |
52 Wk Hi
% From Hi |
Featured
Date |
Price
Featured |
Pivot Featured |
|
Max Buy |
CLFD
-
NASDAQ
Clearfield Inc
TELECOMMUNICATIONS - Cables / Satalite Equipment
|
$56.49
|
-0.58
-1.02% |
$57.76
|
111,787
129.98% of 50 DAV
50 DAV is 86,000
|
$57.20
-1.24%
|
7/23/2021
|
$40.23
|
PP = $43.74
|
|
MB = $45.93
|
Most Recent Note - 10/28/2021 4:53:38 PM
G -Hit yet another new all-time high with today's 3rd consecutive volume-driven gain, getting very extended from the previously noted base. Its 50 DMA line ($47.39) and prior highs in the $46 area define near-term support where damaging losses may trigger technical sell signals. Due to report Sep '21 quarterly results on 11/04/21.
>>> FEATURED STOCK ARTICLE : Extended From Prior Base After Latest Rally - 10/18/2021 |
View all notes |
Set NEW NOTE alert |
Company Profile |
SEC
News |
Chart |
Request a new note
C
A
S
I |
TGH
-
NYSE
Textainer Group Holdings
TRANSPORTATION - Logistics
|
$39.29
|
-1.04
-2.58% |
$40.14
|
448,394
103.08% of 50 DAV
50 DAV is 435,000
|
$40.44
-2.84%
|
10/7/2021
|
$36.97
|
PP = $36.80
|
|
MB = $38.64
|
Most Recent Note - 10/28/2021 4:42:30 PM
G - Color code is changed to green as it hit yet another new 52-week high and rallied above its "max buy" level with today's big gain backed by near average volume. Its 50 DMA line ($34.81) defines important near-term support to watch. Fundamentals remain strong.
>>> FEATURED STOCK ARTICLE : Perched Near High With Strong Fundamentals - 10/7/2021 |
View all notes |
Set NEW NOTE alert |
Company Profile |
SEC
News |
Chart |
Request a new note
C
A
S
I |
ENPH
-
NASDAQ
Enphase Energy Inc
Energy-Solar
|
$231.50
|
+7.04
3.14% |
$237.00
|
4,013,162
185.28% of 50 DAV
50 DAV is 2,166,000
|
$229.04
1.07%
|
10/28/2021
|
$218.00
|
PP = $229.14
|
|
MB = $240.60
|
Most Recent Note - 10/29/2021 12:52:01 PM
Y - Hit a new 52-week high with today's early gain. Color code was changed to yellow with pivot point cited based on its 2/10/21 high plus 10 cents when highlighted in the prior mid-day report. Challenged its 52-week high with 2 consecutive volume-driven gains after a considerable gap up and it was noted - "Subsequent gains above the pivot point backed by at least +40% above average volume may trigger a technical buy signal. Reported very strong sales revenues and earnings increases in quarterly comparisons through Sep '21 versus the year ago periods, satisfying the C criteria. Strong annual earnings since FY '18 after years of losses."
>>> FEATURED STOCK ARTICLE : Enphase is Challenging its All-Time High With Volume-Driven Gains - 10/28/2021 |
View all notes |
Set NEW NOTE alert |
Company Profile |
SEC
News |
Chart |
Request a new note
C
A
S
I |
SMPL
-
NASDAQ
Simply Good Foods Co
Food-Confectionery
|
$39.65
|
-0.50
-1.25% |
$40.04
|
325,043
91.05% of 50 DAV
50 DAV is 357,000
|
$40.30
-1.61%
|
10/25/2021
|
$38.30
|
PP = $38.60
|
|
MB = $40.53
|
Most Recent Note - 10/28/2021 4:50:00 PM
Y - Hit another new 52-week high with today's gain approaching its "max buy" level. Volume-driven gains this week triggered a new (or add-on) technical buy signal. Bullish action came after it reported Aug '21 quarterly earnings +45% on +17% sales revenues versus the year ago period. Its Relative Strength Rating has improved to 87. Found support above its 200 DMA line ($33.78) and recent low ($33.55 on 9/20/21).
>>> FEATURED STOCK ARTICLE : Consolidating Just Above 50-Day Moving Average Line - 10/12/2021 |
View all notes |
Set NEW NOTE alert |
Company Profile |
SEC
News |
Chart |
Request a new note
C
A
S
I |
WDAY
-
NYSE
Workday Inc Cl A
Computer Sftwr-Enterprse
|
$289.98
|
+3.24
1.13% |
$292.62
|
1,565,938
101.56% of 50 DAV
50 DAV is 1,541,900
|
$288.58
0.49%
|
9/7/2021
|
$275.69
|
PP = $282.87
|
|
MB = $297.01
|
Most Recent Note - 10/25/2021 5:14:24 PM
Y - Posted a gain today with average volume for a best-ever close and no resistance remains due to overhead supply. Its 50 DMA line ($261.82).defines near-term support to watch where a violation would raise concerns. Fundamentals remain strong.
>>> FEATURED STOCK ARTICLE : Rebounding From 50-Day Moving Average Toward Prior Highs - 10/13/2021 |
View all notes |
Set NEW NOTE alert |
Company Profile |
SEC
News |
Chart |
Request a new note
C
A
S
I |
Symbol/Exchange
Company Name
Industry Group |
PRICE |
CHANGE
(%Change) |
Day High |
Volume
(% DAV)
(% 50 day avg vol) |
52 Wk Hi
% From Hi |
Featured
Date |
Price
Featured |
Pivot Featured |
|
Max Buy |
CTLT
-
NYSE
"Catalent, Inc"
DRUGS - Biotechnology
|
$137.86
|
+2.36
1.74% |
$138.20
|
774,830
86.50% of 50 DAV
50 DAV is 895,800
|
$142.64
-3.35%
|
8/25/2021
|
$128.72
|
PP = $127.78
|
|
MB = $134.17
|
Most Recent Note - 10/26/2021 5:28:47 PM
Y - Posted a gain with higher volume today and closed back above its 50 DMA line ($132.56). Prior highs in the $124-127 area which define the next important near-term support to watch. Fundamentals remain strong. Due to report Sep '21 quarterly results on 11/02/21.
>>> FEATURED STOCK ARTICLE : Found Support Near Prior High While Consolidating - 10/8/2021 |
View all notes |
Set NEW NOTE alert |
Company Profile |
SEC
News |
Chart |
Request a new note
C
A
S
I |
MEDP
-
NASDAQ
Medpace Holdings Inc
Medical-Research Eqp/Svc
|
$226.55
|
+6.84
3.11% |
$227.25
|
191,325
104.55% of 50 DAV
50 DAV is 183,000
|
$219.92
3.01%
|
9/10/2021
|
$196.32
|
PP = $196.22
|
|
MB = $206.03
|
Most Recent Note - 10/29/2021 4:44:30 PM
G - Hit another new 52-week high and rallied further above its "max buy" level with today's big gain on average volume. Bullish action came after it reported Sep '21 earnings +18% on +28% sales revenues versus the year ago period, below the +25% minimum earnings guideline (C criteria), raising fundamental concerns. Prior highs in the $199 area define initial support above its 50 DMA line ($189).
>>> FEATURED STOCK ARTICLE : Found Prompt Support Near 50-Day Moving Average Line - 10/14/2021 |
View all notes |
Set NEW NOTE alert |
Company Profile |
SEC
News |
Chart |
Request a new note
C
A
S
I |
JEF
-
NYSE
Jefferies Financial Grp
Finance-Invest Bnk/Bkrs
|
$43.00
|
-0.02
-0.05% |
$43.43
|
1,799,071
96.93% of 50 DAV
50 DAV is 1,856,000
|
$43.60
-1.38%
|
6/28/2021
|
$31.81
|
PP = $34.42
|
|
MB = $36.14
|
Most Recent Note - 10/25/2021 5:10:33 PM
G - Very extended from any sound base, it posted a 17th consecutive gain today for another new all-time high. Its 50 DMA line ($37.86) defines important near-term support to watch on pullbacks. Reported Aug '21 quarterly earnings +713% on +70% sales revenues versus the year ago period.
>>> FEATURED STOCK ARTICLE : Perched at 52-week High With Earnings News Due - 9/29/2021 |
View all notes |
Set NEW NOTE alert |
Company Profile |
SEC
News |
Chart |
Request a new note
C
A
S
I |
AVTR
-
NYSE
Avantor Inc
Medical-Research Eqp/Svc
|
$40.40
|
+2.10
5.48% |
$41.31
|
7,634,959
188.89% of 50 DAV
50 DAV is 4,042,000
|
$44.37
-8.95%
|
6/10/2021
|
$32.94
|
PP = $34.09
|
|
MB = $35.79
|
Most Recent Note - 10/29/2021 12:27:42 PM
G - Gapped up today rebounding above its 50 DMA line helping its outlook improve. Bullish action came after it reported Sep '21 quarterly earnings +46% above the year ago period. Volume and volatility often increase near earnings news. Completed a Secondary Offering on 9/13/21. Resistance remains due to overhead supply up to the $44 level.
>>> FEATURED STOCK ARTICLE : Pulled Back Finding Support Near 50-Day Moving Average - 10/11/2021 |
View all notes |
Set NEW NOTE alert |
Company Profile |
SEC
News |
Chart |
Request a new note
C
A
S
I |
MIME
-
NASDAQ
Mimecast Limited
Computer Sftwr-Security
|
$75.44
|
+0.28
0.37% |
$76.71
|
1,005,649
106.31% of 50 DAV
50 DAV is 946,000
|
$75.46
-0.03%
|
10/18/2021
|
$68.17
|
PP = $71.55
|
|
MB = $75.13
|
Most Recent Note - 10/28/2021 4:40:35 PM
G - Color code is changed to green after today's big volume-driven gain for a new all-time high triggered a technical buy signal but it quickly rallied above its "max buy" level. Fundamentals remain strong. New pivot point cited was based on its 9/03/21 high plus 10 cents. Prior highs in the $71 area define initial support above its 50 DMA line ($66.64) .
>>> FEATURED STOCK ARTICLE : MIME Consolidating Less Than 4% Off High Building New Base - 10/21/2021 |
View all notes |
Set NEW NOTE alert |
Company Profile |
SEC
News |
Chart |
Request a new note
C
A
S
I |
Symbol/Exchange
Company Name
Industry Group |
PRICE |
CHANGE
(%Change) |
Day High |
Volume
(% DAV)
(% 50 day avg vol) |
52 Wk Hi
% From Hi |
Featured
Date |
Price
Featured |
Pivot Featured |
|
Max Buy |
ZD
-
NASDAQ
Ziff Davis Inc
Internet-Content
|
$128.27
|
-0.33
-0.26% |
$130.99
|
536,588
130.88% of 50 DAV
50 DAV is 410,000
|
$130.90
-2.01%
|
10/25/2021
|
$126.07
|
PP = $128.19
|
|
MB = $134.60
|
Most Recent Note - 10/25/2021 5:04:54 PM
Y - Perched within close striking distance of its 52-week high after today's 5th consecutive gain. Color code was changed to yellow with pivot point cited based on its 7/29/21 high plus 10 cents. A solid gain and close above the pivot point backed by at least +40% above average volume may trigger a technical buy signal. Quarterly and annual earnings (C and A criteria) history has been strong. See the latest FSU analysis for more details and a new annotated graph.
>>> FEATURED STOCK ARTICLE : Internet Content Firm Perched Near Prior High - 10/25/2021 |
View all notes |
Set NEW NOTE alert |
Company Profile |
SEC
News |
Chart |
Request a new note
C
A
S
I |
|
|
|
THESE ARE NOT BUY RECOMMENDATIONS!
Comments contained in the body of this report are technical
opinions only. The material herein has been obtained
from sources believed to be reliable and accurate, however,
its accuracy and completeness cannot be guaranteed.
This site is not an investment advisor, hence it does
not endorse or recommend any securities or other investments.
Any recommendation contained in this report may not
be suitable for all investors and it is not to be deemed
an offer or solicitation on our part with respect to
the purchase or sale of any securities. All trademarks,
service marks and trade names appearing in this report
are the property of their respective owners, and are
likewise used for identification purposes only.
This report is a service available
only to active Paid Premium Members.
You may opt-out of receiving report notifications
at any time. Questions or comments may be submitted
by writing to Premium Membership Services 665 S.E. 10 Street, Suite 201 Deerfield Beach, FL 33441-5634 or by calling 1-800-965-8307
or 954-785-1121.
|
|
|