You are not logged in.
This means you
CAN ONLY VIEW reports that were published prior to Monday, March 31, 2025.
You
MUST UPGRADE YOUR MEMBERSHIP if you want to see any current reports.
AFTER MARKET UPDATE - FRIDAY, OCTOBER 8TH, 2021
Previous After Market Report Next After Market Report >>>
|
|
|
|
DOW |
-8.69 |
34,746.25 |
-0.03% |
|
Volume |
713,067,020 |
-19% |
|
Volume |
3,542,051,900 |
-10% |
|
NASDAQ |
-74.48 |
14,579.54 |
-0.51% |
|
Advancers |
1,439 |
45% |
|
Advancers |
1,788 |
41% |
|
S&P 500 |
-8.42 |
4,391.34 |
-0.19% |
|
Decliners |
1,746 |
55% |
|
Decliners |
2,603 |
59% |
|
Russell 2000 |
-17.00 |
2,233.09 |
-0.76% |
|
52 Wk Highs |
125 |
|
|
52 Wk Highs |
99 |
|
|
S&P 600 |
-8.04 |
1,358.65 |
-0.59% |
|
52 Wk Lows |
52 |
|
|
52 Wk Lows |
138 |
|
|
We have repeatedly posted this notice that the direction of the major averages (M) has shifted to a "market correction" and new buying is to be avoided. Greater caution is now warranted until a new confirmed rally with a follow-through day is noted.
|
 |
Major Indices Quietly Ended Lower
Kenneth J. Gruneisen - Passed the CAN SLIM® Master's Exam
The S&P 500 dipped 0.2%, but notched its best week since August (+0.8%). The broad benchmark is back within 3.3% of its most recent September 2 peak. The Dow slipped 8 points, still capping a 1.2% weekly advance, its strongest five-day stretch since June. The tech-heavy Nasdaq Composite shed 0.5%, eking out a 0.1% gain on the week. The volume totals reported were lighter than the prior session on the NYSE and on the Nasdaq exchange. Breadth was negative as decliners led advancers by a 6-5 margin on the NYSE and by 13-9 on the Nasdaq exchange. There were 56 high-ranked companies from the Leaders List that hit new 52-week highs and were listed on the BreakOuts Page versus the total of 64 on the prior session. New 52-week highs outnumbered new 52-week lows on the NYSE, but new lows still outnumbered new highs on the Nasdaq exchange. The major indices (M criteria) have come under greater pressure and earned the label of a "market correction". During corrections investors are reminded to avoid new buying decisions and to sell weakening stocks on a case-by-case basis, reducing exposure and raising cash as per the rules of the fact-based investment system.
PICTURED: The Nasdaq Composite Index pulled back on Friday which marked Day 4 of its rally attempt. Disciplined investors following the fact-based investment system will wait to make new buys only after a proper follow-through day - which requires a solid gain from at least one of the major averages backed by higher volume and coupled with an expansion in the number of stocks hitting new highs. U.S. stocks finished modestly lower on Friday as investors weighed a mixed monthly jobs report. On the data front, the Labor Department revealed that the U.S. economy added just 194,000 jobs in September, well below estimates of a 500,000 increase. However, the prior month’s addition was upwardly revised, while the unemployment rate dropped to a pandemic low of 4.8% from August’s 5.2% figure. Wage inflation increased 4.6% year-over-year during the period, up from the previous 4% year-over-year pace. Despite the headline number miss, the consensus on Wall Street seemed to suggest the Fed would likely move forward with tapering plans in November, given the strength of the underlying components of the report.
Treasuries declined, with the yield on the 10-year note climbing three basis points to 1.60% for the first time since June. In commodities, WTI crude jumped 1.6% to $79.54/barrel, posting its seventh consecutive weekly gain--its longest such winning streak since a run ending last December. Nine of 11 S&P 500 sectors closed in negative territory, with only the Energy and Financials groups advancing. Meanwhile, in Washington, the U.S. Senate voted in favor of legislation that would lift the debt ceiling into early December. |
 Kenneth J. Gruneisen started out as a licensed stockbroker in August 1987, a couple of months prior to the historic stock market crash that took the Dow Jones Industrial Average down -22.6% in a single day. He has published daily fact-based fundamental and technical analysis on high-ranked stocks online for two decades. Through FACTBASEDINVESTING.COM, Kenneth provides educational articles, news, market commentary, and other information regarding proven investment systems that work in good times and bad.
Comments contained in the body of this report are technical opinions only and are not necessarily those of Gruneisen Growth Corp. The material herein has been obtained from sources believed to be reliable and accurate, however, its accuracy and completeness cannot be guaranteed. Our firm, employees, and customers may effect transactions, including transactions contrary to any recommendation herein, or have positions in the securities mentioned herein or options with respect thereto. Any recommendation contained in this report may not be suitable for all investors and it is not to be deemed an offer or solicitation on our part with respect to the purchase or sale of any securities. |
|
 |
Financial and Commodity-Linked Groups Rose
Kenneth J. Gruneisen - Passed the CAN SLIM® Master's Exam
Financial groups had a positive influence on the major averages as the Bank Index ($BKX +0.74%) and Broker/Dealer Index ($XBD +0.21%) bot rose, but the Retail Index ($RLX -0.47%) edged lower. The tech sector had a negative bias as the Semiconductor Index ($SOX -0.86%) and Networking Index ($NWX -0.60%) both outpaced the Biotech Index ($BTK -0.18%) to the downside. Meanwhile, commodity-linked groups rose as the Oil Services Index ($OSX +2.42%) and Integrated Oil Index ($XOI +2.65%) both posted solid gains that outpaced the Gold & Silver Index ($XAU +0.65%).
PICTURED: The Retail Index ($RLX -0.47%) recently found support after it slumped to its 200-day moving average (DMA) line.
| Oil Services |
$OSX |
61.73 |
+1.46 |
+2.42% |
+39.25% |
| Integrated Oil |
$XOI |
1,184.07 |
+30.56 |
+2.65% |
+49.41% |
| Semiconductor |
$SOX |
3,246.27 |
-28.21 |
-0.86% |
+16.12% |
| Networking |
$NWX |
832.71 |
-5.06 |
-0.60% |
+16.12% |
| Broker/Dealer |
$XBD |
488.62 |
+1.01 |
+0.21% |
+29.40% |
| Retail |
$RLX |
3,917.62 |
-18.33 |
-0.47% |
+9.94% |
| Gold & Silver |
$XAU |
123.75 |
+0.79 |
+0.65% |
-14.17% |
| Bank |
$BKX |
136.38 |
+1.00 |
+0.74% |
+39.29% |
| Biotech |
$BTK |
5,601.29 |
-10.13 |
-0.18% |
-2.40% |
|
|
|
 |
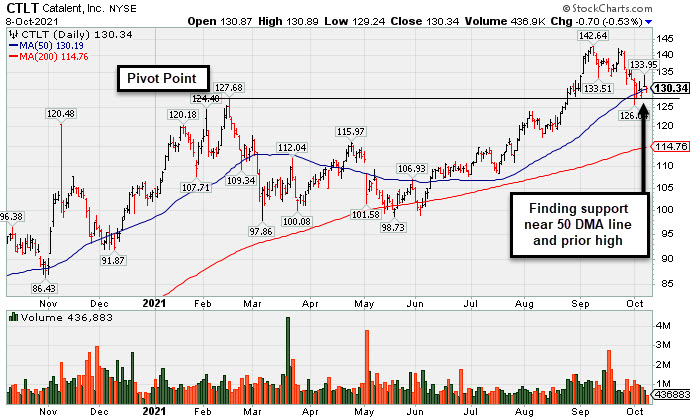
Found Support Near Prior High While Consolidating
Kenneth J. Gruneisen - Passed the CAN SLIM® Master's Exam
Catalent Inc (CTLT -$0.70 or -0.53% to $130.34) has been consolidating after volume-driven losses, trading near its 50-day moving average (DMA) line ($130.19) and above prior highs in the $124-127 area which define important near-term support to watch.
CTLT finished strong after highlighted in yellow with pivot point cited based on its 2/16/21 high plus 10 cents in the 8/25/21 mid-day report (read here). Volume was +69% above average behind today's 5th consecutive gain while hitting a new all-time high (N criteria). The gain and close above its pivot point clinched a technical buy signal. It was shown in greater detail that evening with an annotated graph under the headline, "Strong Gain Triggered Technical Buy Signal".
Fundamentals remain strong. The company reported its Jun '21 quarterly earnings rose +29% on +25% sales revenues versus the year ago period, its 5th quarterly comparison above the +25% minimum earnings guideline (C criteria). Annual earnings (A criteria) history has been steadily improving after a downturn in FY '16. It has a 90 Earnings Per Share Rating.
The company hails from the Medical - Research Equipment/Services group which is currently ranked 22nd on the 197 Industry Groups list (L criteria). The number of top-rated funds owning its shares rose from 1,121 in Sep '20 to 1,455 in Jun '21, a reassuring sign concerning the I criteria. The current Up/Down Volume Ratio of 1.4 is an unbiased indication its shares have ben under accumulatio over the past 50 days. It has a Timeliness Rating of B and Sponsorship Rating of B.
There are 171 million shares outstanding (S criteria). CTLT completed new Public Offerings in Jun '20, Feb '20, Jul '18, and Sep '17. Completed Secondary Offerings in Jun and Sep '16, and Mar and Jun '15. Completed its $21 IPO on 7/31/14.
|
|
|
Color Codes Explained :
Y - Better candidates highlighted by our
staff of experts.
G - Previously featured
in past reports as yellow but may no longer be buyable under the
guidelines.
***Last / Change / Volume data in this table is the closing quote data***
Symbol/Exchange
Company Name
Industry Group |
PRICE |
CHANGE
(%Change) |
Day High |
Volume
(% DAV)
(% 50 day avg vol) |
52 Wk Hi
% From Hi |
Featured
Date |
Price
Featured |
Pivot Featured |
|
Max Buy |
 SIVB
-
NASDAQ
SIVB
-
NASDAQ
S V B Financial Group
BANKING - Regional - Pacific Banks
|
$670.49
|
+4.93
0.74% |
$670.95
|
316,303
80.08% of 50 DAV
50 DAV is 395,000
|
$679.00
-1.25%
|
8/6/2021
|
$589.70
|
PP = $608.94
|
|
MB = $639.39
|
Most Recent Note - 10/5/2021 5:55:58 PM
G - Hovering near its all-time high, extended from the previously noted base. Prior highs in the $608 area define initial support to watch above its 50 DMA line ($589). Completed a new Public Offering on 8/11/21.
>>> FEATURED STOCK ARTICLE : Pullback After 5 Straight Gains into New High Territory - 9/28/2021 |
View all notes |
Set NEW NOTE alert |
Company Profile |
SEC
News |
Chart |
Request a new note
C
A
S
I |
BLDR
-
NYSE
Builders Firstsource Inc
Bldg-Constr Prds/Misc
|
$55.09
|
+0.34
0.62% |
$55.98
|
1,568,690
75.42% of 50 DAV
50 DAV is 2,080,000
|
$55.54
-0.81%
|
8/12/2021
|
$52.38
|
PP = $54.09
|
|
MB = $56.79
|
Most Recent Note - 10/7/2021 5:49:13 PM
Y - Posted a 3rd consecutive gain today with light volume for its 2nd best ever close. Its 50 DMA line ($51.50) defines important near term support. Subsequent gains for new highs backed by at least +40% above average volume may clinch a proper technical buy signal. Fundamentals remain strong.
>>> FEATURED STOCK ARTICLE : Sputtering After Wedging to New Highs - 10/1/2021 |
View all notes |
Set NEW NOTE alert |
Company Profile |
SEC
News |
Chart |
Request a new note
C
A
S
I |
CROX
-
NASDAQ
Crocs Inc
CONSUMER NON-DURABLES - Textile - Apparel Footwear
|
$130.40
|
-9.14
-6.55% |
$140.14
|
2,411,554
178.77% of 50 DAV
50 DAV is 1,349,000
|
$163.18
-20.09%
|
6/14/2021
|
$112.64
|
PP = $110.01
|
|
MB = $115.51
|
 Most Recent Note - 10/8/2021 5:43:53 PM
Suffered a big loss with above average volume and closed near the session low, violating the prior low ($132.60) raising more serious concerns and triggering a worrisome technical sell signal. It will be dropped from the Featured Stocks list tonight. A rebound above the 50 DMA line ($144) is needed for its outlook to improve.
>>> FEATURED STOCK ARTICLE : Streak of Losses Violated 50-day Moving Average Line - 10/4/2021 |
View all notes |
Set NEW NOTE alert |
Company Profile |
SEC
News |
Chart |
Request a new note
C
A
S
I |
KFRC
-
NASDAQ
Kforce Inc
Comml Svcs-Staffing
|
$67.48
|
+0.37
0.55% |
$68.26
|
103,312
89.06% of 50 DAV
50 DAV is 116,000
|
$67.22
0.39%
|
9/10/2021
|
$59.53
|
PP = $64.48
|
|
MB = $67.70
|
Most Recent Note - 10/7/2021 12:28:12 PM
Y - Hitting a new all-time high with today's gain. Previously noted - "Subsequent gains above its pivot point backed by at least +40% above average volume are needed to trigger a proper technical buy signal. Fundamentals are strong."
>>> FEATURED STOCK ARTICLE : Staffing Firm Still Faces Some Overhead Supply - 9/13/2021 |
View all notes |
Set NEW NOTE alert |
Company Profile |
SEC
News |
Chart |
Request a new note
C
A
S
I |
GNRC
-
NYSE
Generac Hldgs Inc
Electrical-Power/Equipmt
|
$406.78
|
-10.80
-2.59% |
$418.62
|
376,561
56.63% of 50 DAV
50 DAV is 665,000
|
$466.92
-12.88%
|
8/30/2021
|
$449.36
|
PP = $457.10
|
|
MB = $479.96
|
Most Recent Note - 10/7/2021 5:59:02 PM
G - Rebounded toward its 50 DMA line ($423.46) which may act as resistance after damaging volume-driven losses. A rebound above the 50 DMA line is needed for its outlook to improve. See the latest FSU analysis for more details and an annotated graph.
>>> FEATURED STOCK ARTICLE : Prior Lows Define Near-Term Support After 50 DMA Violation - 10/6/2021 |
View all notes |
Set NEW NOTE alert |
Company Profile |
SEC
News |
Chart |
Request a new note
C
A
S
I |
Symbol/Exchange
Company Name
Industry Group |
PRICE |
CHANGE
(%Change) |
Day High |
Volume
(% DAV)
(% 50 day avg vol) |
52 Wk Hi
% From Hi |
Featured
Date |
Price
Featured |
Pivot Featured |
|
Max Buy |
CAMT
-
NASDAQ
Camtek Ltd
ELECTRONICS - Scientific and Technical Instrum
|
$38.40
|
-1.57
-3.93% |
$40.13
|
106,318
61.81% of 50 DAV
50 DAV is 172,000
|
$46.01
-16.54%
|
8/4/2021
|
$39.67
|
PP = $40.57
|
|
MB = $42.60
|
Most Recent Note - 10/8/2021 5:45:55 PM
G - Slumped today with light volume as it fell below its 50 DMA line ($39.97). The prior low ($34.68 on 8/17/21) defines the next important near-term support to watch. Fundamentals remain strong.
>>> FEATURED STOCK ARTICLE : Fell Below Prior High and Violated 50-Day Moving Average - 10/5/2021 |
View all notes |
Set NEW NOTE alert |
Company Profile |
SEC
News |
Chart |
Request a new note
C
A
S
I |
PKI
-
NYSE
Perkinelmer Inc
ELECTRONICS - Scientific and Technical Instrum
|
$169.97
|
-1.03
-0.60% |
$172.90
|
471,917
67.29% of 50 DAV
50 DAV is 701,300
|
$192.00
-11.47%
|
8/18/2021
|
$181.07
|
PP = $188.50
|
|
MB = $197.93
|
Most Recent Note - 10/6/2021 5:11:34 PM
G - A rebound above the 50 DMA line ($182.65) is needed for its outlook to improve after damaging losses. Its Relative Strength Rating has slumped to 79. Fundamentals remain strong.
>>> FEATURED STOCK ARTICLE : Stalled But Holding Ground After Recent "3 Weeks Tight" - 9/17/2021 |
View all notes |
Set NEW NOTE alert |
Company Profile |
SEC
News |
Chart |
Request a new note
C
A
S
I |
UMC
-
NYSE
United Microelectrnc Adr
ELECTRONICS - Semiconductor - Integrated Cir
|
$10.75
|
-0.21
-1.92% |
$10.87
|
6,289,869
83.88% of 50 DAV
50 DAV is 7,499,000
|
$12.62
-14.82%
|
8/5/2021
|
$11.62
|
PP = $11.38
|
|
MB = $11.95
|
Most Recent Note - 10/7/2021 5:55:19 PM
G - Gapped up today rebounding toward the 50 DMA line ($11.24) which may act as resistance. Gains above the 50 DMA line are needed for its outlook to improve.
>>> FEATURED STOCK ARTICLE : Consolidating Above 50-day Moving Average Near "Max Buy" Level - 9/27/2021 |
View all notes |
Set NEW NOTE alert |
Company Profile |
SEC
News |
Chart |
Request a new note
C
A
S
I |
BRKS
-
NASDAQ
Brooks Automation
ELECTRONICS - Semiconductor Equipment and Mate
|
$99.48
|
-3.19
-3.11% |
$102.76
|
418,051
64.51% of 50 DAV
50 DAV is 648,000
|
$110.40
-9.89%
|
9/20/2021
|
$101.21
|
PP = $108.82
|
|
MB = $114.26
|
Most Recent Note - 10/7/2021 5:57:10 PM
Y - Posted a gain today with higher volume. Perched within striking distance of its 52-week high hit last week. Pivot point cited was based on its 4/27/21 high plus 10 cents. Subsequent gains above the pivot point backed by at least 40% above average volume may trigger a convincing technical buy signal.
>>> FEATURED STOCK ARTICLE : Rallying Near High After Brief Consolidation Below 200 DMA Line - 9/20/2021 |
View all notes |
Set NEW NOTE alert |
Company Profile |
SEC
News |
Chart |
Request a new note
C
A
S
I |
ENTG
-
NASDAQ
Entegris Inc
ELECTRONICS - Semiconductor Equipment and Mate
|
$121.18
|
-0.57
-0.47% |
$122.25
|
626,555
90.02% of 50 DAV
50 DAV is 696,000
|
$135.99
-10.89%
|
8/4/2021
|
$125.33
|
PP = $126.51
|
|
MB = $132.84
|
Most Recent Note - 10/4/2021 5:41:12 PM
G - Violated its 50 DMA line ($121.75) wit today's volume driven loss triggering a technical sell signal. Only a prompt rebound above the 50 DMA line would help its outlook improve. Its prior low and 200 DMA line define the next important support in the $109 area.
>>> FEATURED STOCK ARTICLE : Hit New High and Rose Above its Max Buy Level - 9/23/2021 |
View all notes |
Set NEW NOTE alert |
Company Profile |
SEC
News |
Chart |
Request a new note
C
A
S
I |
Symbol/Exchange
Company Name
Industry Group |
PRICE |
CHANGE
(%Change) |
Day High |
Volume
(% DAV)
(% 50 day avg vol) |
52 Wk Hi
% From Hi |
Featured
Date |
Price
Featured |
Pivot Featured |
|
Max Buy |
CLFD
-
NASDAQ
Clearfield Inc
TELECOMMUNICATIONS - Cables / Satalite Equipment
|
$49.95
|
-1.89
-3.65% |
$53.14
|
125,048
150.66% of 50 DAV
50 DAV is 83,000
|
$53.52
-6.67%
|
7/23/2021
|
$40.23
|
PP = $43.74
|
|
MB = $45.93
|
Most Recent Note - 10/8/2021 12:24:53 PM
G - Perched at its 52-week high today following 6 consecutive gains, extended from the previously noted base. Found prompt support near its 50 DMA line ($44.46) after testing the prior low ($42.34) where more damaging losses may trigger technical sell signals. Fundamentals remain strong.
>>> FEATURED STOCK ARTICLE : Quietly Consolidating Near All-Time High - 9/14/2021 |
View all notes |
Set NEW NOTE alert |
Company Profile |
SEC
News |
Chart |
Request a new note
C
A
S
I |
TGH
-
NYSE
Textainer Group Holdings
TRANSPORTATION - Logistics
|
$36.08
|
-0.14
-0.39% |
$36.72
|
298,422
67.52% of 50 DAV
50 DAV is 442,000
|
$37.88
-4.75%
|
10/7/2021
|
$36.97
|
PP = $36.80
|
|
MB = $38.64
|
Most Recent Note - 10/7/2021 5:44:35 PM
Y - Finished near the session low today after churning above average volume. Color code was changed to yellow in the earlier mid-day report with pivot point cited based on its 9/29/21 high while building on a cup-with-handle base. It is perched within close striking distance of its 52-week high after finding prompt support near its 50 DMA line ($33.73) during an orderly consolidation. Subsequent gains above the pivot point backed by at least +40% above average volume may trigger a proper technical buy signal. Reported Jun '21 quarterly earnings +429% on +29% sales revenues versus the year ago period, its 5th strong earnings comparison. Sales revenues growth has been improving and accelerating in the 3 latest quarterly comparisons after years of sub-par and negative comparisons, not a match with with regard to the fact-based investment system's fundamental guidelines. Annual earnings (A criteria) history has been strong after a downturn and loss in FY '16. See the latest FSU analysis for more details and an annotated graph.
>>> FEATURED STOCK ARTICLE : Perched Near High With Strong Fundamentals - 10/7/2021 |
View all notes |
Set NEW NOTE alert |
Company Profile |
SEC
News |
Chart |
Request a new note
C
A
S
I |
SMPL
-
NASDAQ
Simply Good Foods Co
Food-Confectionery
|
$35.49
|
-0.72
-1.99% |
$36.16
|
163,225
49.02% of 50 DAV
50 DAV is 333,000
|
$38.50
-7.82%
|
12/28/2020
|
$30.40
|
PP = $31.44
|
|
MB = $33.01
|
Most Recent Note - 10/6/2021 5:13:28 PM
G - Posted a quiet gain today, rebounding above its 50 DMA line ($35.50) which recently has acted as resistance. Its Relative strength Rating has slumped to 79. Recent low ($33.55 on 9/20/21) and 200 DMA line define important support where more damaging losses would raise greater concerns. Fundamentals remain strong.
>>> FEATURED STOCK ARTICLE : Still Lingering Below 50-Day Moving Average Line - 8/30/2021 |
View all notes |
Set NEW NOTE alert |
Company Profile |
SEC
News |
Chart |
Request a new note
C
A
S
I |
WDAY
-
NYSE
Workday Inc Cl A
Computer Sftwr-Enterprse
|
$255.90
|
-1.96
-0.76% |
$259.47
|
940,564
60.81% of 50 DAV
50 DAV is 1,546,800
|
$282.77
-9.50%
|
9/7/2021
|
$275.69
|
PP = $282.87
|
|
MB = $297.01
|
Most Recent Note - 10/5/2021 5:58:40 PM
Y - Consolidating near its 50 DMA line ($252). More damaging losses below recent lows ($246) would raise greater concerns. Faces resistance due to overhead supply up to the $278 level after trading higher for the past month. Fundamentals remain strong.
>>> FEATURED STOCK ARTICLE : Gap Up and Recent Gains Challenge All-Time High - 9/7/2021 |
View all notes |
Set NEW NOTE alert |
Company Profile |
SEC
News |
Chart |
Request a new note
C
A
S
I |
CTLT
-
NYSE
Catalent Inc
DRUGS - Biotechnology
|
$130.34
|
-0.70
-0.53% |
$130.89
|
436,683
47.88% of 50 DAV
50 DAV is 912,000
|
$142.64
-8.62%
|
8/25/2021
|
$128.72
|
PP = $127.78
|
|
MB = $134.17
|
Most Recent Note - 10/5/2021 5:53:02 PM
Y - Color code is changed to yellow while consolidating after volume-driven losses. Its 50 DMA line ($129) and prior highs in the $124-127 area define important near-term support to watch. Fundamentals remain strong.
>>> FEATURED STOCK ARTICLE : Found Support Near Prior High While Consolidating - 10/8/2021 |
View all notes |
Set NEW NOTE alert |
Company Profile |
SEC
News |
Chart |
Request a new note
C
A
S
I |
Symbol/Exchange
Company Name
Industry Group |
PRICE |
CHANGE
(%Change) |
Day High |
Volume
(% DAV)
(% 50 day avg vol) |
52 Wk Hi
% From Hi |
Featured
Date |
Price
Featured |
Pivot Featured |
|
Max Buy |
MEDP
-
NASDAQ
Medpace Holdings Inc
Medical-Research Eqp/Svc
|
$188.80
|
-4.36
-2.26% |
$193.23
|
105,408
63.12% of 50 DAV
50 DAV is 167,000
|
$199.04
-5.14%
|
9/10/2021
|
$196.32
|
PP = $196.22
|
|
MB = $206.03
|
Most Recent Note - 10/7/2021 6:05:57 PM
Y - Still hovering near its 52-week high. Found prompt support near its 50 DMA line ($184). Highlighted in yellow with pivot point cited based on its 4/26/21 high plus 10 cents in the 9/10/21 mid-day report. Subsequent gains and strong close above the pivot point backed by at least +40% above average volume may trigger a technical buy signal.
>>> FEATURED STOCK ARTICLE : Negative Reversal Indicative of Distributional Pressure - 9/10/2021 |
View all notes |
Set NEW NOTE alert |
Company Profile |
SEC
News |
Chart |
Request a new note
C
A
S
I |
JEF
-
NYSE
Jefferies Financial Grp
Finance-Invest Bnk/Bkrs
|
$39.89
|
+0.61
1.55% |
$40.19
|
1,967,590
118.03% of 50 DAV
50 DAV is 1,667,000
|
$39.61
0.71%
|
6/28/2021
|
$31.81
|
PP = $34.42
|
|
MB = $36.14
|
Most Recent Note - 10/7/2021 6:02:40 PM
G - Posted a 5th consecutive gain today for a new all-time high. Its 50 DMA line ($36.16) defines important near-term support to watch on pullbacks. Reported Aug '21 quarterly earnings +713% on +70% sales revenues versus the year ago period.
>>> FEATURED STOCK ARTICLE : Perched at 52-week High With Earnings News Due - 9/29/2021 |
View all notes |
Set NEW NOTE alert |
Company Profile |
SEC
News |
Chart |
Request a new note
C
A
S
I |
AVTR
-
NYSE
Avantor Inc
Medical-Research Eqp/Svc
|
$40.58
|
-0.40
-0.98% |
$41.34
|
1,417,092
37.58% of 50 DAV
50 DAV is 3,771,000
|
$44.37
-8.54%
|
6/10/2021
|
$32.94
|
PP = $34.09
|
|
MB = $35.79
|
Most Recent Note - 10/7/2021 6:04:18 PM
G - Volume totals have been cooling while still finding support above its 50 DMA line ($40.26). A damaging violation may trigger a technical sell signal. Completed a Secondary Offering on 9/13/21 while perched at its all-time high, very extended from any sound base.
>>> FEATURED STOCK ARTICLE : Steady Progress Made Since Featured - 8/27/2021 |
View all notes |
Set NEW NOTE alert |
Company Profile |
SEC
News |
Chart |
Request a new note
C
A
S
I |
MIME
-
NASDAQ
Mimecast Limited
Computer Sftwr-Security
|
$62.82
|
-1.50
-2.33% |
$64.50
|
273,218
27.19% of 50 DAV
50 DAV is 1,005,000
|
$71.45
-12.08%
|
8/2/2021
|
$56.12
|
PP = $59.58
|
|
MB = $62.56
|
Most Recent Note - 10/5/2021 5:54:29 PM
G - Consolidating near its 50 DMA line ($63.50) and above prior highs in the $59 area defining near-term support to watch. Fundamentals remain strong.
>>> FEATURED STOCK ARTICLE : Consolidating After Getting Extended from Previous Base Noted - 9/21/2021 |
View all notes |
Set NEW NOTE alert |
Company Profile |
SEC
News |
Chart |
Request a new note
C
A
S
I |
|
|
|
THESE ARE NOT BUY RECOMMENDATIONS!
Comments contained in the body of this report are technical
opinions only. The material herein has been obtained
from sources believed to be reliable and accurate, however,
its accuracy and completeness cannot be guaranteed.
This site is not an investment advisor, hence it does
not endorse or recommend any securities or other investments.
Any recommendation contained in this report may not
be suitable for all investors and it is not to be deemed
an offer or solicitation on our part with respect to
the purchase or sale of any securities. All trademarks,
service marks and trade names appearing in this report
are the property of their respective owners, and are
likewise used for identification purposes only.
This report is a service available
only to active Paid Premium Members.
You may opt-out of receiving report notifications
at any time. Questions or comments may be submitted
by writing to Premium Membership Services 665 S.E. 10 Street, Suite 201 Deerfield Beach, FL 33441-5634 or by calling 1-800-965-8307
or 954-785-1121.
|
|
|