You are not logged in.
This means you
CAN ONLY VIEW reports that were published prior to Friday, April 18, 2025.
You
MUST UPGRADE YOUR MEMBERSHIP if you want to see any current reports.
AFTER MARKET UPDATE - MONDAY, OCTOBER 11TH, 2021
Previous After Market Report Next After Market Report >>>
|
|
|
|
DOW |
-250.19 |
34,496.06 |
-0.72% |
|
Volume |
701,966,215 |
-2% |
|
Volume |
3,476,958,700 |
-2% |
|
NASDAQ |
-93.34 |
14,486.20 |
-0.64% |
|
Advancers |
1,366 |
43% |
|
Advancers |
1,648 |
38% |
|
S&P 500 |
-30.29 |
4,361.05 |
-0.69% |
|
Decliners |
1,792 |
57% |
|
Decliners |
2,634 |
61% |
|
Russell 2000 |
-12.44 |
2,220.65 |
-0.56% |
|
52 Wk Highs |
153 |
|
|
52 Wk Highs |
101 |
|
|
S&P 600 |
-9.06 |
1,349.59 |
-0.67% |
|
52 Wk Lows |
52 |
|
|
52 Wk Lows |
162 |
|
|
We have repeatedly posted this notice that the direction of the major averages (M) has shifted to a "market correction" and new buying is to be avoided. Greater caution is now warranted until a new confirmed rally with a follow-through day is noted.
|
 |
Major Indices Slumped With Lighter Volume Totals
Kenneth J. Gruneisen - Passed the CAN SLIM® Master's Exam
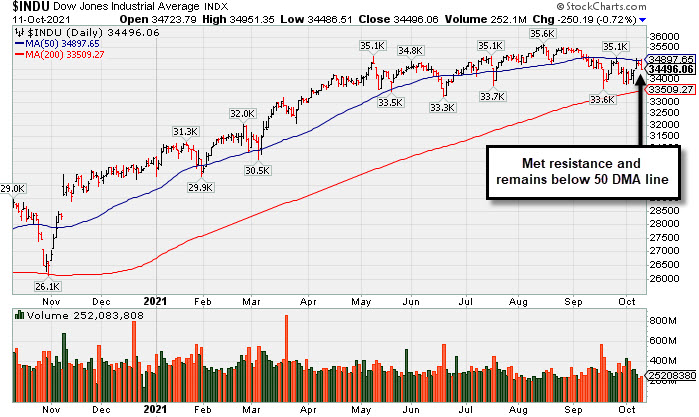
The Dow reversed an earlier gain to lose 250 points on the heels of its best week since June (+1.2%). The S&P 500 also gave up an early session advance to slip 0.7%. The Nasdaq Composite fell 0.6%. The volume totals reported were lighter than the prior session on the NYSE and on the Nasdaq exchange. Breadth was negative as decliners led advancers by a 9-7 margin on the NYSE and by 5-3 on the Nasdaq exchange. There were 66 high-ranked companies from the Leaders List that hit new 52-week highs and were listed on the BreakOuts Page versus the total of 56 on the prior session. New 52-week highs outnumbered new 52-week lows on the NYSE, but new lows still outnumbered new highs on the Nasdaq exchange. The major indices (M criteria) have come under greater pressure and earned the label of a "market correction". During corrections investors are reminded to avoid new buying decisions and to sell weakening stocks on a case-by-case basis, reducing exposure and raising cash as per the rules of the fact-based investment system.
PICTURED: The Dow Jones Industrial Average Index pulled back on Monday which marked Day 7 of its rally attempt. Disciplined investors following the fact-based investment system will wait to make new buys only after a proper follow-through day - which requires a solid gain from at least one of the major averages backed by higher volume and coupled with an expansion in the number of stocks hitting new highs. U.S. stocks finished lower on Monday as investors weighed another jump in oil prices and eyed this week’s corporate earnings calendar. Bloomberg noted that trading volume was roughly 10% lower than the last month’s average.
Nine of 11 S&P 500 sectors closed in negative territory, with Communication Services leading the decline following several analyst downgrades of some media companies. Financials turned lower ahead of earnings from Wall Street’s biggest banks this week. Real Estate shares bucked the downtrend, while Materials eked out a gain amid strength in industrial metals, with copper futures closing at its highest level in three weeks. In corporate news, Southwest Airlines (LUV -4.17%) fell after the air carrier was forced to cancel over 1,800 flights this past weekend due to a confluence of factors.
In commodities, WTI crude rose 1.4%, settling above $80.00/barrel for the first time since October 2014 as a global energy crunch persists. Elsewhere, bitcoin breached the $57,000 mark for the first time since May. Meanwhile, the U.S. bond market was closed today due to Columbus Day. The yield on the 10-year note settled at a four-month high of 1.60% on Friday (October 8) following a mixed jobs report. On the data front this week, Wednesday’s consumer price inflation (CPI) release and Friday’s retail sales report will likely headline the slate. |
 Kenneth J. Gruneisen started out as a licensed stockbroker in August 1987, a couple of months prior to the historic stock market crash that took the Dow Jones Industrial Average down -22.6% in a single day. He has published daily fact-based fundamental and technical analysis on high-ranked stocks online for two decades. Through FACTBASEDINVESTING.COM, Kenneth provides educational articles, news, market commentary, and other information regarding proven investment systems that work in good times and bad.
Comments contained in the body of this report are technical opinions only and are not necessarily those of Gruneisen Growth Corp. The material herein has been obtained from sources believed to be reliable and accurate, however, its accuracy and completeness cannot be guaranteed. Our firm, employees, and customers may effect transactions, including transactions contrary to any recommendation herein, or have positions in the securities mentioned herein or options with respect thereto. Any recommendation contained in this report may not be suitable for all investors and it is not to be deemed an offer or solicitation on our part with respect to the purchase or sale of any securities. |
|
 |
Financial, Retail, and Tech Indexes Fell
Kenneth J. Gruneisen - Passed the CAN SLIM® Master's Exam
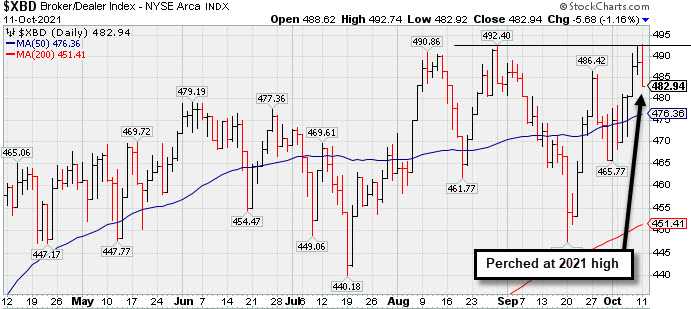
The Broker/Dealer Index ($XBD -1.17%), Bank Index ($BKX -1.05%), and Retail Index ($RLX -0.77%) each lost ground and weighed on the major averages. The Semiconductor Index ($SOX -0.77%) and Biotech Index ($BTK -0.57%) both lost ground while the Networking Index ($NWX +0.16%) eked out a tiny gain. The Oil Services Index ($OSX +0.79%) posted a small gain while the Integrated Oil Index ($XOI -0.16%) and Gold & Silver Index ($XAU -0.36%) both lost ground.
PICTURED: The Broker/Dealer Index ($XBD -1.17%) recently found support above its 200-day moving average (DMA) line and rallied back to its 2021 high.
| Oil Services |
$OSX |
62.22 |
+0.49 |
+0.79% |
+40.35% |
| Integrated Oil |
$XOI |
1,182.19 |
-1.89 |
-0.16% |
+49.18% |
| Semiconductor |
$SOX |
3,221.23 |
-25.04 |
-0.77% |
+15.23% |
| Networking |
$NWX |
834.04 |
+1.34 |
+0.16% |
+16.30% |
| Broker/Dealer |
$XBD |
482.92 |
-5.71 |
-1.17% |
+27.89% |
| Retail |
$RLX |
3,887.61 |
-30.01 |
-0.77% |
+9.10% |
| Gold & Silver |
$XAU |
123.31 |
-0.44 |
-0.36% |
-14.48% |
| Bank |
$BKX |
134.95 |
-1.44 |
-1.05% |
+37.83% |
| Biotech |
$BTK |
5,569.49 |
-31.80 |
-0.57% |
-2.95% |
|
|
|
 |
Pulled Back Finding Support Near 50-Day Moving Average
Kenneth J. Gruneisen - Passed the CAN SLIM® Master's Exam
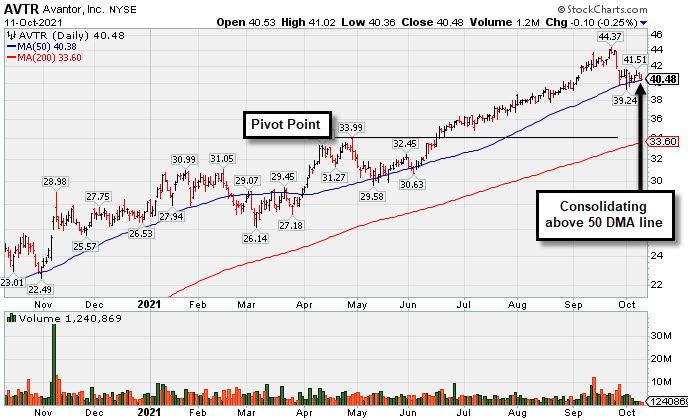
Avantor Inc (AVTR -$0.10 or -0.25% to $40.48) is still finding support at its 50-day moving average (DMA) line ($40.48). A damaging violation of the 50 DMA line and recent low ($39.24) may trigger technical sell signals. It completed a Secondary Offering on 9/13/21 while perched at its all-time high, very extended from any sound base.
AVTR has traded up as much as +34.7% since highlighted in the 6/10/21 mid-day report (read here) yellow with pivot point cited based on its 4/29/21 high plus 10 cents. It was last shown in this FSU section on 8/27/21 with an annotated graph included with additional analysis under the headline, "Steady Progress Made Since Featured". It has an Earnings Per Share Rating of 97 based on strong fundamentals. The Jun '21 quarter marked its 4th consecutive quarterly comparison with earnings above the year ago period by at least the +25% minimum guideline (C criteria). Annual earnings growth has been strong (A criteria).
Following its $14 IPO on 5/17/19 it completed Secondary Offerings on 5/21/20, 8/21/20 and 11/09/20. The high-ranked Medical-Research Eqp/Svc firm has seen the number of top-rated funds owning its shares rise from 562 in Jun '20 to 1,178 in Jun '21 a reassuring sign concerning the I criteria. Its current Up/Down Volume ratio of 1.7 is an unbiased indication its shares have been under accumulation over the past 50 days. It has a Timeliness Rating of A and a Sponsorship Rating of B.
|
|
|
Color Codes Explained :
Y - Better candidates highlighted by our
staff of experts.
G - Previously featured
in past reports as yellow but may no longer be buyable under the
guidelines.
***Last / Change / Volume data in this table is the closing quote data***
Symbol/Exchange
Company Name
Industry Group |
PRICE |
CHANGE
(%Change) |
Day High |
Volume
(% DAV)
(% 50 day avg vol) |
52 Wk Hi
% From Hi |
Featured
Date |
Price
Featured |
Pivot Featured |
|
Max Buy |
 SIVB
-
NASDAQ
SIVB
-
NASDAQ
S V B Financial Group
BANKING - Regional - Pacific Banks
|
$666.51
|
-3.98
-0.59% |
$692.21
|
365,840
92.15% of 50 DAV
50 DAV is 397,000
|
$679.00
-1.84%
|
8/6/2021
|
$589.70
|
PP = $608.94
|
|
MB = $639.39
|
Most Recent Note - 10/5/2021 5:55:58 PM
G - Hovering near its all-time high, extended from the previously noted base. Prior highs in the $608 area define initial support to watch above its 50 DMA line ($589). Completed a new Public Offering on 8/11/21.
>>> FEATURED STOCK ARTICLE : Pullback After 5 Straight Gains into New High Territory - 9/28/2021 |
View all notes |
Set NEW NOTE alert |
Company Profile |
SEC
News |
Chart |
Request a new note
C
A
S
I |
BLDR
-
NYSE
Builders Firstsource Inc
Bldg-Constr Prds/Misc
|
$55.20
|
+0.11
0.20% |
$56.00
|
1,093,827
52.66% of 50 DAV
50 DAV is 2,077,000
|
$55.98
-1.39%
|
8/12/2021
|
$52.38
|
PP = $54.09
|
|
MB = $56.79
|
Most Recent Note - 10/7/2021 5:49:13 PM
Y - Posted a 3rd consecutive gain today with light volume for its 2nd best ever close. Its 50 DMA line ($51.50) defines important near term support. Subsequent gains for new highs backed by at least +40% above average volume may clinch a proper technical buy signal. Fundamentals remain strong.
>>> FEATURED STOCK ARTICLE : Sputtering After Wedging to New Highs - 10/1/2021 |
View all notes |
Set NEW NOTE alert |
Company Profile |
SEC
News |
Chart |
Request a new note
C
A
S
I |
KFRC
-
NASDAQ
Kforce Inc
Comml Svcs-Staffing
|
$66.36
|
-1.12
-1.66% |
$69.00
|
75,822
64.81% of 50 DAV
50 DAV is 117,000
|
$68.26
-2.78%
|
9/10/2021
|
$59.53
|
PP = $64.48
|
|
MB = $67.70
|
Most Recent Note - 10/7/2021 12:28:12 PM
Y - Hitting a new all-time high with today's gain. Previously noted - "Subsequent gains above its pivot point backed by at least +40% above average volume are needed to trigger a proper technical buy signal. Fundamentals are strong."
>>> FEATURED STOCK ARTICLE : Staffing Firm Still Faces Some Overhead Supply - 9/13/2021 |
View all notes |
Set NEW NOTE alert |
Company Profile |
SEC
News |
Chart |
Request a new note
C
A
S
I |
GNRC
-
NYSE
Generac Hldgs Inc
Electrical-Power/Equipmt
|
$409.57
|
+2.79
0.69% |
$417.99
|
385,068
59.89% of 50 DAV
50 DAV is 643,000
|
$466.92
-12.28%
|
8/30/2021
|
$449.36
|
PP = $457.10
|
|
MB = $479.96
|
Most Recent Note - 10/7/2021 5:59:02 PM
G - Rebounded toward its 50 DMA line ($423.46) which may act as resistance after damaging volume-driven losses. A rebound above the 50 DMA line is needed for its outlook to improve. See the latest FSU analysis for more details and an annotated graph.
>>> FEATURED STOCK ARTICLE : Prior Lows Define Near-Term Support After 50 DMA Violation - 10/6/2021 |
View all notes |
Set NEW NOTE alert |
Company Profile |
SEC
News |
Chart |
Request a new note
C
A
S
I |
CAMT
-
NASDAQ
Camtek Ltd
ELECTRONICS - Scientific and Technical Instrum
|
$38.80
|
+0.40
1.04% |
$39.08
|
132,113
77.71% of 50 DAV
50 DAV is 170,000
|
$46.01
-15.67%
|
8/4/2021
|
$39.67
|
PP = $40.57
|
|
MB = $42.60
|
Most Recent Note - 10/8/2021 5:45:55 PM
G - Slumped today with light volume as it fell below its 50 DMA line ($39.97). The prior low ($34.68 on 8/17/21) defines the next important near-term support to watch. Fundamentals remain strong.
>>> FEATURED STOCK ARTICLE : Fell Below Prior High and Violated 50-Day Moving Average - 10/5/2021 |
View all notes |
Set NEW NOTE alert |
Company Profile |
SEC
News |
Chart |
Request a new note
C
A
S
I |
Symbol/Exchange
Company Name
Industry Group |
PRICE |
CHANGE
(%Change) |
Day High |
Volume
(% DAV)
(% 50 day avg vol) |
52 Wk Hi
% From Hi |
Featured
Date |
Price
Featured |
Pivot Featured |
|
Max Buy |
PKI
-
NYSE
Perkinelmer Inc
ELECTRONICS - Scientific and Technical Instrum
|
$168.59
|
-1.38
-0.81% |
$170.59
|
214,904
31.32% of 50 DAV
50 DAV is 686,100
|
$192.00
-12.19%
|
8/18/2021
|
$181.07
|
PP = $188.50
|
|
MB = $197.93
|
Most Recent Note - 10/6/2021 5:11:34 PM
G - A rebound above the 50 DMA line ($182.65) is needed for its outlook to improve after damaging losses. Its Relative Strength Rating has slumped to 79. Fundamentals remain strong.
>>> FEATURED STOCK ARTICLE : Stalled But Holding Ground After Recent "3 Weeks Tight" - 9/17/2021 |
View all notes |
Set NEW NOTE alert |
Company Profile |
SEC
News |
Chart |
Request a new note
C
A
S
I |
UMC
-
NYSE
United Microelectrnc Adr
ELECTRONICS - Semiconductor - Integrated Cir
|
$10.61
|
-0.14
-1.30% |
$10.83
|
5,543,794
76.23% of 50 DAV
50 DAV is 7,272,000
|
$12.62
-15.93%
|
8/5/2021
|
$11.62
|
PP = $11.38
|
|
MB = $11.95
|
Most Recent Note - 10/7/2021 5:55:19 PM
G - Gapped up today rebounding toward the 50 DMA line ($11.24) which may act as resistance. Gains above the 50 DMA line are needed for its outlook to improve.
>>> FEATURED STOCK ARTICLE : Consolidating Above 50-day Moving Average Near "Max Buy" Level - 9/27/2021 |
View all notes |
Set NEW NOTE alert |
Company Profile |
SEC
News |
Chart |
Request a new note
C
A
S
I |
BRKS
-
NASDAQ
Brooks Automation
ELECTRONICS - Semiconductor Equipment and Mate
|
$98.80
|
-0.68
-0.68% |
$100.72
|
315,341
48.66% of 50 DAV
50 DAV is 648,000
|
$110.40
-10.51%
|
9/20/2021
|
$101.21
|
PP = $108.82
|
|
MB = $114.26
|
Most Recent Note - 10/7/2021 5:57:10 PM
Y - Posted a gain today with higher volume. Perched within striking distance of its 52-week high hit last week. Pivot point cited was based on its 4/27/21 high plus 10 cents. Subsequent gains above the pivot point backed by at least 40% above average volume may trigger a convincing technical buy signal.
>>> FEATURED STOCK ARTICLE : Rallying Near High After Brief Consolidation Below 200 DMA Line - 9/20/2021 |
View all notes |
Set NEW NOTE alert |
Company Profile |
SEC
News |
Chart |
Request a new note
C
A
S
I |
ENTG
-
NASDAQ
Entegris Inc
ELECTRONICS - Semiconductor Equipment and Mate
|
$122.55
|
+1.37
1.13% |
$123.93
|
521,583
74.98% of 50 DAV
50 DAV is 695,600
|
$135.99
-9.88%
|
8/4/2021
|
$125.33
|
PP = $126.51
|
|
MB = $132.84
|
 Most Recent Note - 10/11/2021 4:50:38 PM
G - Finding prompt support near its 50 DMA line ($121.97) after damaging losses. Its prior low and 200 DMA line define the next important support in the $109 area.
>>> FEATURED STOCK ARTICLE : Hit New High and Rose Above its Max Buy Level - 9/23/2021 |
View all notes |
Set NEW NOTE alert |
Company Profile |
SEC
News |
Chart |
Request a new note
C
A
S
I |
CLFD
-
NASDAQ
Clearfield Inc
TELECOMMUNICATIONS - Cables / Satalite Equipment
|
$51.23
|
+1.28
2.56% |
$51.44
|
111,116
135.51% of 50 DAV
50 DAV is 82,000
|
$53.52
-4.28%
|
7/23/2021
|
$40.23
|
PP = $43.74
|
|
MB = $45.93
|
Most Recent Note - 10/11/2021 4:54:06 PM
G - Posted a gain with above average volume today. Perched at its 52-week high, extended from the previously noted base. Found prompt support near its 50 DMA line ($44.58) after testing the prior low ($42.34) where more damaging losses may trigger technical sell signals. Fundamentals remain strong.
>>> FEATURED STOCK ARTICLE : Quietly Consolidating Near All-Time High - 9/14/2021 |
View all notes |
Set NEW NOTE alert |
Company Profile |
SEC
News |
Chart |
Request a new note
C
A
S
I |
Symbol/Exchange
Company Name
Industry Group |
PRICE |
CHANGE
(%Change) |
Day High |
Volume
(% DAV)
(% 50 day avg vol) |
52 Wk Hi
% From Hi |
Featured
Date |
Price
Featured |
Pivot Featured |
|
Max Buy |
TGH
-
NYSE
Textainer Group Holdings
TRANSPORTATION - Logistics
|
$36.00
|
-0.08
-0.22% |
$36.50
|
220,719
50.05% of 50 DAV
50 DAV is 441,000
|
$37.88
-4.96%
|
10/7/2021
|
$36.97
|
PP = $36.80
|
|
MB = $38.64
|
Most Recent Note - 10/7/2021 5:44:35 PM
Y - Finished near the session low today after churning above average volume. Color code was changed to yellow in the earlier mid-day report with pivot point cited based on its 9/29/21 high while building on a cup-with-handle base. It is perched within close striking distance of its 52-week high after finding prompt support near its 50 DMA line ($33.73) during an orderly consolidation. Subsequent gains above the pivot point backed by at least +40% above average volume may trigger a proper technical buy signal. Reported Jun '21 quarterly earnings +429% on +29% sales revenues versus the year ago period, its 5th strong earnings comparison. Sales revenues growth has been improving and accelerating in the 3 latest quarterly comparisons after years of sub-par and negative comparisons, not a match with with regard to the fact-based investment system's fundamental guidelines. Annual earnings (A criteria) history has been strong after a downturn and loss in FY '16. See the latest FSU analysis for more details and an annotated graph.
>>> FEATURED STOCK ARTICLE : Perched Near High With Strong Fundamentals - 10/7/2021 |
View all notes |
Set NEW NOTE alert |
Company Profile |
SEC
News |
Chart |
Request a new note
C
A
S
I |
SMPL
-
NASDAQ
Simply Good Foods Co
Food-Confectionery
|
$35.41
|
-0.08
-0.23% |
$35.73
|
108,334
32.76% of 50 DAV
50 DAV is 330,700
|
$38.50
-8.03%
|
12/28/2020
|
$30.40
|
PP = $31.44
|
|
MB = $33.01
|
Most Recent Note - 10/6/2021 5:13:28 PM
G - Posted a quiet gain today, rebounding above its 50 DMA line ($35.50) which recently has acted as resistance. Its Relative strength Rating has slumped to 79. Recent low ($33.55 on 9/20/21) and 200 DMA line define important support where more damaging losses would raise greater concerns. Fundamentals remain strong.
>>> FEATURED STOCK ARTICLE : Still Lingering Below 50-Day Moving Average Line - 8/30/2021 |
View all notes |
Set NEW NOTE alert |
Company Profile |
SEC
News |
Chart |
Request a new note
C
A
S
I |
WDAY
-
NYSE
Workday Inc Cl A
Computer Sftwr-Enterprse
|
$253.67
|
-2.23
-0.87% |
$258.93
|
887,022
57.61% of 50 DAV
50 DAV is 1,539,700
|
$282.77
-10.29%
|
9/7/2021
|
$275.69
|
PP = $282.87
|
|
MB = $297.01
|
Most Recent Note - 10/5/2021 5:58:40 PM
Y - Consolidating near its 50 DMA line ($252). More damaging losses below recent lows ($246) would raise greater concerns. Faces resistance due to overhead supply up to the $278 level after trading higher for the past month. Fundamentals remain strong.
>>> FEATURED STOCK ARTICLE : Gap Up and Recent Gains Challenge All-Time High - 9/7/2021 |
View all notes |
Set NEW NOTE alert |
Company Profile |
SEC
News |
Chart |
Request a new note
C
A
S
I |
CTLT
-
NYSE
Catalent Inc
DRUGS - Biotechnology
|
$128.52
|
-1.82
-1.40% |
$130.19
|
260,298
28.73% of 50 DAV
50 DAV is 906,000
|
$142.64
-9.90%
|
8/25/2021
|
$128.72
|
PP = $127.78
|
|
MB = $134.17
|
Most Recent Note - 10/11/2021 4:52:39 PM
Y - Volume totals have been cooling. Sputtering below Its 50 DMA line ($130) and testing prior highs in the $124-127 area which define important near-term support to watch. Fundamentals remain strong.
>>> FEATURED STOCK ARTICLE : Found Support Near Prior High While Consolidating - 10/8/2021 |
View all notes |
Set NEW NOTE alert |
Company Profile |
SEC
News |
Chart |
Request a new note
C
A
S
I |
MEDP
-
NASDAQ
Medpace Holdings Inc
Medical-Research Eqp/Svc
|
$184.38
|
-4.42
-2.34% |
$189.33
|
82,487
49.39% of 50 DAV
50 DAV is 167,000
|
$199.04
-7.37%
|
9/10/2021
|
$196.32
|
PP = $196.22
|
|
MB = $206.03
|
Most Recent Note - 10/11/2021 4:55:46 PM
Y - Quietly slumped from near its 52-week high with a loss today on light volume testing its 50 DMA line ($184.63). More damaging losses would raise concerns. Highlighted in yellow with pivot point cited based on its 4/26/21 high plus 10 cents in the 9/10/21 mid-day report. Subsequent gains and strong close above the pivot point backed by at least +40% above average volume may trigger a technical buy signal.
>>> FEATURED STOCK ARTICLE : Negative Reversal Indicative of Distributional Pressure - 9/10/2021 |
View all notes |
Set NEW NOTE alert |
Company Profile |
SEC
News |
Chart |
Request a new note
C
A
S
I |
Symbol/Exchange
Company Name
Industry Group |
PRICE |
CHANGE
(%Change) |
Day High |
Volume
(% DAV)
(% 50 day avg vol) |
52 Wk Hi
% From Hi |
Featured
Date |
Price
Featured |
Pivot Featured |
|
Max Buy |
JEF
-
NYSE
Jefferies Financial Grp
Finance-Invest Bnk/Bkrs
|
$40.41
|
+0.52
1.30% |
$40.94
|
2,151,880
127.25% of 50 DAV
50 DAV is 1,691,000
|
$40.19
0.55%
|
6/28/2021
|
$31.81
|
PP = $34.42
|
|
MB = $36.14
|
Most Recent Note - 10/11/2021 12:35:18 PM
G - Posting a 7th consecutive gain today for another new all-time high. Its 50 DMA line ($36.43) defines important near-term support to watch on pullbacks. Reported Aug '21 quarterly earnings +713% on +70% sales revenues versus the year ago period.
>>> FEATURED STOCK ARTICLE : Perched at 52-week High With Earnings News Due - 9/29/2021 |
View all notes |
Set NEW NOTE alert |
Company Profile |
SEC
News |
Chart |
Request a new note
C
A
S
I |
AVTR
-
NYSE
Avantor Inc
Medical-Research Eqp/Svc
|
$40.48
|
-0.10
-0.25% |
$41.02
|
1,240,861
33.40% of 50 DAV
50 DAV is 3,715,000
|
$44.37
-8.77%
|
6/10/2021
|
$32.94
|
PP = $34.09
|
|
MB = $35.79
|
Most Recent Note - 10/11/2021 4:48:54 PM
G - Volume totals have been cooling while still finding support at its 50 DMA line ($40.38). A damaging violation of the 50 DMA line or recent low ($39.24 on 10/01/21) may trigger technical sell signals. Completed a Secondary Offering on 9/13/21 while perched at its all-time high, very extended from any sound base. See the latest FSU analysis for more details and a new annotated graph.
>>> FEATURED STOCK ARTICLE : Pulled Back Finding Support Near 50-Day Moving Average - 10/11/2021 |
View all notes |
Set NEW NOTE alert |
Company Profile |
SEC
News |
Chart |
Request a new note
C
A
S
I |
MIME
-
NASDAQ
Mimecast Limited
Computer Sftwr-Security
|
$62.20
|
-0.62
-0.99% |
$63.49
|
372,918
37.37% of 50 DAV
50 DAV is 998,000
|
$71.45
-12.95%
|
8/2/2021
|
$56.12
|
PP = $59.58
|
|
MB = $62.56
|
Most Recent Note - 10/5/2021 5:54:29 PM
G - Consolidating near its 50 DMA line ($63.50) and above prior highs in the $59 area defining near-term support to watch. Fundamentals remain strong.
>>> FEATURED STOCK ARTICLE : Consolidating After Getting Extended from Previous Base Noted - 9/21/2021 |
View all notes |
Set NEW NOTE alert |
Company Profile |
SEC
News |
Chart |
Request a new note
C
A
S
I |
|
|
|
THESE ARE NOT BUY RECOMMENDATIONS!
Comments contained in the body of this report are technical
opinions only. The material herein has been obtained
from sources believed to be reliable and accurate, however,
its accuracy and completeness cannot be guaranteed.
This site is not an investment advisor, hence it does
not endorse or recommend any securities or other investments.
Any recommendation contained in this report may not
be suitable for all investors and it is not to be deemed
an offer or solicitation on our part with respect to
the purchase or sale of any securities. All trademarks,
service marks and trade names appearing in this report
are the property of their respective owners, and are
likewise used for identification purposes only.
This report is a service available
only to active Paid Premium Members.
You may opt-out of receiving report notifications
at any time. Questions or comments may be submitted
by writing to Premium Membership Services 665 S.E. 10 Street, Suite 201 Deerfield Beach, FL 33441-5634 or by calling 1-800-965-8307
or 954-785-1121.
|
|
|