You are not logged in.
This means you
CAN ONLY VIEW reports that were published prior to Monday, March 31, 2025.
You
MUST UPGRADE YOUR MEMBERSHIP if you want to see any current reports.
AFTER MARKET UPDATE - FRIDAY, OCTOBER 15TH, 2021
Previous After Market Report Next After Market Report >>>
|
|
|
|
DOW |
+382.20 |
35,294.76 |
+1.09% |
|
Volume |
979,978,873 |
+23% |
|
Volume |
4,440,864,800 |
+5% |
|
NASDAQ |
+73.91 |
14,897.34 |
+0.50% |
|
Advancers |
1,561 |
49% |
|
Advancers |
1,850 |
43% |
|
S&P 500 |
+33.11 |
4,471.37 |
+0.75% |
|
Decliners |
1,653 |
51% |
|
Decliners |
2,463 |
57% |
|
Russell 2000 |
-8.52 |
2,265.65 |
-0.37% |
|
52 Wk Highs |
205 |
|
|
52 Wk Highs |
152 |
|
|
S&P 600 |
-6.34 |
1,363.91 |
-0.46% |
|
52 Wk Lows |
30 |
|
|
52 Wk Lows |
62 |
|
|
With Thursday's big gains the direction of the major averages (M) has shifted to a new "confirmed uptrend" and new buying is now warranted based on the noted follow-through day.
|
 |
Major Averages Rally Further After Confirming New Uptrend
Kenneth J. Gruneisen - Passed the CAN SLIM® Master's Exam
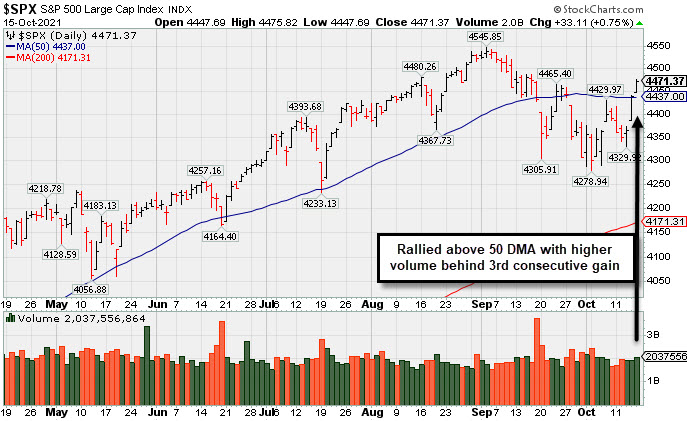
The Dow rallied 382 points, extending its weekly rise to 1.6% and closing within 1% of its August 16 record high. The S&P 500 climbed 0.8%, capping its second consecutive weekly gain with a 1.8% uptick. The Nasdaq Composite added 0.5%, extending its weekly advance to 2.2%, its best five-day stretch since August. The volume totals reported were higher than the prior session on the NYSE and on the Nasdaq exchange, inflated by options expirations. Decliners led advancers by a narrow margin on the NYSE and by 4-3 on the Nasdaq exchange. Leadership improved as there were 89 high-ranked companies from the Leaders List that hit new 52-week highs and were listed on the BreakOuts Page versus the total of 16 on the prior session. New 52-week highs totals expanded and outnumbered new 52-week lows on the NYSE and on the Nasdaq exchange. The solid gains on Thursday met the definition of a follow-through day confirming a new rally for the major indices (M criteria). Investors are reminded to only make proper new buys as per the fundamental and technical rules of the fact-based investment system.
PICTURED: The S&P 500 Index rallied and closed back above its 50-day moving average (DMA) line with Friday's 3rd consecutive gain. Disciplined investors following the fact-based investment system may note that Thursday's session was a proper follow-through day - which requires a solid gain from at least one of the major averages backed by higher volume and coupled with an expansion in the number of stocks hitting new highs.
U.S. stocks finished higher on Friday as investors digested another round of upbeat corporate earnings results. On the data front, retail sales unexpectedly climbed 0.7% last month following an upwardly revised 0.9% increase in August. Meanwhile, a preliminary October update on consumer sentiment from the University of Michigan declined to 71.4, disappointing consensus estimates of 73.1. Treasuries weakened, with yield on the 10-year note up six basis points to 1.57%. In commodities, WTI crude gained 1.2% to $82.25/barrel, capping its eighth consecutive weekly rise, for its longest such winning streak since a run ending in May 2015. COMEX gold slid 1.7% to $1766.70/ounce, paring its weekly advance to just 0.6%.
Eight of 11 S&P 500 sectors closed in positive territory, with Communication Services, Consumer Staples and Utilities the only laggards. The Consumer Discretionary group paced gains as retailers outperformed following the upbeat retail sales data. Financials also rallied, with Goldman Sachs (GS +3.80%) rose after easily topping analysts’ consensus estimates, as the firm’s trading revenue unexpectedly increased 23%. Elsewhere, Alcoa (AA +15.23%) rallied after the aluminum manufacturer topped analysts’ expectations and announced it would pay its first dividend to shareholders since 2016. |
 Kenneth J. Gruneisen started out as a licensed stockbroker in August 1987, a couple of months prior to the historic stock market crash that took the Dow Jones Industrial Average down -22.6% in a single day. He has published daily fact-based fundamental and technical analysis on high-ranked stocks online for two decades. Through FACTBASEDINVESTING.COM, Kenneth provides educational articles, news, market commentary, and other information regarding proven investment systems that work in good times and bad.
Comments contained in the body of this report are technical opinions only and are not necessarily those of Gruneisen Growth Corp. The material herein has been obtained from sources believed to be reliable and accurate, however, its accuracy and completeness cannot be guaranteed. Our firm, employees, and customers may effect transactions, including transactions contrary to any recommendation herein, or have positions in the securities mentioned herein or options with respect thereto. Any recommendation contained in this report may not be suitable for all investors and it is not to be deemed an offer or solicitation on our part with respect to the purchase or sale of any securities. |
|
 |
Retail, Financial, Semiconductor, and Energy-Linked Groups Rose
Kenneth J. Gruneisen - Passed the CAN SLIM® Master's Exam
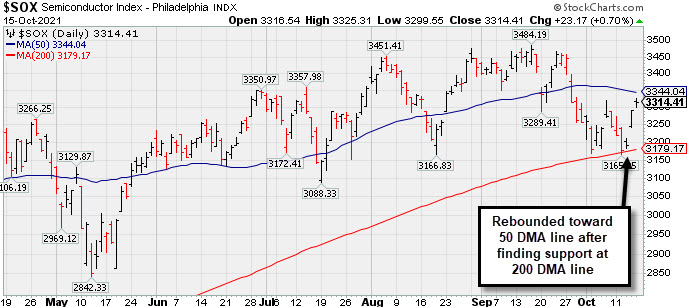
The Retail Index ($RLX +2.32%), Broker/Dealer Index ($XBD +1.38%), and Bank Index ($BKX +1.36%) posted unanimous gains on Friday, boosting the major averages higher. The Semiconductor Index ($SOX +0.70%) posted a gain while the Networking Index ($NWX -0.65%) and Biotech Index ($BTK -0.16%) both edged lower. Commodity-linked groups were mixed as the Oil Services Index ($OSX +2.05%) and Integrated Oil Index ($XOI +0.63%) posted gains while the Gold & Silver Index ($XAU -0.60%) edged lower.
PICTURED: The Semiconductor Index ($SOX +0.70%) found prompt support near its 200-day moving average (DMA) line and rallied toward its 50 DMA line with 3 consecutive gains.
| Oil Services |
$OSX |
64.86 |
+1.30 |
+2.05% |
+46.31% |
| Integrated Oil |
$XOI |
1,202.34 |
+7.49 |
+0.63% |
+51.72% |
| Semiconductor |
$SOX |
3,314.41 |
+23.17 |
+0.70% |
+18.56% |
| Networking |
$NWX |
842.55 |
-5.55 |
-0.65% |
+17.49% |
| Broker/Dealer |
$XBD |
493.54 |
+6.71 |
+1.38% |
+30.70% |
| Retail |
$RLX |
4,065.27 |
+92.35 |
+2.32% |
+14.09% |
| Gold & Silver |
$XAU |
132.06 |
-0.79 |
-0.60% |
-8.41% |
| Bank |
$BKX |
137.03 |
+1.84 |
+1.36% |
+39.95% |
| Biotech |
$BTK |
5,635.34 |
-9.07 |
-0.16% |
-1.81% |
|
|
|
 |
Pulling Back Near Prior Highs Following Technical Breakout
Kenneth J. Gruneisen - Passed the CAN SLIM® Master's Exam
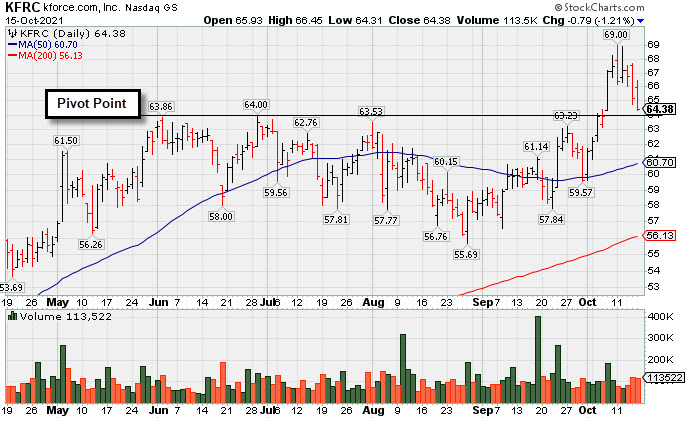
Kforce Inc (KFRC -$0.79 or -1.21% to $64.38) pulled back with higher (near average) volume for a 3rd consecutive loss. Prior highs in the $64 area define initial support to watch. It made limited progress since its 10/07/21 gain for a new all-time high backed by +58% above average volume triggered a technical buy signal.
KFRC was highlighted in yellow with pivot point cited based on its 6/02/21 high plus 10 cents in the 9/10/21 mid-day report (read here). It was last shown in this FSU section in greater detail with an annotated graph in the FSU section on 9/13/21 under the headline, "Staffing Firm Still Faces Some Overhead Supply".
Fundamentals are strong. It has a 95 Earnings Per Share Rating. Earnings rose +113% on +18% sales revenues for the Jun '21 quarter versus the year ago period, its 4th quarterly earnings increase above the +25% minimum earnings guideline (C criteria). Annual earnings (A criteria) growth has been steady.
KFRC hails from the Comml Svcs-Staffing group which is currently ranked 26th on the 197 Industry Groups list (L criteria). It has 21.6 million shares outstanding (S criteria) which can contribute to greater price volatility in the event of institutional buying or selling. The number of top-rated funds owning its shares rose from 370 in Sep '20 to 436 in Sep '21, a reassuring sign concerning the I criteria. Its current Up/Down Volume Ratio of 1.7 is an unbiased indication its shares have been under slight accumulation over the past 50 days. It has a Timeliness Rating of A and Sponsorship Rating of C.
|
|
|
Color Codes Explained :
Y - Better candidates highlighted by our
staff of experts.
G - Previously featured
in past reports as yellow but may no longer be buyable under the
guidelines.
***Last / Change / Volume data in this table is the closing quote data***
Symbol/Exchange
Company Name
Industry Group |
PRICE |
CHANGE
(%Change) |
Day High |
Volume
(% DAV)
(% 50 day avg vol) |
52 Wk Hi
% From Hi |
Featured
Date |
Price
Featured |
Pivot Featured |
|
Max Buy |
 SIVB
-
NASDAQ
SIVB
-
NASDAQ
S V B Financial Group
BANKING - Regional - Pacific Banks
|
$690.33
|
+6.44
0.94% |
$695.59
|
314,932
78.73% of 50 DAV
50 DAV is 400,000
|
$692.21
-0.27%
|
8/6/2021
|
$589.70
|
PP = $608.94
|
|
MB = $639.39
|
Most Recent Note - 10/12/2021 5:43:56 PM
G - There was a "negative reversal" on the prior session after hitting a new all-time high. Extended from the previously noted base, the prior highs in the $608 area define initial support to watch above its 50 DMA line ($600). Completed a new Public Offering on 8/11/21.
>>> FEATURED STOCK ARTICLE : Pullback After 5 Straight Gains into New High Territory - 9/28/2021 |
View all notes |
Set NEW NOTE alert |
Company Profile |
SEC
News |
Chart |
Request a new note
C
A
S
I |
BLDR
-
NYSE
Builders Firstsource Inc
Bldg-Constr Prds/Misc
|
$57.07
|
+0.26
0.46% |
$57.93
|
1,824,184
89.99% of 50 DAV
50 DAV is 2,027,000
|
$57.81
-1.28%
|
8/12/2021
|
$52.38
|
PP = $54.09
|
|
MB = $56.79
|
Most Recent Note - 10/14/2021 6:13:34 PM
Y - Posted an 8th consecutive gain today for a new all-time high and it closed near its "max buy" level. Gains did not have the +40% above average volume needed to trigger a proper technical buy signal. Fundamentals remain strong.
>>> FEATURED STOCK ARTICLE : Sputtering After Wedging to New Highs - 10/1/2021 |
View all notes |
Set NEW NOTE alert |
Company Profile |
SEC
News |
Chart |
Request a new note
C
A
S
I |
KFRC
-
NASDAQ
Kforce Inc
Comml Svcs-Staffing
|
$64.38
|
-0.79
-1.21% |
$66.45
|
113,522
98.71% of 50 DAV
50 DAV is 115,000
|
$69.00
-6.70%
|
9/10/2021
|
$59.53
|
PP = $64.48
|
|
MB = $67.70
|
 Most Recent Note - 10/15/2021 5:07:14 PM
Y - Pulled back today with near average volume 3rd consecutive loss. Stalled since its 10/07/21 gain for a new all-time high backed by +58% above average volume triggered a technical buy signal. Fundamentals are strong. See the latest FSU analysis for more details and a new annotated graph.
>>> FEATURED STOCK ARTICLE : Pulling Back Near Prior Highs Following Technical Breakout - 10/15/2021 |
View all notes |
Set NEW NOTE alert |
Company Profile |
SEC
News |
Chart |
Request a new note
C
A
S
I |
GNRC
-
NYSE
Generac Hldgs Inc
Electrical-Power/Equipmt
|
$451.94
|
+18.19
4.19% |
$457.99
|
896,045
147.62% of 50 DAV
50 DAV is 607,000
|
$466.92
-3.21%
|
8/30/2021
|
$449.36
|
PP = $457.10
|
|
MB = $479.96
|
Most Recent Note - 10/15/2021 12:30:42 PM
Y - Nearly challenging prior highs with today's big volume-driven gain. Rebounded above its 50 DMA line ($425) on the prior session. A gain and close above the pivot point backed by at least +40% above average volume may trigger a new (or add-on) technical buy signal.
>>> FEATURED STOCK ARTICLE : Prior Lows Define Near-Term Support After 50 DMA Violation - 10/6/2021 |
View all notes |
Set NEW NOTE alert |
Company Profile |
SEC
News |
Chart |
Request a new note
C
A
S
I |
CAMT
-
NASDAQ
Camtek Ltd
ELECTRONICS - Scientific and Technical Instrum
|
$38.54
|
-0.13
-0.34% |
$39.10
|
77,215
47.08% of 50 DAV
50 DAV is 164,000
|
$46.01
-16.24%
|
8/4/2021
|
$39.67
|
PP = $40.57
|
|
MB = $42.60
|
Most Recent Note - 10/15/2021 5:09:18 PM
G - Volume totals have been cooling while still sputtering below its 50 DMA line ($40.05). The prior low ($34.68 on 8/17/21) defines the next important near-term support to watch. A rebound above the 50 DMA line is needed for its outlook to improve. Fundamentals remain strong.
>>> FEATURED STOCK ARTICLE : Fell Below Prior High and Violated 50-Day Moving Average - 10/5/2021 |
View all notes |
Set NEW NOTE alert |
Company Profile |
SEC
News |
Chart |
Request a new note
C
A
S
I |
Symbol/Exchange
Company Name
Industry Group |
PRICE |
CHANGE
(%Change) |
Day High |
Volume
(% DAV)
(% 50 day avg vol) |
52 Wk Hi
% From Hi |
Featured
Date |
Price
Featured |
Pivot Featured |
|
Max Buy |
PKI
-
NYSE
Perkinelmer Inc
ELECTRONICS - Scientific and Technical Instrum
|
$169.82
|
+0.14
0.08% |
$172.23
|
469,038
71.94% of 50 DAV
50 DAV is 652,000
|
$192.00
-11.55%
|
8/18/2021
|
$181.07
|
PP = $188.50
|
|
MB = $197.93
|
Most Recent Note - 10/12/2021 5:47:58 PM
G - Suffered a 3rd consecutive loss. A rebound above the 50 DMA line ($181.78) is needed for its outlook to improve. Its Relative Strength Rating has slumped to 78. Fundamentals remain strong.
>>> FEATURED STOCK ARTICLE : Stalled But Holding Ground After Recent "3 Weeks Tight" - 9/17/2021 |
View all notes |
Set NEW NOTE alert |
Company Profile |
SEC
News |
Chart |
Request a new note
C
A
S
I |
UMC
-
NYSE
United Microelectrnc Adr
ELECTRONICS - Semiconductor - Integrated Cir
|
$10.39
|
+0.15
1.46% |
$10.55
|
7,116,352
98.05% of 50 DAV
50 DAV is 7,258,000
|
$12.62
-17.67%
|
8/5/2021
|
$11.62
|
PP = $11.38
|
|
MB = $11.95
|
Most Recent Note - 10/14/2021 6:27:36 PM
G - Posted a small gain today after 4 consecutive losses slumping near its 200 DMA line ($9.82). A rebound above the 50 DMA line ($11.23) is needed for its outlook to improve.
>>> FEATURED STOCK ARTICLE : Consolidating Above 50-day Moving Average Near "Max Buy" Level - 9/27/2021 |
View all notes |
Set NEW NOTE alert |
Company Profile |
SEC
News |
Chart |
Request a new note
C
A
S
I |
BRKS
-
NASDAQ
Brooks Automation
ELECTRONICS - Semiconductor Equipment and Mate
|
$103.45
|
+2.31
2.28% |
$103.93
|
397,485
62.30% of 50 DAV
50 DAV is 638,000
|
$110.40
-6.30%
|
9/20/2021
|
$101.21
|
PP = $108.82
|
|
MB = $114.26
|
Most Recent Note - 10/14/2021 6:15:05 PM
Y - Posted a gain today with lighter than average volume. Still perched within striking distance of its 52-week high. Pivot point cited was based on its 4/27/21 high plus 10 cents. Subsequent gains above the pivot point or prior highs backed by at least 40% above average volume may trigger a convincing technical buy signal.
>>> FEATURED STOCK ARTICLE : Rallying Near High After Brief Consolidation Below 200 DMA Line - 9/20/2021 |
View all notes |
Set NEW NOTE alert |
Company Profile |
SEC
News |
Chart |
Request a new note
C
A
S
I |
ENTG
-
NASDAQ
Entegris Inc
ELECTRONICS - Semiconductor Equipment and Mate
|
$129.98
|
+2.08
1.63% |
$131.01
|
1,144,449
164.67% of 50 DAV
50 DAV is 695,000
|
$135.99
-4.42%
|
8/4/2021
|
$125.33
|
PP = $126.51
|
|
MB = $132.84
|
Most Recent Note - 10/14/2021 6:30:15 PM
Y - Posted a big volume-driven gain today and its color code is changed to yellow. Found support near its 50 DMA line ($122) after damaging losses. Its prior low and 200 DMA line define the next important support in the $109 area.
>>> FEATURED STOCK ARTICLE : Hit New High and Rose Above its Max Buy Level - 9/23/2021 |
View all notes |
Set NEW NOTE alert |
Company Profile |
SEC
News |
Chart |
Request a new note
C
A
S
I |
CLFD
-
NASDAQ
Clearfield Inc
TELECOMMUNICATIONS - Cables / Satalite Equipment
|
$52.49
|
-1.21
-2.25% |
$54.49
|
72,530
88.45% of 50 DAV
50 DAV is 82,000
|
$53.94
-2.69%
|
7/23/2021
|
$40.23
|
PP = $43.74
|
|
MB = $45.93
|
Most Recent Note - 10/11/2021 4:54:06 PM
G - Posted a gain with above average volume today. Perched at its 52-week high, extended from the previously noted base. Found prompt support near its 50 DMA line ($44.58) after testing the prior low ($42.34) where more damaging losses may trigger technical sell signals. Fundamentals remain strong.
>>> FEATURED STOCK ARTICLE : Quietly Consolidating Near All-Time High - 9/14/2021 |
View all notes |
Set NEW NOTE alert |
Company Profile |
SEC
News |
Chart |
Request a new note
C
A
S
I |
Symbol/Exchange
Company Name
Industry Group |
PRICE |
CHANGE
(%Change) |
Day High |
Volume
(% DAV)
(% 50 day avg vol) |
52 Wk Hi
% From Hi |
Featured
Date |
Price
Featured |
Pivot Featured |
|
Max Buy |
TGH
-
NYSE
Textainer Group Holdings
TRANSPORTATION - Logistics
|
$37.03
|
+0.17
0.46% |
$38.84
|
1,171,476
263.85% of 50 DAV
50 DAV is 444,000
|
$37.88
-2.24%
|
10/7/2021
|
$36.97
|
PP = $36.80
|
|
MB = $38.64
|
Most Recent Note - 10/15/2021 12:41:12 PM
Y - Hitting a new 52-week high with today's volume-driven gain triggering a technical buy signal. Its 50 DMA line ($34.23) defines important near-term support to watch above recent lows in the $30-31 area. Fundamentals remain strong.
>>> FEATURED STOCK ARTICLE : Perched Near High With Strong Fundamentals - 10/7/2021 |
View all notes |
Set NEW NOTE alert |
Company Profile |
SEC
News |
Chart |
Request a new note
C
A
S
I |
SMPL
-
NASDAQ
Simply Good Foods Co
Food-Confectionery
|
$35.01
|
+0.38
1.10% |
$35.75
|
339,041
103.97% of 50 DAV
50 DAV is 326,100
|
$38.50
-9.06%
|
12/28/2020
|
$30.40
|
PP = $31.44
|
|
MB = $33.01
|
Most Recent Note - 10/12/2021 5:39:46 PM
G - Consolidating just above its 50 DMA line ($35.37). Its Relative Strength Rating has slumped to 78. Recent low ($33.55 on 9/20/21) and 200 DMA line define important support where more damaging losses would raise greater concerns. Fundamentals remain strong. See the latest FSU analysis for more details and a new annotated graph.
>>> FEATURED STOCK ARTICLE : Consolidating Just Above 50-Day Moving Average Line - 10/12/2021 |
View all notes |
Set NEW NOTE alert |
Company Profile |
SEC
News |
Chart |
Request a new note
C
A
S
I |
WDAY
-
NYSE
Workday Inc Cl A
Computer Sftwr-Enterprse
|
$270.99
|
-0.12
-0.04% |
$272.35
|
1,641,657
105.25% of 50 DAV
50 DAV is 1,559,800
|
$282.77
-4.17%
|
9/7/2021
|
$275.69
|
PP = $282.87
|
|
MB = $297.01
|
Most Recent Note - 10/13/2021 6:16:10 PM
Y - Gapped up today, but encountered pressure and ended near the middle of its intra-day range after larger early gains. Its 50 DMA line ($255).and recent lows ($246) define near-term support to watch where violations would raise concerns. Faces resistance due to overhead supply up to the $278 level after trading higher for the past month. Fundamentals remain strong. See the latest FSU analysis for more details and a new annotated graph.
>>> FEATURED STOCK ARTICLE : Rebounding From 50-Day Moving Average Toward Prior Highs - 10/13/2021 |
View all notes |
Set NEW NOTE alert |
Company Profile |
SEC
News |
Chart |
Request a new note
C
A
S
I |
CTLT
-
NYSE
Catalent Inc
DRUGS - Biotechnology
|
$128.77
|
-0.17
-0.13% |
$130.42
|
386,078
43.97% of 50 DAV
50 DAV is 878,000
|
$142.64
-9.72%
|
8/25/2021
|
$128.72
|
PP = $127.78
|
|
MB = $134.17
|
Most Recent Note - 10/11/2021 4:52:39 PM
Y - Volume totals have been cooling. Sputtering below Its 50 DMA line ($130) and testing prior highs in the $124-127 area which define important near-term support to watch. Fundamentals remain strong.
>>> FEATURED STOCK ARTICLE : Found Support Near Prior High While Consolidating - 10/8/2021 |
View all notes |
Set NEW NOTE alert |
Company Profile |
SEC
News |
Chart |
Request a new note
C
A
S
I |
MEDP
-
NASDAQ
Medpace Holdings Inc
Medical-Research Eqp/Svc
|
$187.08
|
+0.47
0.25% |
$189.40
|
137,139
83.93% of 50 DAV
50 DAV is 163,400
|
$199.04
-6.01%
|
9/10/2021
|
$196.32
|
PP = $196.22
|
|
MB = $206.03
|
Most Recent Note - 10/14/2021 6:22:43 PM
Y - Quietly slumped from near its 52-week high finding prompt support near its 50 DMA line ($185). More damaging losses would raise concerns. Pivot point cited was based on its 4/26/21 high plus 10 cents. Subsequent gains and strong close above the pivot point backed by at least +40% above average volume may trigger a technical buy signal. See the latest FSU analysis for more details and a new annotated graph.
>>> FEATURED STOCK ARTICLE : Found Prompt Support Near 50-Day Moving Average Line - 10/14/2021 |
View all notes |
Set NEW NOTE alert |
Company Profile |
SEC
News |
Chart |
Request a new note
C
A
S
I |
Symbol/Exchange
Company Name
Industry Group |
PRICE |
CHANGE
(%Change) |
Day High |
Volume
(% DAV)
(% 50 day avg vol) |
52 Wk Hi
% From Hi |
Featured
Date |
Price
Featured |
Pivot Featured |
|
Max Buy |
JEF
-
NYSE
Jefferies Financial Grp
Finance-Invest Bnk/Bkrs
|
$41.63
|
+0.28
0.68% |
$42.13
|
1,652,287
93.46% of 50 DAV
50 DAV is 1,768,000
|
$41.44
0.46%
|
6/28/2021
|
$31.81
|
PP = $34.42
|
|
MB = $36.14
|
Most Recent Note - 10/11/2021 12:35:18 PM
G - Posting a 7th consecutive gain today for another new all-time high. Its 50 DMA line ($36.43) defines important near-term support to watch on pullbacks. Reported Aug '21 quarterly earnings +713% on +70% sales revenues versus the year ago period.
>>> FEATURED STOCK ARTICLE : Perched at 52-week High With Earnings News Due - 9/29/2021 |
View all notes |
Set NEW NOTE alert |
Company Profile |
SEC
News |
Chart |
Request a new note
C
A
S
I |
AVTR
-
NYSE
Avantor Inc
Medical-Research Eqp/Svc
|
$38.35
|
+0.81
2.16% |
$38.40
|
2,660,290
69.39% of 50 DAV
50 DAV is 3,834,000
|
$44.37
-13.57%
|
6/10/2021
|
$32.94
|
PP = $34.09
|
|
MB = $35.79
|
Most Recent Note - 10/12/2021 12:00:13 PM
G - Gapped down today violating its 50 DMA line ($40.39) and also undercutting the recent low ($39.24 on 10/01/21) with a damaging volume-driven loss triggering technical sell signals. Completed a Secondary Offering on 9/13/21 while perched at its all-time high, very extended from any sound base.
>>> FEATURED STOCK ARTICLE : Pulled Back Finding Support Near 50-Day Moving Average - 10/11/2021 |
View all notes |
Set NEW NOTE alert |
Company Profile |
SEC
News |
Chart |
Request a new note
C
A
S
I |
MIME
-
NASDAQ
Mimecast Limited
Computer Sftwr-Security
|
$65.35
|
-1.32
-1.98% |
$67.17
|
649,700
69.26% of 50 DAV
50 DAV is 938,000
|
$71.45
-8.54%
|
8/2/2021
|
$56.12
|
PP = $59.58
|
|
MB = $62.56
|
Most Recent Note - 10/12/2021 5:42:21 PM
G - Recently slumped below its 50 DMA line ($64.27) toward prior highs in the $59 area defining near-term support to watch. Fundamentals remain strong. A rebound above the 50 DMA line is needed for its outlook to improve.
>>> FEATURED STOCK ARTICLE : Consolidating After Getting Extended from Previous Base Noted - 9/21/2021 |
View all notes |
Set NEW NOTE alert |
Company Profile |
SEC
News |
Chart |
Request a new note
C
A
S
I |
|
|
|
THESE ARE NOT BUY RECOMMENDATIONS!
Comments contained in the body of this report are technical
opinions only. The material herein has been obtained
from sources believed to be reliable and accurate, however,
its accuracy and completeness cannot be guaranteed.
This site is not an investment advisor, hence it does
not endorse or recommend any securities or other investments.
Any recommendation contained in this report may not
be suitable for all investors and it is not to be deemed
an offer or solicitation on our part with respect to
the purchase or sale of any securities. All trademarks,
service marks and trade names appearing in this report
are the property of their respective owners, and are
likewise used for identification purposes only.
This report is a service available
only to active Paid Premium Members.
You may opt-out of receiving report notifications
at any time. Questions or comments may be submitted
by writing to Premium Membership Services 665 S.E. 10 Street, Suite 201 Deerfield Beach, FL 33441-5634 or by calling 1-800-965-8307
or 954-785-1121.
|
|
|