You are not logged in.
This means you
CAN ONLY VIEW reports that were published prior to Tuesday, April 1, 2025.
You
MUST UPGRADE YOUR MEMBERSHIP if you want to see any current reports.
AFTER MARKET UPDATE - THURSDAY, OCTOBER 7TH, 2021
Previous After Market Report Next After Market Report >>>
|
|
|
|
DOW |
+337.95 |
34,754.94 |
+0.98% |
|
Volume |
881,853,909 |
-0% |
|
Volume |
3,924,339,300 |
-11% |
|
NASDAQ |
+152.10 |
14,654.02 |
+1.05% |
|
Advancers |
2,241 |
69% |
|
Advancers |
2,990 |
69% |
|
S&P 500 |
+36.21 |
4,399.76 |
+0.83% |
|
Decliners |
1,000 |
31% |
|
Decliners |
1,321 |
31% |
|
Russell 2000 |
+35.14 |
2,250.09 |
+1.59% |
|
52 Wk Highs |
128 |
|
|
52 Wk Highs |
122 |
|
|
S&P 600 |
+21.09 |
1,366.69 |
+1.57% |
|
52 Wk Lows |
61 |
|
|
52 Wk Lows |
196 |
|
|
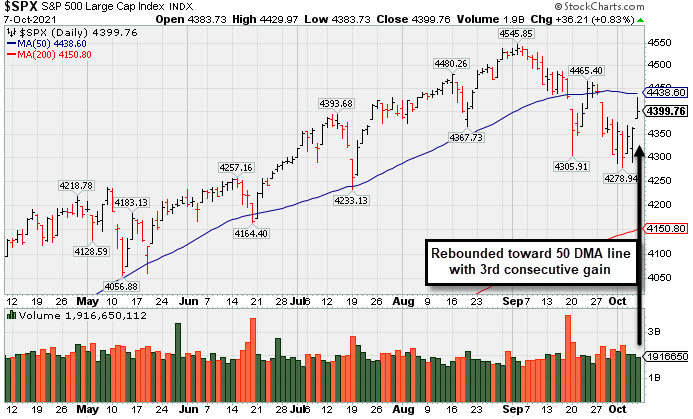
The direction of the major averages (M) has shifted to a "market correction" and new buying is to be avoided. Greater caution is now warranted until a new confirmed rally with a follow-through day is noted.
|
 |
Leadership Improved and Major Indices Rose With Less Volume
Kenneth J. Gruneisen - Passed the CAN SLIM® Master's Exam
The Dow rose 337 points, while the S&P 500 climbed 0.8%, on track for its best weekly performance since late August. The Nasdaq Composite jumped 1.1%. The volume totals reported were lighter than the prior session on the NYSE and on the Nasdaq exchange. Breadth was positive as advancers led decliners by more than a 2-1 margin on the NYSE and on the Nasdaq exchange. There were 64 high-ranked companies from the Leaders List that hit new 52-week highs and were listed on the BreakOuts Page versus the total of 8 on the prior session. New 52-week highs outnumbered new 52-week lows on the NYSE, but new lows still outnumbered new highs on the Nasdaq exchange. The major indices (M criteria) have come under greater pressure and earned the label of a "market correction". During corrections investors are reminded to avoid new buying decisions and to sell weakening stocks on a case-by-case basis, reducing exposure and raising cash as per the rules of the fact-based investment system.
PICTURED: The S&P 500 Index rebounded toward its 50-day moving average (DMA) line with a 3rd consecutive gain. Disciplined investors following the fact-based investment system will wait to make new buys only after a proper follow-through day - which requires a solid gain from at least one of the major averages backed by higher volume and coupled with an expansion in the number of stocks hitting new highs. U.S. stocks staged a broad rally on Thursday as concerns over a near-term debt limit subsided. In Washington, Senate Majority Leader Chuck Schumer confirmed that legislators had reached a short-term deal to increase the debt ceiling into early December, with a vote possible as soon as today. This would provide temporary relief to the immediate risk of federal payment default.
A better-than-expected update on the U.S. labor market also supported sentiment, with weekly initial jobless claims easing to a one-month low of 326,000 ahead of tomorrow’s all-important non-farm payrolls report. Treasuries declined amid the perceived “risk-on” mood. The yield on the 10-year note rose five basis point to 1.57%, its highest level in more than three months. In commodities, WTI crude reversed earlier weakness, adding 1.8% to $78.82/barrel after the U.S. Energy Department said they had no intention to tap oil reserves “at this time.”
Ten of 11 S&P 500 sectors finished in positive territory, with Utilities the only laggard. The Consumer Discretionary group paced the gains, with Amazon (AMZN +1.24%). In earnings, Levi Strauss (LEVI +8.46%) rose after topping Wall Street sales and earnings expectations and lifting its full-year profit outlook. Packaged-food maker Lamb Weston (LW -6.64%) slid as its quarterly profit tally took a hit from higher costs. Elsewhere, Twitter (TWTR +4.37%) rose after announcing a sale of its mobile ad unit MoPub for $1.05 billion in cash. |
 Kenneth J. Gruneisen started out as a licensed stockbroker in August 1987, a couple of months prior to the historic stock market crash that took the Dow Jones Industrial Average down -22.6% in a single day. He has published daily fact-based fundamental and technical analysis on high-ranked stocks online for two decades. Through FACTBASEDINVESTING.COM, Kenneth provides educational articles, news, market commentary, and other information regarding proven investment systems that work in good times and bad.
Comments contained in the body of this report are technical opinions only and are not necessarily those of Gruneisen Growth Corp. The material herein has been obtained from sources believed to be reliable and accurate, however, its accuracy and completeness cannot be guaranteed. Our firm, employees, and customers may effect transactions, including transactions contrary to any recommendation herein, or have positions in the securities mentioned herein or options with respect thereto. Any recommendation contained in this report may not be suitable for all investors and it is not to be deemed an offer or solicitation on our part with respect to the purchase or sale of any securities. |
|
 |
Retail, Financial, Tech, and Commodity-Linked Groups Rose
Kenneth J. Gruneisen - Passed the CAN SLIM® Master's Exam
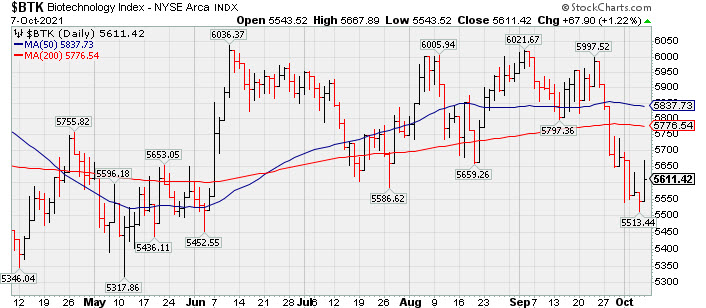
The Retail Index ($RLX +1.51%), Broker/Dealer Index ($XBD +1.49%), and Bank Index ($BKX +0.40%) each posted gains. The tech sector had a positive bias as the Semiconductor Index ($SOX +1.10%), Networking Index ($NWX +2.26%), and Biotech Index ($BTK +1.22%) posted unanimous gains. The Gold & Silver Index ($XAU +1.38%) rose and the Oil Services Index ($OSX +3.28%) posted a big gain while the Integrated Oil Index ($XOI +0.47%) also edged higher.
PICTURED: The Biotech Index ($BTK +1.22%) posted a gain today. Recently it slumped well below its 50-day and 200-day moving average (DMA) lines.
| Oil Services |
$OSX |
60.27 |
+1.91 |
+3.28% |
+35.96% |
| Integrated Oil |
$XOI |
1,153.51 |
+5.41 |
+0.47% |
+45.56% |
| Semiconductor |
$SOX |
3,274.48 |
+35.69 |
+1.10% |
+17.13% |
| Networking |
$NWX |
837.77 |
+18.52 |
+2.26% |
+16.82% |
| Broker/Dealer |
$XBD |
487.61 |
+7.17 |
+1.49% |
+29.13% |
| Retail |
$RLX |
3,935.95 |
+58.52 |
+1.51% |
+10.46% |
| Gold & Silver |
$XAU |
122.96 |
+1.67 |
+1.38% |
-14.72% |
| Bank |
$BKX |
135.38 |
+0.54 |
+0.40% |
+38.27% |
| Biotech |
$BTK |
5,611.42 |
+67.90 |
+1.22% |
-2.22% |
|
|
|
 |
Perched Near High With Strong Fundamentals
Kenneth J. Gruneisen - Passed the CAN SLIM® Master's Exam
Textainer Group Holdings (TGH +$0.28 or +0.78% to $36.22) finished near the session low after churning higher volume today. It was highlighted in yellow in the earlier mid-day report (read here) with pivot point cited based on its 9/29/21 high while building on a cup-with-handle base. It is perched within close striking distance of its 52-week high after finding prompt support near its 50-day moving average (DMA) line ($33.73) during an orderly consolidation. Subsequent gains above the pivot point backed by at least +40% above average volume may trigger a proper technical buy signal.
It hails from the Commercial Services - Leasing industry group which is currently ranked 35th on the 197 Industry Groups list (L criteria). It has the highest possible Earnings Per Share Rating of 99. It recently reported Jun '21 quarterly earnings +429% on +29% sales revenues versus the year ago period, its 5th strong earnings comparison. Sales revenues growth has been improving and accelerating in the 3 latest quarterly comparisons after years of sub-par and negative comparisons, not a match with with regard to the fact-based investment system's fundamental guidelines. Annual earnings (A criteria) history has been strong after a downturn and loss in FY '16.
There are 49.6 million shares outstanding (S criteria) which can contribute to greater price volatility in the event of institutional buying or selling. The number of top-rated funds owning its shares has risen from 294 in Dec '20 to 329 in Sep '21, a reassuring sign concerning the I criteria. It has a Timeliness rating of A and an Accumulation/Distribution rating of B-. |
|
|
Color Codes Explained :
Y - Better candidates highlighted by our
staff of experts.
G - Previously featured
in past reports as yellow but may no longer be buyable under the
guidelines.
***Last / Change / Volume data in this table is the closing quote data***
Symbol/Exchange
Company Name
Industry Group |
PRICE |
CHANGE
(%Change) |
Day High |
Volume
(% DAV)
(% 50 day avg vol) |
52 Wk Hi
% From Hi |
Featured
Date |
Price
Featured |
Pivot Featured |
|
Max Buy |
 SIVB
-
NASDAQ
SIVB
-
NASDAQ
S V B Financial Group
BANKING - Regional - Pacific Banks
|
$665.56
|
+5.71
0.87% |
$679.00
|
258,439
65.43% of 50 DAV
50 DAV is 395,000
|
$677.14
-1.71%
|
8/6/2021
|
$589.70
|
PP = $608.94
|
|
MB = $639.39
|
Most Recent Note - 10/5/2021 5:55:58 PM
G - Hovering near its all-time high, extended from the previously noted base. Prior highs in the $608 area define initial support to watch above its 50 DMA line ($589). Completed a new Public Offering on 8/11/21.
>>> FEATURED STOCK ARTICLE : Pullback After 5 Straight Gains into New High Territory - 9/28/2021 |
View all notes |
Set NEW NOTE alert |
Company Profile |
SEC
News |
Chart |
Request a new note
C
A
S
I |
BLDR
-
NYSE
Builders Firstsource Inc
Bldg-Constr Prds/Misc
|
$54.75
|
+1.61
3.03% |
$55.50
|
1,452,940
70.09% of 50 DAV
50 DAV is 2,073,000
|
$55.54
-1.42%
|
8/12/2021
|
$52.38
|
PP = $54.09
|
|
MB = $56.79
|
 Most Recent Note - 10/7/2021 5:49:13 PM
Y - Posted a 3rd consecutive gain today with light volume for its 2nd best ever close. Its 50 DMA line ($51.50) defines important near term support. Subsequent gains for new highs backed by at least +40% above average volume may clinch a proper technical buy signal. Fundamentals remain strong.
>>> FEATURED STOCK ARTICLE : Sputtering After Wedging to New Highs - 10/1/2021 |
View all notes |
Set NEW NOTE alert |
Company Profile |
SEC
News |
Chart |
Request a new note
C
A
S
I |
CROX
-
NASDAQ
Crocs Inc
CONSUMER NON-DURABLES - Textile - Apparel Footwear
|
$139.54
|
+1.23
0.89% |
$142.74
|
1,069,250
79.56% of 50 DAV
50 DAV is 1,344,000
|
$163.18
-14.49%
|
6/14/2021
|
$112.64
|
PP = $110.01
|
|
MB = $115.51
|
Most Recent Note - 10/4/2021 5:26:01 PM
G - Pulled back from its all-time high with 7 consecutive losses violating its 50 DMA line ($143). The prior low ($132.60) defines the next important support where a violation may raise more serious concerns and trigger a worrisome technical sell signal. See the latest FSU analysis for more details and a new annotated graph.
>>> FEATURED STOCK ARTICLE : Streak of Losses Violated 50-day Moving Average Line - 10/4/2021 |
View all notes |
Set NEW NOTE alert |
Company Profile |
SEC
News |
Chart |
Request a new note
C
A
S
I |
KFRC
-
NASDAQ
Kforce Inc
Comml Svcs-Staffing
|
$67.11
|
+3.21
5.02% |
$67.22
|
185,975
163.14% of 50 DAV
50 DAV is 114,000
|
$64.43
4.16%
|
9/10/2021
|
$59.53
|
PP = $64.48
|
|
MB = $67.70
|
Most Recent Note - 10/7/2021 12:28:12 PM
Y - Hitting a new all-time high with today's gain. Previously noted - "Subsequent gains above its pivot point backed by at least +40% above average volume are needed to trigger a proper technical buy signal. Fundamentals are strong."
>>> FEATURED STOCK ARTICLE : Staffing Firm Still Faces Some Overhead Supply - 9/13/2021 |
View all notes |
Set NEW NOTE alert |
Company Profile |
SEC
News |
Chart |
Request a new note
C
A
S
I |
GNRC
-
NYSE
Generac Hldgs Inc
Electrical-Power/Equipmt
|
$417.58
|
+12.41
3.06% |
$422.50
|
464,297
65.03% of 50 DAV
50 DAV is 714,000
|
$466.92
-10.57%
|
8/30/2021
|
$449.36
|
PP = $457.10
|
|
MB = $479.96
|
Most Recent Note - 10/7/2021 5:59:02 PM
G - Rebounded toward its 50 DMA line ($423.46) which may act as resistance after damaging volume-driven losses. A rebound above the 50 DMA line is needed for its outlook to improve. See the latest FSU analysis for more details and an annotated graph.
>>> FEATURED STOCK ARTICLE : Prior Lows Define Near-Term Support After 50 DMA Violation - 10/6/2021 |
View all notes |
Set NEW NOTE alert |
Company Profile |
SEC
News |
Chart |
Request a new note
C
A
S
I |
Symbol/Exchange
Company Name
Industry Group |
PRICE |
CHANGE
(%Change) |
Day High |
Volume
(% DAV)
(% 50 day avg vol) |
52 Wk Hi
% From Hi |
Featured
Date |
Price
Featured |
Pivot Featured |
|
Max Buy |
CAMT
-
NASDAQ
Camtek Ltd
ELECTRONICS - Scientific and Technical Instrum
|
$39.97
|
+1.29
3.34% |
$40.34
|
230,167
135.39% of 50 DAV
50 DAV is 170,000
|
$46.01
-13.13%
|
8/4/2021
|
$39.67
|
PP = $40.57
|
|
MB = $42.60
|
Most Recent Note - 10/7/2021 5:53:29 PM
G - Posted a volume-driven gain today halting its slide and finding prompt support near its 50 DMA line ($39.95). The prior low ($34.68 on 8/17/21) defines the next important near-term support to watch. Fundamentals remain strong. See the latest FSU analysis for more details and an annotated graph.
>>> FEATURED STOCK ARTICLE : Fell Below Prior High and Violated 50-Day Moving Average - 10/5/2021 |
View all notes |
Set NEW NOTE alert |
Company Profile |
SEC
News |
Chart |
Request a new note
C
A
S
I |
PKI
-
NYSE
Perkinelmer Inc
ELECTRONICS - Scientific and Technical Instrum
|
$171.00
|
+0.75
0.44% |
$174.20
|
491,206
68.80% of 50 DAV
50 DAV is 714,000
|
$192.00
-10.94%
|
8/18/2021
|
$181.07
|
PP = $188.50
|
|
MB = $197.93
|
Most Recent Note - 10/6/2021 5:11:34 PM
G - A rebound above the 50 DMA line ($182.65) is needed for its outlook to improve after damaging losses. Its Relative Strength Rating has slumped to 79. Fundamentals remain strong.
>>> FEATURED STOCK ARTICLE : Stalled But Holding Ground After Recent "3 Weeks Tight" - 9/17/2021 |
View all notes |
Set NEW NOTE alert |
Company Profile |
SEC
News |
Chart |
Request a new note
C
A
S
I |
UMC
-
NYSE
United Microelectrnc Adr
ELECTRONICS - Semiconductor - Integrated Cir
|
$10.96
|
+0.43
4.08% |
$11.11
|
9,477,780
126.20% of 50 DAV
50 DAV is 7,510,000
|
$12.62
-13.15%
|
8/5/2021
|
$11.62
|
PP = $11.38
|
|
MB = $11.95
|
Most Recent Note - 10/7/2021 5:55:19 PM
G - Gapped up today rebounding toward the 50 DMA line ($11.24) which may act as resistance. Gains above the 50 DMA line are needed for its outlook to improve.
>>> FEATURED STOCK ARTICLE : Consolidating Above 50-day Moving Average Near "Max Buy" Level - 9/27/2021 |
View all notes |
Set NEW NOTE alert |
Company Profile |
SEC
News |
Chart |
Request a new note
C
A
S
I |
BRKS
-
NASDAQ
Brooks Automation
ELECTRONICS - Semiconductor Equipment and Mate
|
$102.67
|
+2.01
2.00% |
$105.46
|
751,656
117.45% of 50 DAV
50 DAV is 640,000
|
$110.40
-7.00%
|
9/20/2021
|
$101.21
|
PP = $108.82
|
|
MB = $114.26
|
Most Recent Note - 10/7/2021 5:57:10 PM
Y - Posted a gain today with higher volume. Perched within striking distance of its 52-week high hit last week. Pivot point cited was based on its 4/27/21 high plus 10 cents. Subsequent gains above the pivot point backed by at least 40% above average volume may trigger a convincing technical buy signal.
>>> FEATURED STOCK ARTICLE : Rallying Near High After Brief Consolidation Below 200 DMA Line - 9/20/2021 |
View all notes |
Set NEW NOTE alert |
Company Profile |
SEC
News |
Chart |
Request a new note
C
A
S
I |
ENTG
-
NASDAQ
Entegris Inc
ELECTRONICS - Semiconductor Equipment and Mate
|
$121.75
|
+1.39
1.15% |
$123.03
|
473,023
66.86% of 50 DAV
50 DAV is 707,500
|
$135.99
-10.47%
|
8/4/2021
|
$125.33
|
PP = $126.51
|
|
MB = $132.84
|
Most Recent Note - 10/4/2021 5:41:12 PM
G - Violated its 50 DMA line ($121.75) wit today's volume driven loss triggering a technical sell signal. Only a prompt rebound above the 50 DMA line would help its outlook improve. Its prior low and 200 DMA line define the next important support in the $109 area.
>>> FEATURED STOCK ARTICLE : Hit New High and Rose Above its Max Buy Level - 9/23/2021 |
View all notes |
Set NEW NOTE alert |
Company Profile |
SEC
News |
Chart |
Request a new note
C
A
S
I |
Symbol/Exchange
Company Name
Industry Group |
PRICE |
CHANGE
(%Change) |
Day High |
Volume
(% DAV)
(% 50 day avg vol) |
52 Wk Hi
% From Hi |
Featured
Date |
Price
Featured |
Pivot Featured |
|
Max Buy |
CLFD
-
NASDAQ
Clearfield Inc
TELECOMMUNICATIONS - Cables / Satalite Equipment
|
$51.84
|
+1.80
3.60% |
$53.52
|
227,200
280.49% of 50 DAV
50 DAV is 81,000
|
$50.50
2.65%
|
7/23/2021
|
$40.23
|
PP = $43.74
|
|
MB = $45.93
|
Most Recent Note - 10/7/2021 12:20:32 PM
G - Hitting yet another new 52-week high with today's 6th consecutive gain lifting it further above its "max buy" level. Found prompt support near its 50 DMA line ($44.32) after testing the prior low ($42.34) where more damaging losses may trigger technical sell signals. Fundamentals remain strong.
>>> FEATURED STOCK ARTICLE : Quietly Consolidating Near All-Time High - 9/14/2021 |
View all notes |
Set NEW NOTE alert |
Company Profile |
SEC
News |
Chart |
Request a new note
C
A
S
I |
TGH
-
NYSE
Textainer Group Holdings
TRANSPORTATION - Logistics
|
$36.22
|
+0.28
0.78% |
$37.49
|
660,069
151.74% of 50 DAV
50 DAV is 435,000
|
$37.88
-4.38%
|
10/7/2021
|
$36.97
|
PP = $36.80
|
|
MB = $38.64
|
Most Recent Note - 10/7/2021 5:44:35 PM
Y - Finished near the session low today after churning above average volume. Color code was changed to yellow in the earlier mid-day report with pivot point cited based on its 9/29/21 high while building on a cup-with-handle base. It is perched within close striking distance of its 52-week high after finding prompt support near its 50 DMA line ($33.73) during an orderly consolidation. Subsequent gains above the pivot point backed by at least +40% above average volume may trigger a proper technical buy signal. Reported Jun '21 quarterly earnings +429% on +29% sales revenues versus the year ago period, its 5th strong earnings comparison. Sales revenues growth has been improving and accelerating in the 3 latest quarterly comparisons after years of sub-par and negative comparisons, not a match with with regard to the fact-based investment system's fundamental guidelines. Annual earnings (A criteria) history has been strong after a downturn and loss in FY '16. See the latest FSU analysis for more details and an annotated graph.
There are no Featured Stock Updates™ available for this stock at this time. You may request one by clicking the Request a New Note link below |
View all notes |
Set NEW NOTE alert |
Company Profile |
SEC
News |
Chart |
Request a new note
C
A
S
I |
SMPL
-
NASDAQ
Simply Good Foods Co
Food-Confectionery
|
$36.21
|
+0.32
0.89% |
$36.87
|
296,176
89.59% of 50 DAV
50 DAV is 330,600
|
$38.50
-5.95%
|
12/28/2020
|
$30.40
|
PP = $31.44
|
|
MB = $33.01
|
Most Recent Note - 10/6/2021 5:13:28 PM
G - Posted a quiet gain today, rebounding above its 50 DMA line ($35.50) which recently has acted as resistance. Its Relative strength Rating has slumped to 79. Recent low ($33.55 on 9/20/21) and 200 DMA line define important support where more damaging losses would raise greater concerns. Fundamentals remain strong.
>>> FEATURED STOCK ARTICLE : Still Lingering Below 50-Day Moving Average Line - 8/30/2021 |
View all notes |
Set NEW NOTE alert |
Company Profile |
SEC
News |
Chart |
Request a new note
C
A
S
I |
WDAY
-
NYSE
Workday Inc Cl A
Computer Sftwr-Enterprse
|
$257.86
|
+1.53
0.60% |
$262.20
|
778,321
49.76% of 50 DAV
50 DAV is 1,564,200
|
$282.77
-8.81%
|
9/7/2021
|
$275.69
|
PP = $282.87
|
|
MB = $297.01
|
Most Recent Note - 10/5/2021 5:58:40 PM
Y - Consolidating near its 50 DMA line ($252). More damaging losses below recent lows ($246) would raise greater concerns. Faces resistance due to overhead supply up to the $278 level after trading higher for the past month. Fundamentals remain strong.
>>> FEATURED STOCK ARTICLE : Gap Up and Recent Gains Challenge All-Time High - 9/7/2021 |
View all notes |
Set NEW NOTE alert |
Company Profile |
SEC
News |
Chart |
Request a new note
C
A
S
I |
CTLT
-
NYSE
Catalent Inc
DRUGS - Biotechnology
|
$131.04
|
+1.68
1.30% |
$133.95
|
640,197
70.35% of 50 DAV
50 DAV is 910,000
|
$142.64
-8.13%
|
8/25/2021
|
$128.72
|
PP = $127.78
|
|
MB = $134.17
|
Most Recent Note - 10/5/2021 5:53:02 PM
Y - Color code is changed to yellow while consolidating after volume-driven losses. Its 50 DMA line ($129) and prior highs in the $124-127 area define important near-term support to watch. Fundamentals remain strong.
>>> FEATURED STOCK ARTICLE : Strong Gain Triggered Technical Buy Signal - 8/25/2021 |
View all notes |
Set NEW NOTE alert |
Company Profile |
SEC
News |
Chart |
Request a new note
C
A
S
I |
Symbol/Exchange
Company Name
Industry Group |
PRICE |
CHANGE
(%Change) |
Day High |
Volume
(% DAV)
(% 50 day avg vol) |
52 Wk Hi
% From Hi |
Featured
Date |
Price
Featured |
Pivot Featured |
|
Max Buy |
MEDP
-
NASDAQ
Medpace Holdings Inc
Medical-Research Eqp/Svc
|
$193.16
|
+0.66
0.34% |
$196.14
|
159,651
94.47% of 50 DAV
50 DAV is 169,000
|
$199.04
-2.95%
|
9/10/2021
|
$196.32
|
PP = $196.22
|
|
MB = $206.03
|
Most Recent Note - 10/7/2021 6:05:57 PM
Y - Still hovering near its 52-week high. Found prompt support near its 50 DMA line ($184). Highlighted in yellow with pivot point cited based on its 4/26/21 high plus 10 cents in the 9/10/21 mid-day report. Subsequent gains and strong close above the pivot point backed by at least +40% above average volume may trigger a technical buy signal.
>>> FEATURED STOCK ARTICLE : Negative Reversal Indicative of Distributional Pressure - 9/10/2021 |
View all notes |
Set NEW NOTE alert |
Company Profile |
SEC
News |
Chart |
Request a new note
C
A
S
I |
JEF
-
NYSE
Jefferies Financial Grp
Finance-Invest Bnk/Bkrs
|
$39.28
|
+0.43
1.11% |
$39.61
|
1,898,744
115.64% of 50 DAV
50 DAV is 1,642,000
|
$38.97
0.80%
|
6/28/2021
|
$31.81
|
PP = $34.42
|
|
MB = $36.14
|
Most Recent Note - 10/7/2021 6:02:40 PM
G - Posted a 5th consecutive gain today for a new all-time high. Its 50 DMA line ($36.16) defines important near-term support to watch on pullbacks. Reported Aug '21 quarterly earnings +713% on +70% sales revenues versus the year ago period.
>>> FEATURED STOCK ARTICLE : Perched at 52-week High With Earnings News Due - 9/29/2021 |
View all notes |
Set NEW NOTE alert |
Company Profile |
SEC
News |
Chart |
Request a new note
C
A
S
I |
AVTR
-
NYSE
Avantor Inc
Medical-Research Eqp/Svc
|
$40.98
|
+0.25
0.61% |
$41.51
|
1,590,158
41.62% of 50 DAV
50 DAV is 3,821,000
|
$44.37
-7.64%
|
6/10/2021
|
$32.94
|
PP = $34.09
|
|
MB = $35.79
|
Most Recent Note - 10/7/2021 6:04:18 PM
G - Volume totals have been cooling while still finding support above its 50 DMA line ($40.26). A damaging violation may trigger a technical sell signal. Completed a Secondary Offering on 9/13/21 while perched at its all-time high, very extended from any sound base.
>>> FEATURED STOCK ARTICLE : Steady Progress Made Since Featured - 8/27/2021 |
View all notes |
Set NEW NOTE alert |
Company Profile |
SEC
News |
Chart |
Request a new note
C
A
S
I |
MIME
-
NASDAQ
Mimecast Limited
Computer Sftwr-Security
|
$64.32
|
+0.50
0.78% |
$65.89
|
562,283
55.89% of 50 DAV
50 DAV is 1,006,000
|
$71.45
-9.98%
|
8/2/2021
|
$56.12
|
PP = $59.58
|
|
MB = $62.56
|
Most Recent Note - 10/5/2021 5:54:29 PM
G - Consolidating near its 50 DMA line ($63.50) and above prior highs in the $59 area defining near-term support to watch. Fundamentals remain strong.
>>> FEATURED STOCK ARTICLE : Consolidating After Getting Extended from Previous Base Noted - 9/21/2021 |
View all notes |
Set NEW NOTE alert |
Company Profile |
SEC
News |
Chart |
Request a new note
C
A
S
I |
|
|
|
THESE ARE NOT BUY RECOMMENDATIONS!
Comments contained in the body of this report are technical
opinions only. The material herein has been obtained
from sources believed to be reliable and accurate, however,
its accuracy and completeness cannot be guaranteed.
This site is not an investment advisor, hence it does
not endorse or recommend any securities or other investments.
Any recommendation contained in this report may not
be suitable for all investors and it is not to be deemed
an offer or solicitation on our part with respect to
the purchase or sale of any securities. All trademarks,
service marks and trade names appearing in this report
are the property of their respective owners, and are
likewise used for identification purposes only.
This report is a service available
only to active Paid Premium Members.
You may opt-out of receiving report notifications
at any time. Questions or comments may be submitted
by writing to Premium Membership Services 665 S.E. 10 Street, Suite 201 Deerfield Beach, FL 33441-5634 or by calling 1-800-965-8307
or 954-785-1121.
|
|
|