***Last / Change / Volume data in this table is the closing quote data***
Symbol/Exchange
Company Name
Industry Group |
PRICE |
CHANGE
(%Change) |
Day High |
Volume
(% DAV)
(% 50 day avg vol) |
52 Wk Hi
% From Hi |
Featured
Date |
Price
Featured |
Pivot Featured |
|
Max Buy |
OSBC
-
NASDAQ
Old Second Bancorp Inc
BANKING - Regional - Midwest Banks
|
$15.40
|
-0.20
-1.28% |
$15.60
|
112,903
198.08% of 50 DAV
50 DAV is 57,000
|
$15.60
-1.28%
|
5/21/2018
|
$15.50
|
PP = $15.10
|
|
MB = $15.86
|
Most Recent Note - 6/19/2018 5:36:39 PM
Y - Still quietly hovering near its high. Stalled after highlighted in yellow on 5/21/18 with pivot point cited based on prior highs plus 10 cents. Fundamentals remain strong.
>>> FEATURED STOCK ARTICLE : Hit New High Today After Orderly Consolidation - 5/21/2018 |
View all notes |
Set NEW NOTE alert |
Company Profile |
SEC
News |
Chart |
Request a new note
C
A
S
I |
PFBC
-
NASDAQ
Preferred Bank Los Angls
BANKING - Regional - Pacific Banks
|
$65.13
|
-1.08
-1.63% |
$66.20
|
96,810
132.62% of 50 DAV
50 DAV is 73,000
|
$67.88
-4.05%
|
5/18/2018
|
$62.91
|
PP = $67.75
|
|
MB = $71.14
|
Most Recent Note - 6/18/2018 5:29:58 PM
Y - Found support at its 50 DMA line ($64.82). Its Relative Strength rating is still below the 80+ minimum guideline at 74, yet it ended only -2% off its high. Subsequent gains above the pivot point are needed to trigger a technical buy signal.
>>> FEATURED STOCK ARTICLE : Some Technical Sputtering Yet Bank is Still Only -7% Off High - 5/18/2018 |
View all notes |
Set NEW NOTE alert |
Company Profile |
SEC
News |
Chart |
Request a new note
C
A
S
I |
SIVB
-
NASDAQ
S V B Financial Group
BANKING - Regional - Pacific Banks
|
$316.08
|
-2.40
-0.75% |
$321.10
|
316,710
60.56% of 50 DAV
50 DAV is 523,000
|
$329.65
-4.12%
|
3/12/2018
|
$267.79
|
PP = $263.19
|
|
MB = $276.35
|
Most Recent Note - 6/18/2018 5:31:46 PM
G - Hovering near its all-time high extended from any sound base. Its 50 DMA line ($297) defines near-term support to watch on pullbacks. Fundamentals are strong.
>>> FEATURED STOCK ARTICLE : Wedging Higher Following Big Breakaway Gap - 5/22/2018 |
View all notes |
Set NEW NOTE alert |
Company Profile |
SEC
News |
Chart |
Request a new note
C
A
S
I |
UCFC
-
NASDAQ
United Community Finl Cp
BANKING - Savings and Loans
|
$11.30
|
-0.18
-1.57% |
$11.54
|
335,916
230.08% of 50 DAV
50 DAV is 146,000
|
$11.59
-2.50%
|
5/30/2018
|
$10.50
|
PP = $10.80
|
|
MB = $11.34
|
 Most Recent Note - 6/21/2018 6:02:44 PM
Y - It is perched near its "max buy" level after pulling back from its all-time high with 2 consecutive volume-driven losses. Prior high ($10.70 on 4/19/18) and its 50 DMA line ($10.53) define near-term support to watch.
>>> FEATURED STOCK ARTICLE : Small Savings & Loan Perched Near High - 5/30/2018 |
View all notes |
Set NEW NOTE alert |
Company Profile |
SEC
News |
Chart |
Request a new note
C
A
S
I |
EPAM
-
NYSE
Epam Systems Inc
COMPUTER SOFTWARE and SERVICES - Information Technology Service
|
$119.95
|
-2.19
-1.79% |
$122.48
|
473,390
167.87% of 50 DAV
50 DAV is 282,000
|
$131.75
-8.96%
|
5/9/2018
|
$120.34
|
PP = $125.98
|
|
MB = $132.28
|
Most Recent Note - 6/19/2018 5:29:19 PM
Y - Consolidating above near-term support defined by its 50 DMA line ($121.03) and prior low ($121.23 on 5/29/18). Subsequent losses leading to violations would raise concerns and trigger technical sell signals.
>>> FEATURED STOCK ARTICLE : Volume-Driven Gain Challenged Prior High Following Earnings - 5/9/2018 |
View all notes |
Set NEW NOTE alert |
Company Profile |
SEC
News |
Chart |
Request a new note
C
A
S
I |
Symbol/Exchange
Company Name
Industry Group |
PRICE |
CHANGE
(%Change) |
Day High |
Volume
(% DAV)
(% 50 day avg vol) |
52 Wk Hi
% From Hi |
Featured
Date |
Price
Featured |
Pivot Featured |
|
Max Buy |
FLT
-
NYSE
Fleetcor Technologies
DIVERSIFIED SERVICES - Business/Management Services
|
$218.82
|
-2.90
-1.31% |
$222.92
|
1,330,335
113.61% of 50 DAV
50 DAV is 1,171,000
|
$222.88
-1.82%
|
6/18/2018
|
$219.31
|
PP = $213.84
|
|
MB = $224.53
|
Most Recent Note - 6/20/2018 12:33:44 PM
Y - Holding its ground stubbornly. Finished strong after highlighted in yellow in the 6/18/18 mid-day report with pivot point cited based on its 1/25/18 high plus 10 cents. A "breakaway gap" and considerable volume-driven gain triggered a technical buy signal while clearing previously stubborn resistance in the $212-213 area. See the latest FSU analysis for more details and an annotated graph.
>>> FEATURED STOCK ARTICLE : Breakaway Gap With Heavy Volume - 6/18/2018 |
View all notes |
Set NEW NOTE alert |
Company Profile |
SEC
News |
Chart |
Request a new note
C
A
S
I |
MA
-
NYSE
Mastercard Inc Cl A
Finance-CrdtCard/PmtPr
|
$200.78
|
-0.76
-0.38% |
$203.68
|
2,677,784
74.86% of 50 DAV
50 DAV is 3,577,000
|
$204.00
-1.58%
|
5/2/2018
|
$184.96
|
PP = $183.83
|
|
MB = $193.02
|
Most Recent Note - 6/20/2018 6:16:31 PM
G - Still hovering in a tight range near its all-time high. Its 50 DMA line (188.86) and prior low ($186.60 on 5/29/18) define support to watch on pullbacks. See the latest FSU analysis for more details and a new annotated graph.
>>> FEATURED STOCK ARTICLE : Extended From Prior Base and Perched at All-Time High - 6/20/2018 |
View all notes |
Set NEW NOTE alert |
Company Profile |
SEC
News |
Chart |
Request a new note
C
A
S
I |
V
-
NYSE
Visa Inc Cl A
Finance-CrdtCard/PmtPr
|
$134.53
|
-0.97
-0.72% |
$136.12
|
8,683,314
121.60% of 50 DAV
50 DAV is 7,141,000
|
$136.69
-1.58%
|
4/26/2018
|
$126.68
|
PP = $126.98
|
|
MB = $133.33
|
Most Recent Note - 6/18/2018 5:33:15 PM
G - Posted a volume-driven gain today for its second best close of all time. Prior highs in the $126 area and its 50 DMA line ($129) define near-term support to watch on pullbacks.
>>> FEATURED STOCK ARTICLE : Encountered Distributional Pressure at All-Time High - 6/11/2018 |
View all notes |
Set NEW NOTE alert |
Company Profile |
SEC
News |
Chart |
Request a new note
C
A
S
I |
BRKS
-
NASDAQ
Brooks Automation
ELECTRONICS - Semiconductor Equipment and Mate
|
$34.44
|
-0.58
-1.66% |
$35.37
|
497,249
76.27% of 50 DAV
50 DAV is 652,000
|
$36.45
-5.51%
|
6/15/2018
|
$35.44
|
PP = $34.87
|
|
MB = $36.61
|
Most Recent Note - 6/18/2018 12:25:46 PM
Y - Pulling back today. First featured in the 6/15/18 mid-day report as it clinched a technical buy signal. See the latest FSU analysis for more details and an annotated graph.
>>> FEATURED STOCK ARTICLE : Volume Was Heavy Behind Big Breakout Gain - 6/15/2018 |
View all notes |
Set NEW NOTE alert |
Company Profile |
SEC
News |
Chart |
Request a new note
C
A
S
I |
ENV
-
NYSE
Envestnet Inc
FINANCIAL SERVICES - Diversified Investments
|
$58.10
|
-0.60
-1.02% |
$58.80
|
484,556
144.38% of 50 DAV
50 DAV is 335,600
|
$60.28
-3.61%
|
6/15/2018
|
$57.85
|
PP = $60.37
|
|
MB = $63.39
|
Most Recent Note - 6/21/2018 12:29:49 PM
Y - Encountering some distributional pressure and churning above average volume while perched near its all-time high. Members were reminded - "Subsequent volume-driven gains for new highs may clinch a more convincing technical buy signal. See the latest FSU analysis for more details and a new annotated graph."
>>> FEATURED STOCK ARTICLE : Gain With Above Average Volume Challenged Prior High - 6/19/2018 |
View all notes |
Set NEW NOTE alert |
Company Profile |
SEC
News |
Chart |
Request a new note
C
A
S
I |
Symbol/Exchange
Company Name
Industry Group |
PRICE |
CHANGE
(%Change) |
Day High |
Volume
(% DAV)
(% 50 day avg vol) |
52 Wk Hi
% From Hi |
Featured
Date |
Price
Featured |
Pivot Featured |
|
Max Buy |
TPL
-
NYSE
Texas Pacific Land Trust
Real Estate Dvlpmt/Ops
|
$701.39
|
-3.74
-0.53% |
$701.39
|
10,929
54.65% of 50 DAV
50 DAV is 20,000
|
$739.89
-5.20%
|
4/13/2018
|
$547.85
|
PP = $552.10
|
|
MB = $579.71
|
Most Recent Note - 6/21/2018 5:59:49 PM
G - Volume totals have been cooling while stubbornly holding its ground perched near its all-time high. Its 50 DMA line ($640) defines important support to watch above the prior highs in the $569-552 area.
>>> FEATURED STOCK ARTICLE : Negative Reversal on Higher Volume After Hitting New All-Time High - 6/4/2018 |
View all notes |
Set NEW NOTE alert |
Company Profile |
SEC
News |
Chart |
Request a new note
C
A
S
I |
STMP
-
NASDAQ
Stamps.com Inc
Retail-Internet
|
$251.85
|
-28.45
-10.15% |
$281.66
|
1,340,436
452.85% of 50 DAV
50 DAV is 296,000
|
$285.75
-11.86%
|
5/4/2018
|
$234.15
|
PP = $233.23
|
|
MB = $244.89
|
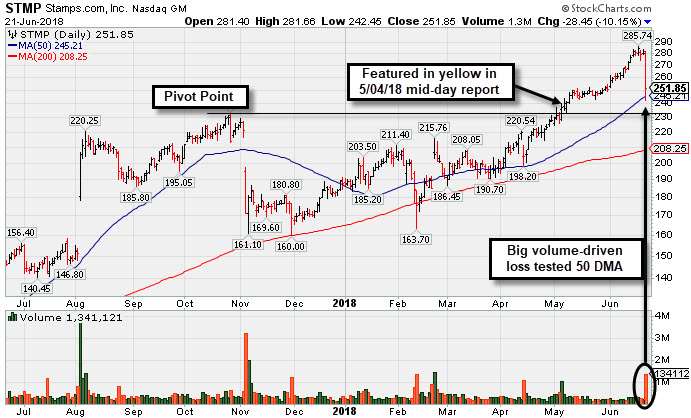
Most Recent Note - 6/21/2018 5:54:06 PM
G - Ended down considerably with heavy volume behind a big loss testing its 50 DMA line ($245). Below that important short-term average prior highs in the $233 area which define support to watch on pullbacks. See the latest FSU analysis for more details and a new annotated graph.
>>> FEATURED STOCK ARTICLE : Big Loss on Heavy Volume Tests 50-Day Moving Average - 6/21/2018 |
View all notes |
Set NEW NOTE alert |
Company Profile |
SEC
News |
Chart |
Request a new note
C
A
S
I |
CHDN
-
NASDAQ
Churchill Downs Inc
LEISURE - Gaming Activities
|
$299.40
|
-0.95
-0.32% |
$301.55
|
56,304
55.20% of 50 DAV
50 DAV is 102,000
|
$314.60
-4.83%
|
6/20/2018
|
$285.80
|
PP = $314.70
|
|
MB = $330.44
|
Most Recent Note - 6/20/2018 4:37:01 PM
Y - Volume totals have been cooling while consolidating in a tight range. Color code is changed to yellow with new pivot point cited based on its 5/16/18 high plus 10 cents. Its 50 DMA line ($284) and prior high ($285.70 on 4/26/18) define near-term support to watch.
>>> FEATURED STOCK ARTICLE : Breakout Followed New Supreme Court Ruling on Sports Betting - 5/14/2018 |
View all notes |
Set NEW NOTE alert |
Company Profile |
SEC
News |
Chart |
Request a new note
C
A
S
I |
HTHT
-
NASDAQ
Huazhu Group Ads
LEISURE - Lodging
|
$47.16
|
-0.96
-2.00% |
$48.18
|
2,040,728
92.05% of 50 DAV
50 DAV is 2,217,000
|
$49.60
-4.92%
|
5/15/2018
|
$34.52
|
PP = $41.57
|
|
MB = $43.65
|
Most Recent Note - 6/19/2018 5:39:40 PM
G - Gapped down today retreating from its all-time high. Extended from prior highs in the $40-41 area which define initial support to watch on pullbacks. Recently changed its name from China Lodging Group, Ltd to Huazhu Group Ltd.
>>> FEATURED STOCK ARTICLE : New Volume-Driven Breakout For All-Time High - 5/15/2018 |
View all notes |
Set NEW NOTE alert |
Company Profile |
SEC
News |
Chart |
Request a new note
C
A
S
I |
NFLX
-
NASDAQ
Netflix Inc
SPECIALTY RETAIL - Music and Video Stores
|
$415.44
|
-1.32
-0.32% |
$423.21
|
18,037,793
195.26% of 50 DAV
50 DAV is 9,238,000
|
$419.47
-0.96%
|
5/24/2018
|
$348.85
|
PP = $338.92
|
|
MB = $355.87
|
Most Recent Note - 6/21/2018 1:13:20 PM
G - Churning heavy volume today while perched at its all-time high. Disciplined investors avoid chasing stocks extended more that +5% above a sound base pattern. Its 50 DMA line ($342) and prior highs in the $338-333 area define important support to watch on pullbacks.
>>> FEATURED STOCK ARTICLE : Rally From Advanced Ascending Base With Volume +50% - 5/24/2018 |
View all notes |
Set NEW NOTE alert |
Company Profile |
SEC
News |
Chart |
Request a new note
C
A
S
I |
Symbol/Exchange
Company Name
Industry Group |
PRICE |
CHANGE
(%Change) |
Day High |
Volume
(% DAV)
(% 50 day avg vol) |
52 Wk Hi
% From Hi |
Featured
Date |
Price
Featured |
Pivot Featured |
|
Max Buy |
DPZ
-
NYSE
Dominos Pizza Inc
Retail-Restaurants
|
$290.76
|
+2.86
0.99% |
$292.67
|
775,650
134.90% of 50 DAV
50 DAV is 575,000
|
$290.02
0.26%
|
5/21/2018
|
$248.13
|
PP = $255.10
|
|
MB = $267.86
|
Most Recent Note - 6/19/2018 5:46:27 PM
G - Hit another new high with today's 6th consecutive gain, getting very extended from the latest base. Its prior high ($255 on 4/26/18) and 50 DMA line ($250.85) define important near-term support to watch on pullbacks.
>>> FEATURED STOCK ARTICLE : New High With Gain Backed by Above Average Volume - 6/5/2018 |
View all notes |
Set NEW NOTE alert |
Company Profile |
SEC
News |
Chart |
Request a new note
C
A
S
I |
FIVE
-
NASDAQ
Five Below Inc
Retail-DiscountandVariety
|
$97.46
|
-0.02
-0.02% |
$98.79
|
886,467
52.08% of 50 DAV
50 DAV is 1,702,000
|
$103.99
-6.28%
|
6/4/2018
|
$75.96
|
PP = $78.38
|
|
MB = $82.30
|
Most Recent Note - 6/15/2018 6:05:33 PM
G - Pulled back on higher (near average) volume today, and it remains near its all-time high very extended from the previously noted base. Reported earnings +133% on +27% sales revenues for the Apr '18 quarter. Disciplined investors avoid chasing stocks that are too extended from a sound base.
>>> FEATURED STOCK ARTICLE : Trading Near 50-Day Average After Falling Into Prior Base - 5/7/2018 |
View all notes |
Set NEW NOTE alert |
Company Profile |
SEC
News |
Chart |
Request a new note
C
A
S
I |
NOW
-
NYSE
Servicenow Inc
Computer Sftwr-Enterprse
|
$180.27
|
-4.49
-2.43% |
$186.57
|
1,289,194
69.84% of 50 DAV
50 DAV is 1,846,000
|
$188.59
-4.41%
|
5/8/2018
|
$174.63
|
PP = $176.66
|
|
MB = $185.49
|
Most Recent Note - 6/21/2018 5:58:39 PM
Y - Recently challenged and traded above its "max buy" level, but it pulled back on light volume today. Its 50 DMA line ($174) and prior low define near-term support.
>>> FEATURED STOCK ARTICLE : High-Ranked Software - Enterprise Firm is Near Pivot Point - 5/8/2018 |
View all notes |
Set NEW NOTE alert |
Company Profile |
SEC
News |
Chart |
Request a new note
C
A
S
I |
NVEE
-
NASDAQ
N V 5 Global Inc
Comml Svcs-Consulting
|
$68.15
|
-1.85
-2.64% |
$70.10
|
59,773
74.72% of 50 DAV
50 DAV is 80,000
|
$71.90
-5.22%
|
6/15/2018
|
$7,070.00
|
PP = $72.00
|
|
MB = $75.60
|
Most Recent Note - 6/21/2018 6:08:54 PM
Y - Pulled back today with below average volume. Recent gains challenged its all-time high. Color code was changed to yellow with new pivot point cited based on its 5/04/18 high plus 10 cents. Confirming gains above the pivot point backed by at least +40% above average volume may trigger a technical buy signal. Its 50 DMA line ($62.36) defines near-term support above the prior low ($56.65 on 5/15/18).
>>> FEATURED STOCK ARTICLE : Encountered Distributional Pressure After Hitting New High - 5/11/2018 |
View all notes |
Set NEW NOTE alert |
Company Profile |
SEC
News |
Chart |
Request a new note
C
A
S
I |
PANW
-
NYSE
Palo Alto Networks
Computer Sftwr-Security
|
$212.70
|
-2.74
-1.27% |
$216.54
|
902,998
65.29% of 50 DAV
50 DAV is 1,383,000
|
$217.40
-2.16%
|
6/12/2018
|
$206.55
|
PP = $214.69
|
|
MB = $225.42
|
Most Recent Note - 6/20/2018 4:43:54 PM
Y - Posted a gain today with light volume for its second best close ever. Found support at its 10-week moving average following a "negative reversal" on 6/04/18 after an earlier breakout.
>>> FEATURED STOCK ARTICLE : New High Close After 2 Consecutive Volume Driven Gains - 6/13/2018 |
View all notes |
Set NEW NOTE alert |
Company Profile |
SEC
News |
Chart |
Request a new note
C
A
S
I |
Symbol/Exchange
Company Name
Industry Group |
PRICE |
CHANGE
(%Change) |
Day High |
Volume
(% DAV)
(% 50 day avg vol) |
52 Wk Hi
% From Hi |
Featured
Date |
Price
Featured |
Pivot Featured |
|
Max Buy |
QLYS
-
NASDAQ
Qualys Inc
Computer Sftwr-Security
|
$94.80
|
-1.10
-1.15% |
$96.28
|
350,350
100.10% of 50 DAV
50 DAV is 350,000
|
$97.75
-3.02%
|
4/17/2018
|
$82.85
|
PP = $79.50
|
|
MB = $83.48
|
Most Recent Note - 6/21/2018 5:55:43 PM
G - Holding its ground stubbornly, perched near its all-time high, very extended from any sound base. Prior highs and its 50 DMA line ($80.58) define near-term support to watch on pullbacks.
>>> FEATURED STOCK ARTICLE : Rebounded Above 50-Day Average Yet Still Faces Overhead Supply - 5/29/2018 |
View all notes |
Set NEW NOTE alert |
Company Profile |
SEC
News |
Chart |
Request a new note
C
A
S
I |
SPLK
-
NASDAQ
Splunk Inc
Computer Sftwr-Database
|
$113.17
|
-2.70
-2.33% |
$116.94
|
1,106,643
65.99% of 50 DAV
50 DAV is 1,677,000
|
$121.64
-6.96%
|
5/8/2018
|
$113.14
|
PP = $112.76
|
|
MB = $118.40
|
Most Recent Note - 6/20/2018 4:40:58 PM
Y - Quietly perched near its all-time high and no resistance remains due to overhead supply. Its 50 DMA line ($110.98) and recent low ($107.08 on 5/29/18) define important near-term support to watch on pullbacks.
>>> FEATURED STOCK ARTICLE : Consolidating Near High Following Latest Financial Report - 5/31/2018 |
View all notes |
Set NEW NOTE alert |
Company Profile |
SEC
News |
Chart |
Request a new note
C
A
S
I |
SUPN
-
NASDAQ
Supernus Pharmaceuticals
Medical-Biomed/Biotech
|
$58.35
|
+0.30
0.52% |
$61.10
|
1,861,013
239.51% of 50 DAV
50 DAV is 777,000
|
$59.05
-1.19%
|
6/20/2018
|
$58.05
|
PP = $59.15
|
|
MB = $62.11
|
Most Recent Note - 6/21/2018 1:27:23 PM
Y - Erased much of its early gain after hitting a new high today. New pivot point was cited based on its 5/16/18 high plus 10 cents. Gains and a close above the pivot point backed by at least +40% above average volume may trigger a new (or add-on) technical buy signal. Stayed well above its 50 DMA line ($52.13) and prior highs in the $49-50 area during an orderly consolidation.
>>> FEATURED STOCK ARTICLE : Extended From Prior Base After Spiking Higher - 6/6/2018 |
View all notes |
Set NEW NOTE alert |
Company Profile |
SEC
News |
Chart |
Request a new note
C
A
S
I |
PAYC
-
NYSE
Paycom Software Inc
COMPUTER SOFTWARE and SERVICES - Application Software
|
$109.83
|
-2.82
-2.50% |
$113.36
|
849,176
113.07% of 50 DAV
50 DAV is 751,000
|
$118.45
-7.28%
|
6/19/2018
|
$113.68
|
PP = $118.55
|
|
MB = $124.48
|
Most Recent Note - 6/19/2018 5:34:50 PM
Y - Color code is changed to yellow with new pivot point cited based on its 4/18/18 high plus 10 cents. Subsequent gains above the pivot point backed by at least +40% above average volume are needed to trigger a proper technical buy signal. Consolidating above its 50 DMA line ($108.67), it faces little resistance due to overhead supply up to the $118 level. Found prompt support near prior lows in the $101 area.
>>> FEATURED STOCK ARTICLE : Violation of 50-Day Average Triggered Technical Sell Signal - 5/3/2018 |
View all notes |
Set NEW NOTE alert |
Company Profile |
SEC
News |
Chart |
Request a new note
C
A
S
I |
GRUB
-
NYSE
Grubhub Inc
INTERNET - Content
|
$110.48
|
-3.00
-2.64% |
$114.16
|
2,129,215
147.86% of 50 DAV
50 DAV is 1,440,000
|
$120.07
-7.99%
|
5/30/2018
|
$107.56
|
PP = $105.68
|
|
MB = $110.96
|
Most Recent Note - 6/21/2018 6:05:59 PM
Y - Color code is changed to yellow after pulling back below its "max buy" level retreating from its all-time high with 5 consecutive volume-driven losses. Prior highs in the $112-106 area define initial support above its 50 DMA line ($104.28)
>>> FEATURED STOCK ARTICLE : Gain With +25% Above Average Volume for Best Ever Close - 6/12/2018 |
View all notes |
Set NEW NOTE alert |
Company Profile |
SEC
News |
Chart |
Request a new note
C
A
S
I |
Symbol/Exchange
Company Name
Industry Group |
PRICE |
CHANGE
(%Change) |
Day High |
Volume
(% DAV)
(% 50 day avg vol) |
52 Wk Hi
% From Hi |
Featured
Date |
Price
Featured |
Pivot Featured |
|
Max Buy |
HQY
-
NASDAQ
Healthequity Inc
COMPUTER SOFTWARE and SERVICES - Healthcare Information Service
|
$80.46
|
-0.90
-1.11% |
$81.04
|
298,385
58.97% of 50 DAV
50 DAV is 506,000
|
$82.04
-1.93%
|
5/2/2018
|
$66.31
|
PP = $68.85
|
|
MB = $72.29
|
Most Recent Note - 6/15/2018 6:03:26 PM
G - Finished at a best-ever close today perched near its all-time high, very extended from any sound base. Prior high ($68.75 on 3/22/18) and its 50 DMA line ($71.23) define near term support to watch on pullbacks.
>>> FEATURED STOCK ARTICLE : Pullback After Volume-Driven Gains For New Highs - 6/7/2018 |
View all notes |
Set NEW NOTE alert |
Company Profile |
SEC
News |
Chart |
Request a new note
C
A
S
I |
LOB
-
NASDAQ
Live Oak Bancshares Inc
Banks-Southeast
|
$30.75
|
-0.75
-2.38% |
$31.60
|
172,707
162.93% of 50 DAV
50 DAV is 106,000
|
$31.65
-2.84%
|
5/21/2018
|
$29.35
|
PP = $30.15
|
|
MB = $31.66
|
Most Recent Note - 6/21/2018 12:54:40 PM
Y - Rallied near its "max buy" level with 4 consecutive volume-driven gains after testing support at its 50 DMA line ($29.34). Bullish action recently triggered a technical buy signal. Prior lows in the $26-27 area define important near term support. Recently reported earnings +63% on +42% for the Mar '18 quarter.
>>> FEATURED STOCK ARTICLE : Bank Perched Near High After Orderly Base - 5/23/2018 |
View all notes |
Set NEW NOTE alert |
Company Profile |
SEC
News |
Chart |
Request a new note
C
A
S
I |
PYPL
-
NASDAQ
Paypal Holdings Inc
Finance-CrdtCard/PmtPr
|
$85.97
|
+0.02
0.02% |
$87.55
|
7,698,189
96.55% of 50 DAV
50 DAV is 7,973,000
|
$86.97
-1.15%
|
5/18/2018
|
$81.63
|
PP = $80.89
|
|
MB = $84.93
|
Most Recent Note - 6/15/2018 6:21:14 PM
Y - Volume totals were light when wedging above the pivot point cited based on its 4/18/18 high. It is perched within close striking distance of its all-time high. Confirming gains backed by at least +40% above average volume would be a reassuring sign of fresh institutional buying demand.
>>> FEATURED STOCK ARTICLE : Gains Have Lacked Volume While Approaching All-Time High - 6/8/2018 |
View all notes |
Set NEW NOTE alert |
Company Profile |
SEC
News |
Chart |
Request a new note
C
A
S
I |
OLLI
-
NASDAQ
Ollie's Bargain Outlet
Retail-DiscountandVariety
|
$76.90
|
+2.55
3.43% |
$77.05
|
771,253
89.68% of 50 DAV
50 DAV is 860,000
|
$77.50
-0.77%
|
4/10/2018
|
$62.05
|
PP = $62.15
|
|
MB = $65.26
|
Most Recent Note - 6/15/2018 6:18:07 PM
G - Remains perched near its all-time high, very extended from any sound base. Its 50 DMA line ($66.86) defines important near-term support to watch on pullbacks.
>>> FEATURED STOCK ARTICLE : Extended From Prior Base After 8 Consecutive Gains - 5/17/2018 |
View all notes |
Set NEW NOTE alert |
Company Profile |
SEC
News |
Chart |
Request a new note
C
A
S
I |
MOMO
-
NASDAQ
Momo Inc Ads Cl A
INTERNET - Content
|
$50.88
|
-1.03
-1.98% |
$52.18
|
2,665,866
59.93% of 50 DAV
50 DAV is 4,448,000
|
$54.24
-6.19%
|
6/1/2018
|
$48.62
|
PP = $46.79
|
|
MB = $49.13
|
Most Recent Note - 6/19/2018 12:51:04 PM
G - Gapped down today but it remains above its "max buy" level. Disciplined investors avoid chasing stocks extended more than +5% from a sound base. Prior highs in the $45-46 area define initial support to watch on pullbacks.
>>> FEATURED STOCK ARTICLE : Volume-Driven Gain for New All-Time High - 6/1/2018 |
View all notes |
Set NEW NOTE alert |
Company Profile |
SEC
News |
Chart |
Request a new note
C
A
S
I |
Symbol/Exchange
Company Name
Industry Group |
PRICE |
CHANGE
(%Change) |
Day High |
Volume
(% DAV)
(% 50 day avg vol) |
52 Wk Hi
% From Hi |
Featured
Date |
Price
Featured |
Pivot Featured |
|
Max Buy |
NOVT
-
NASDAQ
Novanta Inc
Elec-Scientific/Msrng
|
$63.10
|
-1.60
-2.47% |
$64.65
|
196,371
78.55% of 50 DAV
50 DAV is 250,000
|
$68.00
-7.21%
|
4/17/2018
|
$60.55
|
PP = $60.40
|
|
MB = $63.42
|
Most Recent Note - 6/19/2018 5:44:11 PM
G - Encountering distributional pressure while retreating from its all-time high. Its 50 DMA line ($62.21) defines important near-term support to watch.
>>> FEATURED STOCK ARTICLE : Quietly Hovering Near All-Time High - 5/25/2018 |
View all notes |
Set NEW NOTE alert |
Company Profile |
SEC
News |
Chart |
Request a new note
C
A
S
I |
BZUN
-
NASDAQ
Baozun Inc Cl A Ads
Computer Sftwr-Enterprse
|
$61.95
|
-2.28
-3.55% |
$64.85
|
1,948,837
78.24% of 50 DAV
50 DAV is 2,491,000
|
$67.41
-8.10%
|
5/15/2018
|
$45.38
|
PP = $52.43
|
|
MB = $55.05
|
Most Recent Note - 6/21/2018 6:03:52 PM
G - Consolidating after getting very extended from the prior base. Its 50 DMA line ($53.71) and prior highs in the $52 area define important near-term support to watch.
>>> FEATURED STOCK ARTICLE : Earnings News Due; Formed a Base-on-Base Pattern - 5/16/2018 |
View all notes |
Set NEW NOTE alert |
Company Profile |
SEC
News |
Chart |
Request a new note
C
A
S
I |
SEND
-
NYSE
Sendgrid Inc
INTERNET - Content
|
$29.69
|
-0.69
-2.27% |
$31.40
|
1,359,043
255.94% of 50 DAV
50 DAV is 531,000
|
$32.03
-7.30%
|
6/20/2018
|
$30.72
|
PP = $32.13
|
|
MB = $33.74
|
Most Recent Note - 6/21/2018 1:19:53 PM
Y - Adding to an impressive spurt of volume-driven gains above its 50 DMA line and very little resistance remains. New pivot point cited was based on its 3/12/18 high plus 10 cents. Subsequent gains above the pivot point backed by at least +40% above average volume are still needed to trigger a proper new (or add-on) technical buy signal. Recent lows in the $23-24 area define important support to watch on pullbacks. Showed resilience since it completed a new Public Offering and Secondary Offering on 4/05/18.
>>> FEATURED STOCK ARTICLE : Volume-Driven Gains Above 50-Day Average Help Outlook Improve - 6/14/2018 |
View all notes |
Set NEW NOTE alert |
Company Profile |
SEC
News |
Chart |
Request a new note
C
A
S
I |