***Last / Change / Volume data in this table is the closing quote data***
Symbol/Exchange
Company Name
Industry Group |
PRICE |
CHANGE
(%Change) |
Day High |
Volume
(% DAV)
(% 50 day avg vol) |
52 Wk Hi
% From Hi |
Featured
Date |
Price
Featured |
Pivot Featured |
|
Max Buy |
OSBC
-
NASDAQ
Old Second Bancorp Inc
BANKING - Regional - Midwest Banks
|
$15.25
|
+0.15
0.99% |
$15.30
|
109,806
195.04% of 50 DAV
50 DAV is 56,300
|
$15.55
-1.93%
|
5/21/2018
|
$15.50
|
PP = $15.10
|
|
MB = $15.86
|
Most Recent Note - 6/12/2018 5:47:50 PM
Y - Recently encountered distributional pressure yet it remains hovering near its high. Stalled after highlighted in yellow on 5/21/18 with pivot point cited based on prior highs plus 10 cents. Fundamentals remain strong.
>>> FEATURED STOCK ARTICLE : Hit New High Today After Orderly Consolidation - 5/21/2018 |
View all notes |
Set NEW NOTE alert |
Company Profile |
SEC
News |
Chart |
Request a new note
C
A
S
I |
PFBC
-
NASDAQ
Preferred Bank Los Angls
BANKING - Regional - Pacific Banks
|
$66.23
|
+0.77
1.18% |
$66.24
|
99,669
129.78% of 50 DAV
50 DAV is 76,800
|
$67.88
-2.43%
|
5/18/2018
|
$62.91
|
PP = $67.75
|
|
MB = $71.14
|
Most Recent Note - 6/11/2018 5:52:22 PM
Y - Pulled back on lighter volume today, slumping toward its 50 DMA line ($64.66). Its Relative Strength rating is still below the 80+ minimum guideline at 72, yet it ended only -3.1% off its high. Subsequent gains above the pivot point are needed to trigger a technical buy signal.
>>> FEATURED STOCK ARTICLE : Some Technical Sputtering Yet Bank is Still Only -7% Off High - 5/18/2018 |
View all notes |
Set NEW NOTE alert |
Company Profile |
SEC
News |
Chart |
Request a new note
C
A
S
I |
SIVB
-
NASDAQ
S V B Financial Group
BANKING - Regional - Pacific Banks
|
$315.82
|
-0.67
-0.21% |
$318.31
|
919,360
174.12% of 50 DAV
50 DAV is 528,000
|
$329.65
-4.20%
|
3/12/2018
|
$267.79
|
PP = $263.19
|
|
MB = $276.35
|
Most Recent Note - 6/11/2018 5:56:08 PM
G - Touched a new all-time high today but reversed and ended lower. Fundamentals are strong.
>>> FEATURED STOCK ARTICLE : Wedging Higher Following Big Breakaway Gap - 5/22/2018 |
View all notes |
Set NEW NOTE alert |
Company Profile |
SEC
News |
Chart |
Request a new note
C
A
S
I |
UCFC
-
NASDAQ
United Community Finl Cp
BANKING - Savings and Loans
|
$11.15
|
+0.31
2.86% |
$11.16
|
296,245
227.36% of 50 DAV
50 DAV is 130,300
|
$10.95
1.83%
|
5/30/2018
|
$10.50
|
PP = $10.80
|
|
MB = $11.34
|
Most Recent Note - 6/14/2018 6:28:02 PM
Y - Matched its best ever close with a volume-driven gain today. However, it has churned above average volume in recent weeks while making very little headway above prior highs, action indicative of distributional pressure.
>>> FEATURED STOCK ARTICLE : Small Savings & Loan Perched Near High - 5/30/2018 |
View all notes |
Set NEW NOTE alert |
Company Profile |
SEC
News |
Chart |
Request a new note
C
A
S
I |
EPAM
-
NYSE
Epam Systems Inc
COMPUTER SOFTWARE and SERVICES - Information Technology Service
|
$124.13
|
-1.36
-1.08% |
$125.72
|
359,956
128.56% of 50 DAV
50 DAV is 280,000
|
$131.75
-5.78%
|
5/9/2018
|
$120.34
|
PP = $125.98
|
|
MB = $132.28
|
Most Recent Note - 6/12/2018 5:56:29 PM
Y - Still consolidating in a tight range above near-term support defined by prior highs and its 50 DMA line ($119.75).
>>> FEATURED STOCK ARTICLE : Volume-Driven Gain Challenged Prior High Following Earnings - 5/9/2018 |
View all notes |
Set NEW NOTE alert |
Company Profile |
SEC
News |
Chart |
Request a new note
C
A
S
I |
Symbol/Exchange
Company Name
Industry Group |
PRICE |
CHANGE
(%Change) |
Day High |
Volume
(% DAV)
(% 50 day avg vol) |
52 Wk Hi
% From Hi |
Featured
Date |
Price
Featured |
Pivot Featured |
|
Max Buy |
MA
-
NYSE
Mastercard Inc Cl A
Finance-CrdtCard/PmtPr
|
$199.53
|
+0.22
0.11% |
$199.67
|
4,018,602
110.49% of 50 DAV
50 DAV is 3,637,000
|
$204.00
-2.19%
|
5/2/2018
|
$184.96
|
PP = $183.83
|
|
MB = $193.02
|
Most Recent Note - 6/12/2018 6:01:30 PM
G - Volume totals have been cooling while hovering near its all-time high. Its 50 DMA line (185.58) and prior high ($183.73) define support to watch on pullbacks.
>>> FEATURED STOCK ARTICLE : Gap Up and Volume Driven Gain for New High After Earnings - 5/2/2018 |
View all notes |
Set NEW NOTE alert |
Company Profile |
SEC
News |
Chart |
Request a new note
C
A
S
I |
V
-
NYSE
Visa Inc Cl A
Finance-CrdtCard/PmtPr
|
$135.10
|
+0.10
0.07% |
$135.73
|
9,977,902
140.24% of 50 DAV
50 DAV is 7,115,000
|
$136.58
-1.08%
|
4/26/2018
|
$126.68
|
PP = $126.98
|
|
MB = $133.33
|
Most Recent Note - 6/11/2018 6:09:11 PM
G - Hovering near its "max buy" level. Prior highs in the $126 area and its 50 DMA line ($127) define near-term support to watch on pullbacks. See the latest FSU analysis for more details and a new annotated graph.
>>> FEATURED STOCK ARTICLE : Encountered Distributional Pressure at All-Time High - 6/11/2018 |
View all notes |
Set NEW NOTE alert |
Company Profile |
SEC
News |
Chart |
Request a new note
C
A
S
I |
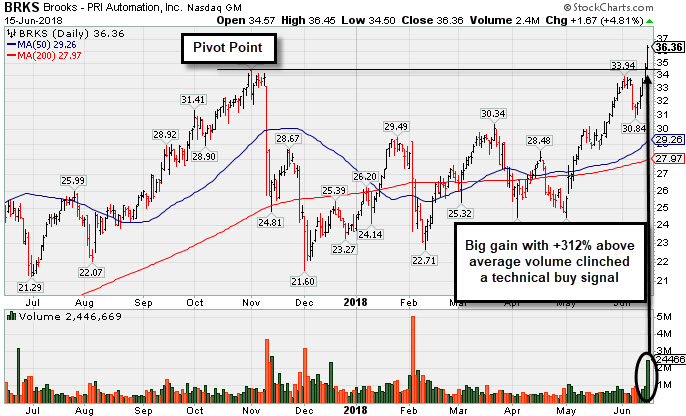
BRKS
-
NASDAQ
Brooks Automation
ELECTRONICS - Semiconductor Equipment and Mate
|
$36.36
|
+1.67
4.81% |
$36.45
|
2,069,807
349.04% of 50 DAV
50 DAV is 593,000
|
$35.00
3.89%
|
6/15/2018
|
$35.44
|
PP = $34.87
|
|
MB = $36.61
|
 Most Recent Note - 6/15/2018 6:01:29 PM
Y - Highlighted in yellow with pivot point cited based on its 11/01/17 high plus 10 cents in the earlier mid-day report, it clinched a technical buy signal with heavy volume behind today's big 5th consecutive gain. See the latest FSU analysis for more details and a new annotated graph.
>>> FEATURED STOCK ARTICLE : Volume Was Heavy Behind Big Breakout Gain - 6/15/2018 |
View all notes |
Set NEW NOTE alert |
Company Profile |
SEC
News |
Chart |
Request a new note
C
A
S
I |
ENV
-
NYSE
Envestnet Inc
FINANCIAL SERVICES - Diversified Investments
|
$58.10
|
-0.65
-1.11% |
$59.00
|
735,349
241.89% of 50 DAV
50 DAV is 304,000
|
$60.28
-3.61%
|
6/15/2018
|
$57.85
|
PP = $60.37
|
|
MB = $63.39
|
Most Recent Note - 6/15/2018 12:33:18 PM
Y - Color code is changed to yellow with pivot point cited based on its 3/21/18 high plus 10 cents. Subsequent volume-driven gains for new highs are needed to trigger a technical buy signal. Rebound above the 50 DMA line helped its outlook improve after it found support at its 200 DMA line. Reported +48% earnings on +25% sales revenues for the Mar '18 quarter, its 5th consecutive quarterly comparison above the +25% minimum earnings guideline (C criteria).
There are no Featured Stock Updates™ available for this stock at this time. You may request one by clicking the Request a New Note link below |
View all notes |
Set NEW NOTE alert |
Company Profile |
SEC
News |
Chart |
Request a new note
C
A
S
I |
TPL
-
NYSE
Texas Pacific Land Trust
Real Estate Dvlpmt/Ops
|
$678.16
|
-15.39
-2.22% |
$690.00
|
23,773
118.87% of 50 DAV
50 DAV is 20,000
|
$739.89
-8.34%
|
4/13/2018
|
$547.85
|
PP = $552.10
|
|
MB = $579.71
|
Most Recent Note - 6/14/2018 6:25:34 PM
G - Volume totals have been cooling while stubbornly holding its ground perched near its all-time high. Its 50 DMA line ($623) defines important support to watch above the prior highs in the $569-552 area.
>>> FEATURED STOCK ARTICLE : Negative Reversal on Higher Volume After Hitting New All-Time High - 6/4/2018 |
View all notes |
Set NEW NOTE alert |
Company Profile |
SEC
News |
Chart |
Request a new note
C
A
S
I |
Symbol/Exchange
Company Name
Industry Group |
PRICE |
CHANGE
(%Change) |
Day High |
Volume
(% DAV)
(% 50 day avg vol) |
52 Wk Hi
% From Hi |
Featured
Date |
Price
Featured |
Pivot Featured |
|
Max Buy |
STMP
-
NASDAQ
Stamps.com Inc
Retail-Internet
|
$281.10
|
-0.50
-0.18% |
$283.00
|
331,919
113.67% of 50 DAV
50 DAV is 292,000
|
$283.83
-0.96%
|
5/4/2018
|
$234.15
|
PP = $233.23
|
|
MB = $244.89
|
Most Recent Note - 6/13/2018 6:33:55 PM
G - Hit yet another new all-time highs today, getting very extended from prior highs in the $233 area which define initial support above its 50 DMA line ($237).
>>> FEATURED STOCK ARTICLE : Volume-Driven Gain For New High - 5/4/2018 |
View all notes |
Set NEW NOTE alert |
Company Profile |
SEC
News |
Chart |
Request a new note
C
A
S
I |
CHDN
-
NASDAQ
Churchill Downs Inc
LEISURE - Gaming Activities
|
$300.45
|
+1.40
0.47% |
$303.70
|
116,098
111.63% of 50 DAV
50 DAV is 104,000
|
$314.60
-4.50%
|
5/14/2018
|
$285.80
|
PP = $285.80
|
|
MB = $300.09
|
Most Recent Note - 6/13/2018 6:09:48 PM
G - Volume totals have been cooling while consolidating in a tight range just above its "max buy" level. Prior highs in the $285-279 area define initial support to watch above its 50 DMA line ($278).
>>> FEATURED STOCK ARTICLE : Breakout Followed New Supreme Court Ruling on Sports Betting - 5/14/2018 |
View all notes |
Set NEW NOTE alert |
Company Profile |
SEC
News |
Chart |
Request a new note
C
A
S
I |
HTHT
-
NASDAQ
China Lodging Group Ads
LEISURE - Lodging
|
$49.02
|
+0.35
0.72% |
$49.20
|
2,359,660
106.63% of 50 DAV
50 DAV is 2,213,000
|
$49.45
-0.87%
|
5/15/2018
|
$34.52
|
PP = $41.57
|
|
MB = $43.65
|
Most Recent Note - 6/13/2018 6:13:22 PM
G - Volume totals have been cooling while consolidating near its all-time high. Extended from prior highs in the $40-41 area which define initial support to watch on pullbacks. Do not be confused by the 4:1 split impacting share prices (Price Featured, Pivot Point and Max Buy were updated to account for the split).
>>> FEATURED STOCK ARTICLE : New Volume-Driven Breakout For All-Time High - 5/15/2018 |
View all notes |
Set NEW NOTE alert |
Company Profile |
SEC
News |
Chart |
Request a new note
C
A
S
I |
NFLX
-
NASDAQ
Netflix Inc
SPECIALTY RETAIL - Music and Video Stores
|
$391.98
|
-0.89
-0.23% |
$398.86
|
13,440,413
149.02% of 50 DAV
50 DAV is 9,019,000
|
$395.03
-0.77%
|
5/24/2018
|
$348.85
|
PP = $338.92
|
|
MB = $355.87
|
Most Recent Note - 6/15/2018 12:44:32 PM
G - Spiked into new all-time high territory with volume-driven gains this week, getting very extended from any sound base. Prior highs in the $338-333 area define initial support to watch above its 50 DMA line ($333).
>>> FEATURED STOCK ARTICLE : Rally From Advanced Ascending Base With Volume +50% - 5/24/2018 |
View all notes |
Set NEW NOTE alert |
Company Profile |
SEC
News |
Chart |
Request a new note
C
A
S
I |
DPZ
-
NYSE
Dominos Pizza Inc
Retail-Restaurants
|
$277.34
|
+3.69
1.35% |
$277.36
|
553,937
97.18% of 50 DAV
50 DAV is 570,000
|
$276.12
0.44%
|
5/21/2018
|
$248.13
|
PP = $255.10
|
|
MB = $267.86
|
Most Recent Note - 6/13/2018 6:11:39 PM
G - Hit another new high with light volume today, getting very extended from the latest base. Its 50 DMA line ($247) and prior highs in the $236 area define important near-term support to watch on pullbacks.
>>> FEATURED STOCK ARTICLE : New High With Gain Backed by Above Average Volume - 6/5/2018 |
View all notes |
Set NEW NOTE alert |
Company Profile |
SEC
News |
Chart |
Request a new note
C
A
S
I |
Symbol/Exchange
Company Name
Industry Group |
PRICE |
CHANGE
(%Change) |
Day High |
Volume
(% DAV)
(% 50 day avg vol) |
52 Wk Hi
% From Hi |
Featured
Date |
Price
Featured |
Pivot Featured |
|
Max Buy |
FIVE
-
NASDAQ
Five Below Inc
Retail-DiscountandVariety
|
$100.01
|
-2.08
-2.04% |
$102.64
|
1,728,638
102.41% of 50 DAV
50 DAV is 1,688,000
|
$103.99
-3.83%
|
6/4/2018
|
$75.96
|
PP = $78.38
|
|
MB = $82.30
|
Most Recent Note - 6/15/2018 6:05:33 PM
G - Pulled back on higher (near average) volume today, and it remains near its all-time high very extended from the previously noted base. Reported earnings +133% on +27% sales revenues for the Apr '18 quarter. Disciplined investors avoid chasing stocks that are too extended from a sound base.
>>> FEATURED STOCK ARTICLE : Trading Near 50-Day Average After Falling Into Prior Base - 5/7/2018 |
View all notes |
Set NEW NOTE alert |
Company Profile |
SEC
News |
Chart |
Request a new note
C
A
S
I |
NOW
-
NYSE
Servicenow Inc
Computer Sftwr-Enterprse
|
$186.35
|
+1.01
0.54% |
$186.59
|
1,688,408
91.81% of 50 DAV
50 DAV is 1,839,000
|
$187.39
-0.55%
|
5/8/2018
|
$174.63
|
PP = $176.66
|
|
MB = $185.49
|
Most Recent Note - 6/14/2018 6:22:52 PM
Y - Posted a solid volume-driven gain today indicative of greater institutional buying demand while challenging its "max buy" level and its all-time high. Its 50 DMA line ($173) and prior low define near-term support.
>>> FEATURED STOCK ARTICLE : High-Ranked Software - Enterprise Firm is Near Pivot Point - 5/8/2018 |
View all notes |
Set NEW NOTE alert |
Company Profile |
SEC
News |
Chart |
Request a new note
C
A
S
I |
NVEE
-
NASDAQ
N V 5 Global Inc
Comml Svcs-Consulting
|
$69.40
|
+3.45
5.23% |
$71.25
|
209,277
264.91% of 50 DAV
50 DAV is 79,000
|
$71.90
-3.48%
|
6/15/2018
|
$7,070.00
|
PP = $72.00
|
|
MB = $75.60
|
Most Recent Note - 6/15/2018 12:46:09 PM
Y - Gapped up for a considerable volume-driven gain today challenging its all-time high. Color code was changed to yellow with new pivot point cited based on its 5/04/18 high plus 10 cents. Its 50 DMA line ($61.42) and prior low ($56.65 on 5/15/18) define near term support to watch.
>>> FEATURED STOCK ARTICLE : Encountered Distributional Pressure After Hitting New High - 5/11/2018 |
View all notes |
Set NEW NOTE alert |
Company Profile |
SEC
News |
Chart |
Request a new note
C
A
S
I |
PANW
-
NYSE
Palo Alto Networks
Computer Sftwr-Security
|
$214.60
|
-0.96
-0.45% |
$215.25
|
2,155,012
147.40% of 50 DAV
50 DAV is 1,462,000
|
$217.40
-1.29%
|
6/12/2018
|
$206.55
|
PP = $214.69
|
|
MB = $225.42
|
Most Recent Note - 6/14/2018 6:29:08 PM
Y - Posted a 3rd consecutive volume-driven gain today and closed at another new all-time high. Found support at its 10-week moving average following a "negative reversal" on 6/04/18 after an earlier breakout. Color code was changed to yellow as a valid secondary buy point exists from the 10 WMA line up to 5% above the most recent high. Reported earnings +62% on +31% sales revenues for the Apr '18 quarter, continuing its strong earnings track record. See the latest FSU analysis for more details and a new annotated graph.
>>> FEATURED STOCK ARTICLE : New High Close After 2 Consecutive Volume Driven Gains - 6/13/2018 |
View all notes |
Set NEW NOTE alert |
Company Profile |
SEC
News |
Chart |
Request a new note
C
A
S
I |
QLYS
-
NASDAQ
Qualys Inc
Computer Sftwr-Security
|
$95.50
|
+0.70
0.74% |
$95.95
|
807,114
246.07% of 50 DAV
50 DAV is 328,000
|
$97.75
-2.30%
|
4/17/2018
|
$82.85
|
PP = $79.50
|
|
MB = $83.48
|
Most Recent Note - 6/14/2018 12:52:27 PM
G - Hitting yet another new all-time high with today's 5th consecutive gain, getting very extended from any sound base. Prior highs and its 50 DMA line ($78.58) define near-term support to watch on pullbacks.
>>> FEATURED STOCK ARTICLE : Rebounded Above 50-Day Average Yet Still Faces Overhead Supply - 5/29/2018 |
View all notes |
Set NEW NOTE alert |
Company Profile |
SEC
News |
Chart |
Request a new note
C
A
S
I |
Symbol/Exchange
Company Name
Industry Group |
PRICE |
CHANGE
(%Change) |
Day High |
Volume
(% DAV)
(% 50 day avg vol) |
52 Wk Hi
% From Hi |
Featured
Date |
Price
Featured |
Pivot Featured |
|
Max Buy |
SPLK
-
NASDAQ
Splunk Inc
Computer Sftwr-Database
|
$115.86
|
-3.64
-3.05% |
$117.16
|
3,127,108
190.91% of 50 DAV
50 DAV is 1,638,000
|
$121.64
-4.75%
|
5/8/2018
|
$113.14
|
PP = $112.76
|
|
MB = $118.40
|
Most Recent Note - 6/13/2018 6:32:41 PM
Y - Held its ground stubbornly today, quietly perched at its all-time high. Gain on the prior session backed by +45% above average was a reassuring sign of fresh institutional buying demand helping clinch a technical buy signal. Its 50 DMA line ($109.20) and recent low ($107.08 on 5/29/18) define important near-term support to watch on pullbacks.
>>> FEATURED STOCK ARTICLE : Consolidating Near High Following Latest Financial Report - 5/31/2018 |
View all notes |
Set NEW NOTE alert |
Company Profile |
SEC
News |
Chart |
Request a new note
C
A
S
I |
SUPN
-
NASDAQ
Supernus Pharmaceuticals
Medical-Biomed/Biotech
|
$54.95
|
+1.20
2.23% |
$55.10
|
896,084
119.16% of 50 DAV
50 DAV is 752,000
|
$59.05
-6.94%
|
4/24/2018
|
$47.73
|
PP = $50.15
|
|
MB = $52.66
|
Most Recent Note - 6/13/2018 6:43:55 PM
G - Volume totals have been cooling in recent weeks while consolidating in an orderly fashion. Prior highs in the $49-50 area and its 50 DMA line ($50.88) define near-term support.
>>> FEATURED STOCK ARTICLE : Extended From Prior Base After Spiking Higher - 6/6/2018 |
View all notes |
Set NEW NOTE alert |
Company Profile |
SEC
News |
Chart |
Request a new note
C
A
S
I |
PAYC
-
NYSE
Paycom Software Inc
COMPUTER SOFTWARE and SERVICES - Application Software
|
$112.62
|
-1.05
-0.92% |
$113.55
|
784,620
107.48% of 50 DAV
50 DAV is 730,000
|
$118.45
-4.92%
|
2/15/2018
|
$95.01
|
PP = $93.61
|
|
MB = $98.29
|
Most Recent Note - 6/12/2018 5:54:17 PM
G - Rebounded above its 50 DMA line ($108.08) with a big gain today on higher (near average) volume. Still faces some resistance due to overhead supply up to the $118 level. Found prompt support near prior lows in the $101 area.
>>> FEATURED STOCK ARTICLE : Violation of 50-Day Average Triggered Technical Sell Signal - 5/3/2018 |
View all notes |
Set NEW NOTE alert |
Company Profile |
SEC
News |
Chart |
Request a new note
C
A
S
I |
GRUB
-
NYSE
Grubhub Inc
INTERNET - Content
|
$118.77
|
-1.09
-0.91% |
$120.07
|
2,064,477
150.58% of 50 DAV
50 DAV is 1,371,000
|
$120.00
-1.03%
|
5/30/2018
|
$107.56
|
PP = $105.68
|
|
MB = $110.96
|
Most Recent Note - 6/14/2018 12:39:28 PM
G - Hitting another new high with today's 4th consecutive gain on ever-increasing volume. The prior gain was backed by +76% above average volume, action indicative of fresh institutional buying demand.
>>> FEATURED STOCK ARTICLE : Gain With +25% Above Average Volume for Best Ever Close - 6/12/2018 |
View all notes |
Set NEW NOTE alert |
Company Profile |
SEC
News |
Chart |
Request a new note
C
A
S
I |
HQY
-
NASDAQ
Healthequity Inc
COMPUTER SOFTWARE and SERVICES - Healthcare Information Service
|
$81.01
|
+0.83
1.04% |
$81.15
|
658,194
132.17% of 50 DAV
50 DAV is 498,000
|
$81.40
-0.48%
|
5/2/2018
|
$66.31
|
PP = $68.85
|
|
MB = $72.29
|
Most Recent Note - 6/15/2018 6:03:26 PM
G - Finished at a best-ever close today perched near its all-time high, very extended from any sound base. Prior high ($68.75 on 3/22/18) and its 50 DMA line ($71.23) define near term support to watch on pullbacks.
>>> FEATURED STOCK ARTICLE : Pullback After Volume-Driven Gains For New Highs - 6/7/2018 |
View all notes |
Set NEW NOTE alert |
Company Profile |
SEC
News |
Chart |
Request a new note
C
A
S
I |
Symbol/Exchange
Company Name
Industry Group |
PRICE |
CHANGE
(%Change) |
Day High |
Volume
(% DAV)
(% 50 day avg vol) |
52 Wk Hi
% From Hi |
Featured
Date |
Price
Featured |
Pivot Featured |
|
Max Buy |
LOB
-
NASDAQ
Live Oak Bancshares Inc
Banks-Southeast
|
$29.85
|
+0.15
0.51% |
$29.90
|
272,557
267.21% of 50 DAV
50 DAV is 102,000
|
$31.00
-3.71%
|
5/21/2018
|
$29.35
|
PP = $30.15
|
|
MB = $31.66
|
Most Recent Note - 6/15/2018 6:07:37 PM
Y - Tested support at its 50 DMA line ($29.14) and managed a "positive reversal" for a volume-driven gain today. Disciplined investors may still be watching for convincing volume-driven gains above the pivot point to trigger a technical buy signal. Prior lows in the $26-27 area define important near term support. Recently reported earnings +63% on +42% for the Mar '18 quarter.
>>> FEATURED STOCK ARTICLE : Bank Perched Near High After Orderly Base - 5/23/2018 |
View all notes |
Set NEW NOTE alert |
Company Profile |
SEC
News |
Chart |
Request a new note
C
A
S
I |
PYPL
-
NASDAQ
Paypal Holdings Inc
Finance-CrdtCard/PmtPr
|
$85.31
|
-0.30
-0.35% |
$85.69
|
8,492,756
105.97% of 50 DAV
50 DAV is 8,014,000
|
$86.32
-1.17%
|
5/18/2018
|
$81.63
|
PP = $80.89
|
|
MB = $84.93
|
Most Recent Note - 6/15/2018 6:21:14 PM
Y - Volume totals were light when wedging above the pivot point cited based on its 4/18/18 high. It is perched within close striking distance of its all-time high. Confirming gains backed by at least +40% above average volume would be a reassuring sign of fresh institutional buying demand.
>>> FEATURED STOCK ARTICLE : Gains Have Lacked Volume While Approaching All-Time High - 6/8/2018 |
View all notes |
Set NEW NOTE alert |
Company Profile |
SEC
News |
Chart |
Request a new note
C
A
S
I |
OLLI
-
NASDAQ
Ollie's Bargain Outlet
Retail-DiscountandVariety
|
$75.10
|
-0.55
-0.73% |
$75.40
|
1,173,326
123.64% of 50 DAV
50 DAV is 949,000
|
$77.50
-3.10%
|
4/10/2018
|
$62.05
|
PP = $62.15
|
|
MB = $65.26
|
Most Recent Note - 6/15/2018 6:18:07 PM
G - Remains perched near its all-time high, very extended from any sound base. Its 50 DMA line ($66.86) defines important near-term support to watch on pullbacks.
>>> FEATURED STOCK ARTICLE : Extended From Prior Base After 8 Consecutive Gains - 5/17/2018 |
View all notes |
Set NEW NOTE alert |
Company Profile |
SEC
News |
Chart |
Request a new note
C
A
S
I |
MOMO
-
NASDAQ
Momo Inc Ads Cl A
INTERNET - Content
|
$53.60
|
-0.26
-0.48% |
$53.90
|
4,163,105
95.66% of 50 DAV
50 DAV is 4,352,000
|
$54.24
-1.18%
|
6/1/2018
|
$48.62
|
PP = $46.79
|
|
MB = $49.13
|
Most Recent Note - 6/11/2018 12:27:38 PM
G - Hit another new all-time high today. Stubbornly held its ground after volume-driven gains. Disciplined investors avoid chasing stocks extended more than +5% from a sound base. Prior highs in the $45-46 area define initial support to watch on pullbacks.
>>> FEATURED STOCK ARTICLE : Volume-Driven Gain for New All-Time High - 6/1/2018 |
View all notes |
Set NEW NOTE alert |
Company Profile |
SEC
News |
Chart |
Request a new note
C
A
S
I |
NOVT
-
NASDAQ
Novanta Inc
Elec-Scientific/Msrng
|
$65.15
|
-2.45
-3.62% |
$67.35
|
452,667
194.28% of 50 DAV
50 DAV is 233,000
|
$68.00
-4.19%
|
4/17/2018
|
$60.55
|
PP = $60.40
|
|
MB = $63.42
|
Most Recent Note - 6/13/2018 6:26:56 PM
G - Endured distributional pressure today when poised for a best-ever close after wedging higher. Recent gains lacked great volume-conviction.
>>> FEATURED STOCK ARTICLE : Quietly Hovering Near All-Time High - 5/25/2018 |
View all notes |
Set NEW NOTE alert |
Company Profile |
SEC
News |
Chart |
Request a new note
C
A
S
I |
Symbol/Exchange
Company Name
Industry Group |
PRICE |
CHANGE
(%Change) |
Day High |
Volume
(% DAV)
(% 50 day avg vol) |
52 Wk Hi
% From Hi |
Featured
Date |
Price
Featured |
Pivot Featured |
|
Max Buy |
BZUN
-
NASDAQ
Baozun Inc Cl A Ads
Computer Sftwr-Enterprse
|
$62.83
|
-1.55
-2.41% |
$64.02
|
2,183,880
86.32% of 50 DAV
50 DAV is 2,530,000
|
$67.41
-6.79%
|
5/15/2018
|
$45.38
|
PP = $52.43
|
|
MB = $55.05
|
Most Recent Note - 6/13/2018 6:05:16 PM
G - Very extended from the prior base. Prior highs in the $51-53 area and its 50 DMA line ($51.79) define support to watch on pullbacks.
>>> FEATURED STOCK ARTICLE : Earnings News Due; Formed a Base-on-Base Pattern - 5/16/2018 |
View all notes |
Set NEW NOTE alert |
Company Profile |
SEC
News |
Chart |
Request a new note
C
A
S
I |
SEND
-
NYSE
Sendgrid Inc
INTERNET - Content
|
$28.33
|
-0.68
-2.34% |
$29.75
|
1,184,190
212.60% of 50 DAV
50 DAV is 557,000
|
$32.03
-11.54%
|
3/6/2018
|
$28.00
|
PP = $28.37
|
|
MB = $29.79
|
Most Recent Note - 6/14/2018 6:20:17 PM
G - Rallied above its 50 DMA line helping its outlook improve with volume-driven gains this week. Still faces resistance due to overhead supply up to the $32 level. Recent lows in the $23-24 area define important support to watch on pullbacks. Showed resilience since it completed a new Public Offering and Secondary Offering on 4/05/18. See the latest FSU analysis for more details and a new annotated graph.
>>> FEATURED STOCK ARTICLE : Volume-Driven Gains Above 50-Day Average Help Outlook Improve - 6/14/2018 |
View all notes |
Set NEW NOTE alert |
Company Profile |
SEC
News |
Chart |
Request a new note
C
A
S
I |