***Last / Change / Volume data in this table is the closing quote data***
Symbol/Exchange
Company Name
Industry Group |
PRICE |
CHANGE
(%Change) |
Day High |
Volume
(% DAV)
(% 50 day avg vol) |
52 Wk Hi
% From Hi |
Featured
Date |
Price
Featured |
Pivot Featured |
|
Max Buy |
OSBC
-
NASDAQ
Old Second Bancorp Inc
BANKING - Regional - Midwest Banks
|
$15.10
|
-0.05
-0.33% |
$15.15
|
41,731
74.52% of 50 DAV
50 DAV is 56,000
|
$15.55
-2.89%
|
5/21/2018
|
$15.50
|
PP = $15.10
|
|
MB = $15.86
|
Most Recent Note - 6/12/2018 5:47:50 PM
Y - Recently encountered distributional pressure yet it remains hovering near its high. Stalled after highlighted in yellow on 5/21/18 with pivot point cited based on prior highs plus 10 cents. Fundamentals remain strong.
>>> FEATURED STOCK ARTICLE : Hit New High Today After Orderly Consolidation - 5/21/2018 |
View all notes |
Set NEW NOTE alert |
Company Profile |
SEC
News |
Chart |
Request a new note
C
A
S
I |
PFBC
-
NASDAQ
Preferred Bank Los Angls
BANKING - Regional - Pacific Banks
|
$65.46
|
+0.14
0.21% |
$65.59
|
39,514
50.53% of 50 DAV
50 DAV is 78,200
|
$67.88
-3.57%
|
5/18/2018
|
$62.91
|
PP = $67.75
|
|
MB = $71.14
|
Most Recent Note - 6/11/2018 5:52:22 PM
Y - Pulled back on lighter volume today, slumping toward its 50 DMA line ($64.66). Its Relative Strength rating is still below the 80+ minimum guideline at 72, yet it ended only -3.1% off its high. Subsequent gains above the pivot point are needed to trigger a technical buy signal.
>>> FEATURED STOCK ARTICLE : Some Technical Sputtering Yet Bank is Still Only -7% Off High - 5/18/2018 |
View all notes |
Set NEW NOTE alert |
Company Profile |
SEC
News |
Chart |
Request a new note
C
A
S
I |
SIVB
-
NASDAQ
S V B Financial Group
BANKING - Regional - Pacific Banks
|
$316.49
|
-3.84
-1.20% |
$320.60
|
416,946
78.52% of 50 DAV
50 DAV is 531,000
|
$329.65
-3.99%
|
3/12/2018
|
$267.79
|
PP = $263.19
|
|
MB = $276.35
|
Most Recent Note - 6/11/2018 5:56:08 PM
G - Touched a new all-time high today but reversed and ended lower. Fundamentals are strong.
>>> FEATURED STOCK ARTICLE : Wedging Higher Following Big Breakaway Gap - 5/22/2018 |
View all notes |
Set NEW NOTE alert |
Company Profile |
SEC
News |
Chart |
Request a new note
C
A
S
I |
UCFC
-
NASDAQ
United Community Finl Cp
BANKING - Savings and Loans
|
$10.84
|
+0.11
1.03% |
$10.85
|
293,844
233.58% of 50 DAV
50 DAV is 125,800
|
$10.95
-1.00%
|
5/30/2018
|
$10.50
|
PP = $10.80
|
|
MB = $11.34
|
 Most Recent Note - 6/14/2018 6:28:02 PM
Y - Matched its best ever close with a volume-driven gain today. However, it has churned above average volume in recent weeks while making very little headway above prior highs, action indicative of distributional pressure.
>>> FEATURED STOCK ARTICLE : Small Savings & Loan Perched Near High - 5/30/2018 |
View all notes |
Set NEW NOTE alert |
Company Profile |
SEC
News |
Chart |
Request a new note
C
A
S
I |
EPAM
-
NYSE
Epam Systems Inc
COMPUTER SOFTWARE and SERVICES - Information Technology Service
|
$125.49
|
-0.24
-0.19% |
$126.63
|
288,391
103.74% of 50 DAV
50 DAV is 278,000
|
$131.75
-4.75%
|
5/9/2018
|
$120.34
|
PP = $125.98
|
|
MB = $132.28
|
Most Recent Note - 6/12/2018 5:56:29 PM
Y - Still consolidating in a tight range above near-term support defined by prior highs and its 50 DMA line ($119.75).
>>> FEATURED STOCK ARTICLE : Volume-Driven Gain Challenged Prior High Following Earnings - 5/9/2018 |
View all notes |
Set NEW NOTE alert |
Company Profile |
SEC
News |
Chart |
Request a new note
C
A
S
I |
Symbol/Exchange
Company Name
Industry Group |
PRICE |
CHANGE
(%Change) |
Day High |
Volume
(% DAV)
(% 50 day avg vol) |
52 Wk Hi
% From Hi |
Featured
Date |
Price
Featured |
Pivot Featured |
|
Max Buy |
MA
-
NYSE
Mastercard Inc Cl A
Finance-CrdtCard/PmtPr
|
$199.31
|
-0.10
-0.05% |
$201.39
|
2,829,000
77.02% of 50 DAV
50 DAV is 3,673,000
|
$204.00
-2.30%
|
5/2/2018
|
$184.96
|
PP = $183.83
|
|
MB = $193.02
|
Most Recent Note - 6/12/2018 6:01:30 PM
G - Volume totals have been cooling while hovering near its all-time high. Its 50 DMA line (185.58) and prior high ($183.73) define support to watch on pullbacks.
>>> FEATURED STOCK ARTICLE : Gap Up and Volume Driven Gain for New High After Earnings - 5/2/2018 |
View all notes |
Set NEW NOTE alert |
Company Profile |
SEC
News |
Chart |
Request a new note
C
A
S
I |
V
-
NYSE
Visa Inc Cl A
Finance-CrdtCard/PmtPr
|
$135.00
|
+0.60
0.45% |
$135.70
|
6,460,713
90.30% of 50 DAV
50 DAV is 7,155,000
|
$136.58
-1.16%
|
4/26/2018
|
$126.68
|
PP = $126.98
|
|
MB = $133.33
|
Most Recent Note - 6/11/2018 6:09:11 PM
G - Hovering near its "max buy" level. Prior highs in the $126 area and its 50 DMA line ($127) define near-term support to watch on pullbacks. See the latest FSU analysis for more details and a new annotated graph.
>>> FEATURED STOCK ARTICLE : Encountered Distributional Pressure at All-Time High - 6/11/2018 |
View all notes |
Set NEW NOTE alert |
Company Profile |
SEC
News |
Chart |
Request a new note
C
A
S
I |
TPL
-
NYSE
Texas Pacific Land Trust
Real Estate Dvlpmt/Ops
|
$693.55
|
-6.41
-0.92% |
$700.15
|
5,320
26.60% of 50 DAV
50 DAV is 20,000
|
$739.89
-6.26%
|
4/13/2018
|
$547.85
|
PP = $552.10
|
|
MB = $579.71
|
Most Recent Note - 6/14/2018 6:25:34 PM
G - Volume totals have been cooling while stubbornly holding its ground perched near its all-time high. Its 50 DMA line ($623) defines important support to watch above the prior highs in the $569-552 area.
>>> FEATURED STOCK ARTICLE : Negative Reversal on Higher Volume After Hitting New All-Time High - 6/4/2018 |
View all notes |
Set NEW NOTE alert |
Company Profile |
SEC
News |
Chart |
Request a new note
C
A
S
I |
STMP
-
NASDAQ
Stamps.com Inc
Retail-Internet
|
$281.60
|
+5.15
1.86% |
$283.83
|
308,591
105.68% of 50 DAV
50 DAV is 292,000
|
$278.25
1.20%
|
5/4/2018
|
$234.15
|
PP = $233.23
|
|
MB = $244.89
|
Most Recent Note - 6/13/2018 6:33:55 PM
G - Hit yet another new all-time highs today, getting very extended from prior highs in the $233 area which define initial support above its 50 DMA line ($237).
>>> FEATURED STOCK ARTICLE : Volume-Driven Gain For New High - 5/4/2018 |
View all notes |
Set NEW NOTE alert |
Company Profile |
SEC
News |
Chart |
Request a new note
C
A
S
I |
CHDN
-
NASDAQ
Churchill Downs Inc
LEISURE - Gaming Activities
|
$299.05
|
-1.80
-0.60% |
$301.45
|
56,995
54.80% of 50 DAV
50 DAV is 104,000
|
$314.60
-4.94%
|
5/14/2018
|
$285.80
|
PP = $285.80
|
|
MB = $300.09
|
Most Recent Note - 6/13/2018 6:09:48 PM
G - Volume totals have been cooling while consolidating in a tight range just above its "max buy" level. Prior highs in the $285-279 area define initial support to watch above its 50 DMA line ($278).
>>> FEATURED STOCK ARTICLE : Breakout Followed New Supreme Court Ruling on Sports Betting - 5/14/2018 |
View all notes |
Set NEW NOTE alert |
Company Profile |
SEC
News |
Chart |
Request a new note
C
A
S
I |
Symbol/Exchange
Company Name
Industry Group |
PRICE |
CHANGE
(%Change) |
Day High |
Volume
(% DAV)
(% 50 day avg vol) |
52 Wk Hi
% From Hi |
Featured
Date |
Price
Featured |
Pivot Featured |
|
Max Buy |
HTHT
-
NASDAQ
China Lodging Group Ads
LEISURE - Lodging
|
$48.67
|
+0.72
1.50% |
$49.01
|
1,749,954
78.61% of 50 DAV
50 DAV is 2,226,000
|
$49.45
-1.58%
|
5/15/2018
|
$34.52
|
PP = $41.57
|
|
MB = $43.65
|
Most Recent Note - 6/13/2018 6:13:22 PM
G - Volume totals have been cooling while consolidating near its all-time high. Extended from prior highs in the $40-41 area which define initial support to watch on pullbacks. Do not be confused by the 4:1 split impacting share prices (Price Featured, Pivot Point and Max Buy were updated to account for the split).
>>> FEATURED STOCK ARTICLE : New Volume-Driven Breakout For All-Time High - 5/15/2018 |
View all notes |
Set NEW NOTE alert |
Company Profile |
SEC
News |
Chart |
Request a new note
C
A
S
I |
NFLX
-
NASDAQ
Netflix Inc
SPECIALTY RETAIL - Music and Video Stores
|
$392.87
|
+12.94
3.41% |
$395.03
|
14,535,791
161.76% of 50 DAV
50 DAV is 8,986,000
|
$384.25
2.24%
|
5/24/2018
|
$348.85
|
PP = $338.92
|
|
MB = $355.87
|
Most Recent Note - 6/14/2018 12:49:32 PM
G - Spiking into new all-time high territory with big volume-driven gains this week, getting very extended from any sound base. Prior highs in the $338-333 area define initial support to watch above its 50 DMA line ($331).
>>> FEATURED STOCK ARTICLE : Rally From Advanced Ascending Base With Volume +50% - 5/24/2018 |
View all notes |
Set NEW NOTE alert |
Company Profile |
SEC
News |
Chart |
Request a new note
C
A
S
I |
DPZ
-
NYSE
Dominos Pizza Inc
Retail-Restaurants
|
$273.65
|
+0.62
0.23% |
$274.41
|
538,972
92.93% of 50 DAV
50 DAV is 580,000
|
$276.12
-0.89%
|
5/21/2018
|
$248.13
|
PP = $255.10
|
|
MB = $267.86
|
Most Recent Note - 6/13/2018 6:11:39 PM
G - Hit another new high with light volume today, getting very extended from the latest base. Its 50 DMA line ($247) and prior highs in the $236 area define important near-term support to watch on pullbacks.
>>> FEATURED STOCK ARTICLE : New High With Gain Backed by Above Average Volume - 6/5/2018 |
View all notes |
Set NEW NOTE alert |
Company Profile |
SEC
News |
Chart |
Request a new note
C
A
S
I |
FIVE
-
NASDAQ
Five Below Inc
Retail-DiscountandVariety
|
$102.09
|
+0.44
0.43% |
$102.94
|
961,846
56.71% of 50 DAV
50 DAV is 1,696,000
|
$103.99
-1.83%
|
6/4/2018
|
$75.96
|
PP = $78.38
|
|
MB = $82.30
|
Most Recent Note - 6/8/2018 11:49:17 AM
G - Gapped up on the prior session hitting a new high and its color code was changed to green after getting very extended from the previously noted base. Reported earnings +133% on +27% sales revenues for the Apr '18 quarter. Disciplined investors avoid chasing stocks that are too extended from a sound base.
>>> FEATURED STOCK ARTICLE : Trading Near 50-Day Average After Falling Into Prior Base - 5/7/2018 |
View all notes |
Set NEW NOTE alert |
Company Profile |
SEC
News |
Chart |
Request a new note
C
A
S
I |
NOW
-
NYSE
Servicenow Inc
Computer Sftwr-Enterprse
|
$185.34
|
+4.11
2.27% |
$187.23
|
2,617,245
143.18% of 50 DAV
50 DAV is 1,828,000
|
$187.39
-1.09%
|
5/8/2018
|
$174.63
|
PP = $176.66
|
|
MB = $185.49
|
Most Recent Note - 6/14/2018 6:22:52 PM
Y - Posted a solid volume-driven gain today indicative of greater institutional buying demand while challenging its "max buy" level and its all-time high. Its 50 DMA line ($173) and prior low define near-term support.
>>> FEATURED STOCK ARTICLE : High-Ranked Software - Enterprise Firm is Near Pivot Point - 5/8/2018 |
View all notes |
Set NEW NOTE alert |
Company Profile |
SEC
News |
Chart |
Request a new note
C
A
S
I |
Symbol/Exchange
Company Name
Industry Group |
PRICE |
CHANGE
(%Change) |
Day High |
Volume
(% DAV)
(% 50 day avg vol) |
52 Wk Hi
% From Hi |
Featured
Date |
Price
Featured |
Pivot Featured |
|
Max Buy |
NVEE
-
NASDAQ
N V 5 Global Inc
Comml Svcs-Consulting
|
$65.95
|
+0.80
1.23% |
$66.00
|
42,284
52.20% of 50 DAV
50 DAV is 81,000
|
$71.90
-8.28%
|
4/9/2018
|
$58.35
|
PP = $59.05
|
|
MB = $62.00
|
Most Recent Note - 6/12/2018 5:59:44 PM
G - It is extended from any sound base. Found prompt support at its 50 DMA line ($60.84) during the recent consolidation.
>>> FEATURED STOCK ARTICLE : Encountered Distributional Pressure After Hitting New High - 5/11/2018 |
View all notes |
Set NEW NOTE alert |
Company Profile |
SEC
News |
Chart |
Request a new note
C
A
S
I |
PANW
-
NYSE
Palo Alto Networks
Computer Sftwr-Security
|
$215.56
|
+2.51
1.18% |
$217.40
|
2,362,935
162.18% of 50 DAV
50 DAV is 1,457,000
|
$214.69
0.41%
|
6/12/2018
|
$206.55
|
PP = $214.69
|
|
MB = $225.42
|
Most Recent Note - 6/14/2018 6:29:08 PM
Y - Posted a 3rd consecutive volume-driven gain today and closed at another new all-time high. Found support at its 10-week moving average following a "negative reversal" on 6/04/18 after an earlier breakout. Color code was changed to yellow as a valid secondary buy point exists from the 10 WMA line up to 5% above the most recent high. Reported earnings +62% on +31% sales revenues for the Apr '18 quarter, continuing its strong earnings track record. See the latest FSU analysis for more details and a new annotated graph.
>>> FEATURED STOCK ARTICLE : New High Close After 2 Consecutive Volume Driven Gains - 6/13/2018 |
View all notes |
Set NEW NOTE alert |
Company Profile |
SEC
News |
Chart |
Request a new note
C
A
S
I |
QLYS
-
NASDAQ
Qualys Inc
Computer Sftwr-Security
|
$94.80
|
+5.70
6.40% |
$97.75
|
1,251,641
406.38% of 50 DAV
50 DAV is 308,000
|
$90.00
5.33%
|
4/17/2018
|
$82.85
|
PP = $79.50
|
|
MB = $83.48
|
Most Recent Note - 6/14/2018 12:52:27 PM
G - Hitting yet another new all-time high with today's 5th consecutive gain, getting very extended from any sound base. Prior highs and its 50 DMA line ($78.58) define near-term support to watch on pullbacks.
>>> FEATURED STOCK ARTICLE : Rebounded Above 50-Day Average Yet Still Faces Overhead Supply - 5/29/2018 |
View all notes |
Set NEW NOTE alert |
Company Profile |
SEC
News |
Chart |
Request a new note
C
A
S
I |
SPLK
-
NASDAQ
Splunk Inc
Computer Sftwr-Database
|
$119.50
|
+1.83
1.56% |
$121.64
|
2,203,894
135.88% of 50 DAV
50 DAV is 1,622,000
|
$119.83
-0.28%
|
5/8/2018
|
$113.14
|
PP = $112.76
|
|
MB = $118.40
|
Most Recent Note - 6/13/2018 6:32:41 PM
Y - Held its ground stubbornly today, quietly perched at its all-time high. Gain on the prior session backed by +45% above average was a reassuring sign of fresh institutional buying demand helping clinch a technical buy signal. Its 50 DMA line ($109.20) and recent low ($107.08 on 5/29/18) define important near-term support to watch on pullbacks.
>>> FEATURED STOCK ARTICLE : Consolidating Near High Following Latest Financial Report - 5/31/2018 |
View all notes |
Set NEW NOTE alert |
Company Profile |
SEC
News |
Chart |
Request a new note
C
A
S
I |
SUPN
-
NASDAQ
Supernus Pharmaceuticals
Medical-Biomed/Biotech
|
$53.75
|
-0.30
-0.56% |
$54.68
|
567,336
75.75% of 50 DAV
50 DAV is 749,000
|
$59.05
-8.98%
|
4/24/2018
|
$47.73
|
PP = $50.15
|
|
MB = $52.66
|
Most Recent Note - 6/13/2018 6:43:55 PM
G - Volume totals have been cooling in recent weeks while consolidating in an orderly fashion. Prior highs in the $49-50 area and its 50 DMA line ($50.88) define near-term support.
>>> FEATURED STOCK ARTICLE : Extended From Prior Base After Spiking Higher - 6/6/2018 |
View all notes |
Set NEW NOTE alert |
Company Profile |
SEC
News |
Chart |
Request a new note
C
A
S
I |
Symbol/Exchange
Company Name
Industry Group |
PRICE |
CHANGE
(%Change) |
Day High |
Volume
(% DAV)
(% 50 day avg vol) |
52 Wk Hi
% From Hi |
Featured
Date |
Price
Featured |
Pivot Featured |
|
Max Buy |
PAYC
-
NYSE
Paycom Software Inc
COMPUTER SOFTWARE and SERVICES - Application Software
|
$113.67
|
+1.95
1.75% |
$114.90
|
878,583
121.69% of 50 DAV
50 DAV is 722,000
|
$118.45
-4.04%
|
2/15/2018
|
$95.01
|
PP = $93.61
|
|
MB = $98.29
|
Most Recent Note - 6/12/2018 5:54:17 PM
G - Rebounded above its 50 DMA line ($108.08) with a big gain today on higher (near average) volume. Still faces some resistance due to overhead supply up to the $118 level. Found prompt support near prior lows in the $101 area.
>>> FEATURED STOCK ARTICLE : Violation of 50-Day Average Triggered Technical Sell Signal - 5/3/2018 |
View all notes |
Set NEW NOTE alert |
Company Profile |
SEC
News |
Chart |
Request a new note
C
A
S
I |
GRUB
-
NYSE
Grubhub Inc
INTERNET - Content
|
$119.86
|
+3.88
3.35% |
$120.00
|
2,846,689
211.81% of 50 DAV
50 DAV is 1,344,000
|
$116.90
2.53%
|
5/30/2018
|
$107.56
|
PP = $105.68
|
|
MB = $110.96
|
Most Recent Note - 6/14/2018 12:39:28 PM
G - Hitting another new high with today's 4th consecutive gain on ever-increasing volume. The prior gain was backed by +76% above average volume, action indicative of fresh institutional buying demand.
>>> FEATURED STOCK ARTICLE : Gain With +25% Above Average Volume for Best Ever Close - 6/12/2018 |
View all notes |
Set NEW NOTE alert |
Company Profile |
SEC
News |
Chart |
Request a new note
C
A
S
I |
HQY
-
NASDAQ
Healthequity Inc
COMPUTER SOFTWARE and SERVICES - Healthcare Information Service
|
$80.18
|
+0.29
0.36% |
$80.70
|
617,652
124.03% of 50 DAV
50 DAV is 498,000
|
$81.40
-1.50%
|
5/2/2018
|
$66.31
|
PP = $68.85
|
|
MB = $72.29
|
Most Recent Note - 6/8/2018 3:28:27 PM
G - Perched near its all-time high, very extended from any sound base. Prior high ($68.75 on 3/22/18) and its 50 DMA line ($69.45) define near term support to watch on pullbacks. See the latest FSU analysis for more details and an annotated graph.
>>> FEATURED STOCK ARTICLE : Pullback After Volume-Driven Gains For New Highs - 6/7/2018 |
View all notes |
Set NEW NOTE alert |
Company Profile |
SEC
News |
Chart |
Request a new note
C
A
S
I |
LOB
-
NASDAQ
Live Oak Bancshares Inc
Banks-Southeast
|
$29.70
|
-0.30
-1.00% |
$30.10
|
72,960
70.83% of 50 DAV
50 DAV is 103,000
|
$31.00
-4.19%
|
5/21/2018
|
$29.35
|
PP = $30.15
|
|
MB = $31.66
|
Most Recent Note - 6/8/2018 11:54:31 AM
Y - Still hovering at its all-time high. Disciplined investors may still be watching for convincing volume-driven gains above the pivot point to trigger a technical buy signal. Prior lows in the $26-27 area define important near term support. Recently reported earnings +63% on +42% for the Mar '18 quarter.
>>> FEATURED STOCK ARTICLE : Bank Perched Near High After Orderly Base - 5/23/2018 |
View all notes |
Set NEW NOTE alert |
Company Profile |
SEC
News |
Chart |
Request a new note
C
A
S
I |
PYPL
-
NASDAQ
Paypal Holdings Inc
Finance-CrdtCard/PmtPr
|
$85.61
|
+0.34
0.40% |
$86.30
|
6,638,982
82.51% of 50 DAV
50 DAV is 8,046,000
|
$86.32
-0.82%
|
5/18/2018
|
$81.63
|
PP = $80.89
|
|
MB = $84.93
|
Most Recent Note - 6/8/2018 5:35:20 PM
Y - Volume totals were light when wedging above the pivot point cited based on its 4/18/18 high and challenging its 52-week high. Confirming gains backed by at least +40% above average volume would be a reassuring sign of fresh institutional buying demand. The 50 DMA line defines near-term support above its 200 DMA line and prior lows in the $71-72 area. Fundamentals remain strong. See the latest FSU analysis for more details and a new annotated graph.
>>> FEATURED STOCK ARTICLE : Gains Have Lacked Volume While Approaching All-Time High - 6/8/2018 |
View all notes |
Set NEW NOTE alert |
Company Profile |
SEC
News |
Chart |
Request a new note
C
A
S
I |
Symbol/Exchange
Company Name
Industry Group |
PRICE |
CHANGE
(%Change) |
Day High |
Volume
(% DAV)
(% 50 day avg vol) |
52 Wk Hi
% From Hi |
Featured
Date |
Price
Featured |
Pivot Featured |
|
Max Buy |
OLLI
-
NASDAQ
Ollie's Bargain Outlet
Retail-DiscountandVariety
|
$75.65
|
+0.75
1.00% |
$76.00
|
692,022
71.86% of 50 DAV
50 DAV is 963,000
|
$77.50
-2.39%
|
4/10/2018
|
$62.05
|
PP = $62.15
|
|
MB = $65.26
|
Most Recent Note - 6/8/2018 5:36:58 PM
G - Retreated from its all-time high with heavy volume behind today's 3rd consecutive loss. Very extended from any sound base. Its 50 DMA line ($65.33) and prior highs define important near-term support to watch on pullbacks.
>>> FEATURED STOCK ARTICLE : Extended From Prior Base After 8 Consecutive Gains - 5/17/2018 |
View all notes |
Set NEW NOTE alert |
Company Profile |
SEC
News |
Chart |
Request a new note
C
A
S
I |
MOMO
-
NASDAQ
Momo Inc Ads Cl A
INTERNET - Content
|
$53.86
|
+0.63
1.18% |
$54.03
|
3,356,030
77.19% of 50 DAV
50 DAV is 4,348,000
|
$54.24
-0.70%
|
6/1/2018
|
$48.62
|
PP = $46.79
|
|
MB = $49.13
|
Most Recent Note - 6/11/2018 12:27:38 PM
G - Hit another new all-time high today. Stubbornly held its ground after volume-driven gains. Disciplined investors avoid chasing stocks extended more than +5% from a sound base. Prior highs in the $45-46 area define initial support to watch on pullbacks.
>>> FEATURED STOCK ARTICLE : Volume-Driven Gain for New All-Time High - 6/1/2018 |
View all notes |
Set NEW NOTE alert |
Company Profile |
SEC
News |
Chart |
Request a new note
C
A
S
I |
NOVT
-
NASDAQ
Novanta Inc
Elec-Scientific/Msrng
|
$67.60
|
+0.90
1.35% |
$67.80
|
263,984
115.28% of 50 DAV
50 DAV is 229,000
|
$68.00
-0.59%
|
4/17/2018
|
$60.55
|
PP = $60.40
|
|
MB = $63.42
|
Most Recent Note - 6/13/2018 6:26:56 PM
G - Endured distributional pressure today when poised for a best-ever close after wedging higher. Recent gains lacked great volume-conviction.
>>> FEATURED STOCK ARTICLE : Quietly Hovering Near All-Time High - 5/25/2018 |
View all notes |
Set NEW NOTE alert |
Company Profile |
SEC
News |
Chart |
Request a new note
C
A
S
I |
BZUN
-
NASDAQ
Baozun Inc Cl A Ads
Computer Sftwr-Enterprse
|
$64.38
|
-0.38
-0.59% |
$65.21
|
2,231,593
88.00% of 50 DAV
50 DAV is 2,536,000
|
$67.41
-4.49%
|
5/15/2018
|
$45.38
|
PP = $52.43
|
|
MB = $55.05
|
Most Recent Note - 6/13/2018 6:05:16 PM
G - Very extended from the prior base. Prior highs in the $51-53 area and its 50 DMA line ($51.79) define support to watch on pullbacks.
>>> FEATURED STOCK ARTICLE : Earnings News Due; Formed a Base-on-Base Pattern - 5/16/2018 |
View all notes |
Set NEW NOTE alert |
Company Profile |
SEC
News |
Chart |
Request a new note
C
A
S
I |
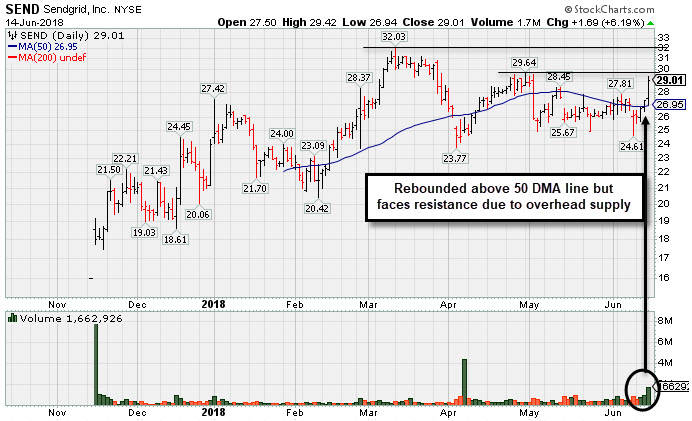
SEND
-
NYSE
Sendgrid Inc
INTERNET - Content
|
$29.01
|
+1.69
6.19% |
$29.42
|
1,662,926
311.41% of 50 DAV
50 DAV is 534,000
|
$32.03
-9.42%
|
3/6/2018
|
$28.00
|
PP = $28.37
|
|
MB = $29.79
|
Most Recent Note - 6/14/2018 6:20:17 PM
G - Rallied above its 50 DMA line helping its outlook improve with volume-driven gains this week. Still faces resistance due to overhead supply up to the $32 level. Recent lows in the $23-24 area define important support to watch on pullbacks. Showed resilience since it completed a new Public Offering and Secondary Offering on 4/05/18. See the latest FSU analysis for more details and a new annotated graph.
>>> FEATURED STOCK ARTICLE : Volume-Driven Gains Above 50-Day Average Help Outlook Improve - 6/14/2018 |
View all notes |
Set NEW NOTE alert |
Company Profile |
SEC
News |
Chart |
Request a new note
C
A
S
I |
Symbol/Exchange
Company Name
Industry Group |
PRICE |
CHANGE
(%Change) |
Day High |
Volume
(% DAV)
(% 50 day avg vol) |
52 Wk Hi
% From Hi |
Featured
Date |
Price
Featured |
Pivot Featured |
|
Max Buy |