***Last / Change / Volume data in this table is the closing quote data***
Symbol/Exchange
Company Name
Industry Group |
PRICE |
CHANGE
(%Change) |
Day High |
Volume
(% DAV)
(% 50 day avg vol) |
52 Wk Hi
% From Hi |
Featured
Date |
Price
Featured |
Pivot Featured |
|
Max Buy |
OSBC
-
NASDAQ
Old Second Bancorp Inc
BANKING - Regional - Midwest Banks
|
$15.10
|
-0.10
-0.66% |
$15.15
|
58,518
104.50% of 50 DAV
50 DAV is 56,000
|
$15.55
-2.89%
|
5/21/2018
|
$15.50
|
PP = $15.10
|
|
MB = $15.86
|
 Most Recent Note - 6/12/2018 5:47:50 PM
Y - Recently encountered distributional pressure yet it remains hovering near its high. Stalled after highlighted in yellow on 5/21/18 with pivot point cited based on prior highs plus 10 cents. Fundamentals remain strong.
>>> FEATURED STOCK ARTICLE : Hit New High Today After Orderly Consolidation - 5/21/2018 |
View all notes |
Set NEW NOTE alert |
Company Profile |
SEC
News |
Chart |
Request a new note
C
A
S
I |
PFBC
-
NASDAQ
Preferred Bank Los Angls
BANKING - Regional - Pacific Banks
|
$65.07
|
-0.71
-1.08% |
$66.07
|
41,097
51.31% of 50 DAV
50 DAV is 80,100
|
$67.88
-4.14%
|
5/18/2018
|
$62.91
|
PP = $67.75
|
|
MB = $71.14
|
Most Recent Note - 6/11/2018 5:52:22 PM
Y - Pulled back on lighter volume today, slumping toward its 50 DMA line ($64.66). Its Relative Strength rating is still below the 80+ minimum guideline at 72, yet it ended only -3.1% off its high. Subsequent gains above the pivot point are needed to trigger a technical buy signal.
>>> FEATURED STOCK ARTICLE : Some Technical Sputtering Yet Bank is Still Only -7% Off High - 5/18/2018 |
View all notes |
Set NEW NOTE alert |
Company Profile |
SEC
News |
Chart |
Request a new note
C
A
S
I |
SIVB
-
NASDAQ
S V B Financial Group
BANKING - Regional - Pacific Banks
|
$320.14
|
-0.97
-0.30% |
$323.38
|
297,070
54.51% of 50 DAV
50 DAV is 545,000
|
$329.65
-2.88%
|
3/12/2018
|
$267.79
|
PP = $263.19
|
|
MB = $276.35
|
Most Recent Note - 6/11/2018 5:56:08 PM
G - Touched a new all-time high today but reversed and ended lower. Fundamentals are strong.
>>> FEATURED STOCK ARTICLE : Wedging Higher Following Big Breakaway Gap - 5/22/2018 |
View all notes |
Set NEW NOTE alert |
Company Profile |
SEC
News |
Chart |
Request a new note
C
A
S
I |
UCFC
-
NASDAQ
United Community Finl Cp
BANKING - Savings and Loans
|
$10.74
|
-0.09
-0.83% |
$10.87
|
206,405
168.22% of 50 DAV
50 DAV is 122,700
|
$10.95
-1.92%
|
5/30/2018
|
$10.50
|
PP = $10.80
|
|
MB = $11.34
|
Most Recent Note - 6/12/2018 1:15:23 PM
Y - Churned above average volume in recent weeks while making very little headway above prior highs. Gain on 6/06/18 backed by 4 times average volume triggered a technical buy signal.
>>> FEATURED STOCK ARTICLE : Small Savings & Loan Perched Near High - 5/30/2018 |
View all notes |
Set NEW NOTE alert |
Company Profile |
SEC
News |
Chart |
Request a new note
C
A
S
I |
EPAM
-
NYSE
Epam Systems Inc
COMPUTER SOFTWARE and SERVICES - Information Technology Service
|
$127.58
|
+1.64
1.30% |
$127.71
|
274,969
98.91% of 50 DAV
50 DAV is 278,000
|
$131.75
-3.17%
|
5/9/2018
|
$120.34
|
PP = $125.98
|
|
MB = $132.28
|
Most Recent Note - 6/12/2018 5:56:29 PM
Y - Still consolidating in a tight range above near-term support defined by prior highs and its 50 DMA line ($119.75).
>>> FEATURED STOCK ARTICLE : Volume-Driven Gain Challenged Prior High Following Earnings - 5/9/2018 |
View all notes |
Set NEW NOTE alert |
Company Profile |
SEC
News |
Chart |
Request a new note
C
A
S
I |
Symbol/Exchange
Company Name
Industry Group |
PRICE |
CHANGE
(%Change) |
Day High |
Volume
(% DAV)
(% 50 day avg vol) |
52 Wk Hi
% From Hi |
Featured
Date |
Price
Featured |
Pivot Featured |
|
Max Buy |
MA
-
NYSE
Mastercard Inc Cl A
Finance-CrdtCard/PmtPr
|
$200.13
|
+1.64
0.83% |
$200.15
|
2,659,506
71.45% of 50 DAV
50 DAV is 3,722,000
|
$204.00
-1.90%
|
5/2/2018
|
$184.96
|
PP = $183.83
|
|
MB = $193.02
|
Most Recent Note - 6/12/2018 6:01:30 PM
G - Volume totals have been cooling while hovering near its all-time high. Its 50 DMA line (185.58) and prior high ($183.73) define support to watch on pullbacks.
>>> FEATURED STOCK ARTICLE : Gap Up and Volume Driven Gain for New High After Earnings - 5/2/2018 |
View all notes |
Set NEW NOTE alert |
Company Profile |
SEC
News |
Chart |
Request a new note
C
A
S
I |
V
-
NYSE
Visa Inc Cl A
Finance-CrdtCard/PmtPr
|
$134.86
|
+0.95
0.71% |
$135.13
|
5,733,440
78.75% of 50 DAV
50 DAV is 7,281,000
|
$136.58
-1.26%
|
4/26/2018
|
$126.68
|
PP = $126.98
|
|
MB = $133.33
|
Most Recent Note - 6/11/2018 6:09:11 PM
G - Hovering near its "max buy" level. Prior highs in the $126 area and its 50 DMA line ($127) define near-term support to watch on pullbacks. See the latest FSU analysis for more details and a new annotated graph.
>>> FEATURED STOCK ARTICLE : Encountered Distributional Pressure at All-Time High - 6/11/2018 |
View all notes |
Set NEW NOTE alert |
Company Profile |
SEC
News |
Chart |
Request a new note
C
A
S
I |
TPL
-
NYSE
Texas Pacific Land Trust
Real Estate Dvlpmt/Ops
|
$701.00
|
+0.33
0.05% |
$702.34
|
7,501
37.51% of 50 DAV
50 DAV is 20,000
|
$739.89
-5.26%
|
4/13/2018
|
$547.85
|
PP = $552.10
|
|
MB = $579.71
|
Most Recent Note - 6/7/2018 12:52:15 PM
G - Perched near its all-time high, still very extended from any sound base. Its 50 DMA line ($604) defines important support to watch above the prior highs in the $569-552 area.
>>> FEATURED STOCK ARTICLE : Negative Reversal on Higher Volume After Hitting New All-Time High - 6/4/2018 |
View all notes |
Set NEW NOTE alert |
Company Profile |
SEC
News |
Chart |
Request a new note
C
A
S
I |
STMP
-
NASDAQ
Stamps.com Inc
Retail-Internet
|
$272.30
|
+5.35
2.00% |
$273.04
|
311,137
106.19% of 50 DAV
50 DAV is 293,000
|
$268.89
1.27%
|
5/4/2018
|
$234.15
|
PP = $233.23
|
|
MB = $244.89
|
Most Recent Note - 6/6/2018 3:09:35 PM
G - Wedging to new all-time highs with recent gains lacking great volume conviction. Extended from prior highs in the $233 area which define initial support above its 50 DMA line ($230).
>>> FEATURED STOCK ARTICLE : Volume-Driven Gain For New High - 5/4/2018 |
View all notes |
Set NEW NOTE alert |
Company Profile |
SEC
News |
Chart |
Request a new note
C
A
S
I |
CHDN
-
NASDAQ
Churchill Downs Inc
LEISURE - Gaming Activities
|
$304.10
|
+3.25
1.08% |
$305.90
|
57,645
53.38% of 50 DAV
50 DAV is 108,000
|
$314.60
-3.34%
|
5/14/2018
|
$285.80
|
PP = $285.80
|
|
MB = $300.09
|
Most Recent Note - 6/6/2018 3:13:49 PM
G - Color code is changed to green after rising back above its "max buy" level. Prior highs in the $285-279 area define initial support to watch above its 50 DMA line ($272).
>>> FEATURED STOCK ARTICLE : Breakout Followed New Supreme Court Ruling on Sports Betting - 5/14/2018 |
View all notes |
Set NEW NOTE alert |
Company Profile |
SEC
News |
Chart |
Request a new note
C
A
S
I |
Symbol/Exchange
Company Name
Industry Group |
PRICE |
CHANGE
(%Change) |
Day High |
Volume
(% DAV)
(% 50 day avg vol) |
52 Wk Hi
% From Hi |
Featured
Date |
Price
Featured |
Pivot Featured |
|
Max Buy |
HTHT
-
NASDAQ
China Lodging Group Ads
LEISURE - Lodging
|
$48.67
|
+0.95
1.99% |
$48.97
|
1,588,403
70.35% of 50 DAV
50 DAV is 2,258,000
|
$49.45
-1.58%
|
5/15/2018
|
$34.52
|
PP = $41.57
|
|
MB = $43.65
|
Most Recent Note - 6/6/2018 6:19:03 PM
G - Hit another new all-time high with today's 4th consecutive gain on average or below average volume. Prior highs in the $40-41 area define initial support to watch on pullbacks. Do not be confused by the 4:1 split impacting share prices (Price Featured, Pivot Point and Max Buy were updated to account for the split).
>>> FEATURED STOCK ARTICLE : New Volume-Driven Breakout For All-Time High - 5/15/2018 |
View all notes |
Set NEW NOTE alert |
Company Profile |
SEC
News |
Chart |
Request a new note
C
A
S
I |
NFLX
-
NASDAQ
Netflix Inc
SPECIALTY RETAIL - Music and Video Stores
|
$363.83
|
+2.38
0.66% |
$365.98
|
4,156,779
45.90% of 50 DAV
50 DAV is 9,057,000
|
$369.83
-1.62%
|
5/24/2018
|
$348.85
|
PP = $338.92
|
|
MB = $355.87
|
Most Recent Note - 6/12/2018 5:57:59 PM
G - Volume totals have been cooling while holding its ground stubbornly near its all-time high. Prior highs in the $338-333 area define initial support to watch above its 50 DMA line ($327).
>>> FEATURED STOCK ARTICLE : Rally From Advanced Ascending Base With Volume +50% - 5/24/2018 |
View all notes |
Set NEW NOTE alert |
Company Profile |
SEC
News |
Chart |
Request a new note
C
A
S
I |
DPZ
-
NYSE
Dominos Pizza Inc
Retail-Restaurants
|
$273.20
|
+3.43
1.27% |
$273.62
|
550,471
94.10% of 50 DAV
50 DAV is 585,000
|
$273.57
-0.13%
|
5/21/2018
|
$248.13
|
PP = $255.10
|
|
MB = $267.86
|
Most Recent Note - 6/6/2018 6:20:42 PM
G - Color code is changed to green after rising above its "max buy" level with today's 4th consecutive gain. Its 50 DMA line ($243) and prior highs in the $236 area define important near-term support to watch on pullbacks.
>>> FEATURED STOCK ARTICLE : New High With Gain Backed by Above Average Volume - 6/5/2018 |
View all notes |
Set NEW NOTE alert |
Company Profile |
SEC
News |
Chart |
Request a new note
C
A
S
I |
FIVE
-
NASDAQ
Five Below Inc
Retail-DiscountandVariety
|
$101.89
|
+0.65
0.64% |
$103.08
|
1,285,295
75.96% of 50 DAV
50 DAV is 1,692,000
|
$102.87
-0.95%
|
6/4/2018
|
$75.96
|
PP = $78.38
|
|
MB = $82.30
|
Most Recent Note - 6/8/2018 11:49:17 AM
G - Gapped up on the prior session hitting a new high and its color code was changed to green after getting very extended from the previously noted base. Reported earnings +133% on +27% sales revenues for the Apr '18 quarter. Disciplined investors avoid chasing stocks that are too extended from a sound base.
>>> FEATURED STOCK ARTICLE : Trading Near 50-Day Average After Falling Into Prior Base - 5/7/2018 |
View all notes |
Set NEW NOTE alert |
Company Profile |
SEC
News |
Chart |
Request a new note
C
A
S
I |
NOW
-
NYSE
Servicenow Inc
Computer Sftwr-Enterprse
|
$181.84
|
+1.76
0.98% |
$182.55
|
1,417,223
76.77% of 50 DAV
50 DAV is 1,846,000
|
$187.39
-2.96%
|
5/8/2018
|
$174.63
|
PP = $176.66
|
|
MB = $185.49
|
Most Recent Note - 6/7/2018 5:22:22 PM
Y - Pulled back today with higher volume indicative of distributional pressure, retreating from its all-time high and its color code is changed to yellow. Its 50 DMA line ($171) and prior low define near-term support.
>>> FEATURED STOCK ARTICLE : High-Ranked Software - Enterprise Firm is Near Pivot Point - 5/8/2018 |
View all notes |
Set NEW NOTE alert |
Company Profile |
SEC
News |
Chart |
Request a new note
C
A
S
I |
Symbol/Exchange
Company Name
Industry Group |
PRICE |
CHANGE
(%Change) |
Day High |
Volume
(% DAV)
(% 50 day avg vol) |
52 Wk Hi
% From Hi |
Featured
Date |
Price
Featured |
Pivot Featured |
|
Max Buy |
NVEE
-
NASDAQ
N V 5 Global Inc
Comml Svcs-Consulting
|
$64.95
|
+0.65
1.01% |
$64.95
|
40,565
49.47% of 50 DAV
50 DAV is 82,000
|
$71.90
-9.67%
|
4/9/2018
|
$58.35
|
PP = $59.05
|
|
MB = $62.00
|
Most Recent Note - 6/12/2018 5:59:44 PM
G - It is extended from any sound base. Found prompt support at its 50 DMA line ($60.84) during the recent consolidation.
>>> FEATURED STOCK ARTICLE : Encountered Distributional Pressure After Hitting New High - 5/11/2018 |
View all notes |
Set NEW NOTE alert |
Company Profile |
SEC
News |
Chart |
Request a new note
C
A
S
I |
PANW
-
NYSE
Palo Alto Networks
Computer Sftwr-Security
|
$207.42
|
+8.71
4.38% |
$207.55
|
2,245,589
158.70% of 50 DAV
50 DAV is 1,415,000
|
$214.69
-3.39%
|
6/12/2018
|
$206.55
|
PP = $214.69
|
|
MB = $225.42
|
Most Recent Note - 6/12/2018 1:05:37 PM
Y - Gapped up today. Found support at its 10-week moving average following a "negative reversal" on 6/04/18 after an earlier breakout. Color code is changed to yellow as a valid secondary buy point exists from the 10 WMA line up to 5% above the most recent high. Reported earnings +62% on +31% sales revenues for the Apr '18 quarter, continuing its strong earnings track record. Went through a deep consolidation since dropped from the Featured Stocks list on 1/07/16.
>>> FEATURED STOCK ARTICLE : Halted Slide at 50-Day Moving Average - 12/29/2015 |
View all notes |
Set NEW NOTE alert |
Company Profile |
SEC
News |
Chart |
Request a new note
C
A
S
I |
QLYS
-
NASDAQ
Qualys Inc
Computer Sftwr-Security
|
$88.60
|
+3.15
3.69% |
$88.90
|
614,521
209.02% of 50 DAV
50 DAV is 294,000
|
$86.00
3.02%
|
4/17/2018
|
$82.85
|
PP = $79.50
|
|
MB = $83.48
|
Most Recent Note - 6/12/2018 1:09:53 PM
G - Hitting another new all-time high with today's 3rd consecutive gain, rallying further above the previously cited "max buy" level while no resistance remains due to overhead supply. Its 50 DMA line and prior lows define near-term support to watch on pullbacks.
>>> FEATURED STOCK ARTICLE : Rebounded Above 50-Day Average Yet Still Faces Overhead Supply - 5/29/2018 |
View all notes |
Set NEW NOTE alert |
Company Profile |
SEC
News |
Chart |
Request a new note
C
A
S
I |
SPLK
-
NASDAQ
Splunk Inc
Computer Sftwr-Database
|
$118.40
|
+1.33
1.14% |
$119.83
|
2,346,371
146.10% of 50 DAV
50 DAV is 1,606,000
|
$119.15
-0.63%
|
5/8/2018
|
$113.14
|
PP = $112.76
|
|
MB = $118.40
|
Most Recent Note - 6/6/2018 3:11:06 PM
Y - Quietly perched near its all-time high. Found support above its 50 DMA line ($107.28) after volume-driven losses tested the prior high in the $108 area. More damaging losses would raise greater concerns and trigger technical sell signals. Confirming gains above the stock's pivot point backed by a minimum of +40% above average would be a reassuring sign of fresh institutional buying demand and may clinch a proper technical buy signal. See the latest FSU analysis for more details and a new annotated graph.
>>> FEATURED STOCK ARTICLE : Consolidating Near High Following Latest Financial Report - 5/31/2018 |
View all notes |
Set NEW NOTE alert |
Company Profile |
SEC
News |
Chart |
Request a new note
C
A
S
I |
SUPN
-
NASDAQ
Supernus Pharmaceuticals
Medical-Biomed/Biotech
|
$54.00
|
-0.70
-1.28% |
$55.85
|
485,285
64.19% of 50 DAV
50 DAV is 756,000
|
$59.05
-8.55%
|
4/24/2018
|
$47.73
|
PP = $50.15
|
|
MB = $52.66
|
Most Recent Note - 6/6/2018 6:14:43 PM
G - Consolidating near its all-time high, extended from the previously noted base. Prior highs in the $49-50 area define support to watch along with its 50 DMA line ($49.99). See the latest FSU analysis for more details and a new annotated graph.
>>> FEATURED STOCK ARTICLE : Extended From Prior Base After Spiking Higher - 6/6/2018 |
View all notes |
Set NEW NOTE alert |
Company Profile |
SEC
News |
Chart |
Request a new note
C
A
S
I |
Symbol/Exchange
Company Name
Industry Group |
PRICE |
CHANGE
(%Change) |
Day High |
Volume
(% DAV)
(% 50 day avg vol) |
52 Wk Hi
% From Hi |
Featured
Date |
Price
Featured |
Pivot Featured |
|
Max Buy |
PAYC
-
NYSE
Paycom Software Inc
COMPUTER SOFTWARE and SERVICES - Application Software
|
$110.45
|
+3.81
3.57% |
$110.86
|
779,563
109.03% of 50 DAV
50 DAV is 715,000
|
$118.45
-6.75%
|
2/15/2018
|
$95.01
|
PP = $93.61
|
|
MB = $98.29
|
Most Recent Note - 6/12/2018 5:54:17 PM
G - Rebounded above its 50 DMA line ($108.08) with a big gain today on higher (near average) volume. Still faces some resistance due to overhead supply up to the $118 level. Found prompt support near prior lows in the $101 area.
>>> FEATURED STOCK ARTICLE : Violation of 50-Day Average Triggered Technical Sell Signal - 5/3/2018 |
View all notes |
Set NEW NOTE alert |
Company Profile |
SEC
News |
Chart |
Request a new note
C
A
S
I |
GRUB
-
NYSE
Grubhub Inc
INTERNET - Content
|
$112.82
|
+5.25
4.88% |
$113.25
|
1,655,703
125.81% of 50 DAV
50 DAV is 1,316,000
|
$113.61
-0.70%
|
5/30/2018
|
$107.56
|
PP = $105.68
|
|
MB = $110.96
|
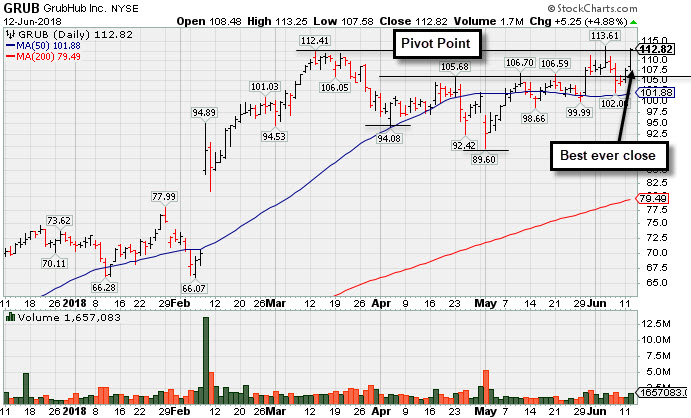
Most Recent Note - 6/12/2018 5:51:15 PM
Y - Posted a big gain today with +26% above average volume for a best-ever close above its "max buy" level and its color code is changed to green. Recent gains above the pivot point lacked the +40% above average volume needed to trigger a convincing technical buy signal. Found support near its 50 DMA line ($101.88). Recently reported earnings +79% on +49% sales revenues for the Mar '18 quarter. See the latest FSU analysis for more details and a new annotated graph.
>>> FEATURED STOCK ARTICLE : Gain With +25% Above Average Volume for Best Ever Close - 6/12/2018 |
View all notes |
Set NEW NOTE alert |
Company Profile |
SEC
News |
Chart |
Request a new note
C
A
S
I |
HQY
-
NASDAQ
Healthequity Inc
COMPUTER SOFTWARE and SERVICES - Healthcare Information Service
|
$79.98
|
+1.42
1.81% |
$80.07
|
712,590
143.09% of 50 DAV
50 DAV is 498,000
|
$80.73
-0.93%
|
5/2/2018
|
$66.31
|
PP = $68.85
|
|
MB = $72.29
|
Most Recent Note - 6/8/2018 3:28:27 PM
G - Perched near its all-time high, very extended from any sound base. Prior high ($68.75 on 3/22/18) and its 50 DMA line ($69.45) define near term support to watch on pullbacks. See the latest FSU analysis for more details and an annotated graph.
>>> FEATURED STOCK ARTICLE : Pullback After Volume-Driven Gains For New Highs - 6/7/2018 |
View all notes |
Set NEW NOTE alert |
Company Profile |
SEC
News |
Chart |
Request a new note
C
A
S
I |
LOB
-
NASDAQ
Live Oak Bancshares Inc
Banks-Southeast
|
$29.60
|
-0.30
-1.00% |
$30.10
|
67,315
64.73% of 50 DAV
50 DAV is 104,000
|
$31.00
-4.52%
|
5/21/2018
|
$29.35
|
PP = $30.15
|
|
MB = $31.66
|
Most Recent Note - 6/8/2018 11:54:31 AM
Y - Still hovering at its all-time high. Disciplined investors may still be watching for convincing volume-driven gains above the pivot point to trigger a technical buy signal. Prior lows in the $26-27 area define important near term support. Recently reported earnings +63% on +42% for the Mar '18 quarter.
>>> FEATURED STOCK ARTICLE : Bank Perched Near High After Orderly Base - 5/23/2018 |
View all notes |
Set NEW NOTE alert |
Company Profile |
SEC
News |
Chart |
Request a new note
C
A
S
I |
PYPL
-
NASDAQ
Paypal Holdings Inc
Finance-CrdtCard/PmtPr
|
$85.02
|
+1.13
1.35% |
$86.20
|
8,713,540
107.35% of 50 DAV
50 DAV is 8,117,000
|
$86.32
-1.51%
|
5/18/2018
|
$81.63
|
PP = $80.89
|
|
MB = $84.93
|
Most Recent Note - 6/8/2018 5:35:20 PM
Y - Volume totals were light when wedging above the pivot point cited based on its 4/18/18 high and challenging its 52-week high. Confirming gains backed by at least +40% above average volume would be a reassuring sign of fresh institutional buying demand. The 50 DMA line defines near-term support above its 200 DMA line and prior lows in the $71-72 area. Fundamentals remain strong. See the latest FSU analysis for more details and a new annotated graph.
>>> FEATURED STOCK ARTICLE : Gains Have Lacked Volume While Approaching All-Time High - 6/8/2018 |
View all notes |
Set NEW NOTE alert |
Company Profile |
SEC
News |
Chart |
Request a new note
C
A
S
I |
Symbol/Exchange
Company Name
Industry Group |
PRICE |
CHANGE
(%Change) |
Day High |
Volume
(% DAV)
(% 50 day avg vol) |
52 Wk Hi
% From Hi |
Featured
Date |
Price
Featured |
Pivot Featured |
|
Max Buy |
OLLI
-
NASDAQ
Ollie's Bargain Outlet
Retail-DiscountandVariety
|
$74.85
|
+0.70
0.94% |
$75.25
|
770,428
80.59% of 50 DAV
50 DAV is 956,000
|
$77.50
-3.42%
|
4/10/2018
|
$62.05
|
PP = $62.15
|
|
MB = $65.26
|
Most Recent Note - 6/8/2018 5:36:58 PM
G - Retreated from its all-time high with heavy volume behind today's 3rd consecutive loss. Very extended from any sound base. Its 50 DMA line ($65.33) and prior highs define important near-term support to watch on pullbacks.
>>> FEATURED STOCK ARTICLE : Extended From Prior Base After 8 Consecutive Gains - 5/17/2018 |
View all notes |
Set NEW NOTE alert |
Company Profile |
SEC
News |
Chart |
Request a new note
C
A
S
I |
MOMO
-
NASDAQ
Momo Inc Ads Cl A
INTERNET - Content
|
$52.98
|
+0.12
0.23% |
$53.36
|
3,430,702
78.99% of 50 DAV
50 DAV is 4,343,000
|
$54.24
-2.32%
|
6/1/2018
|
$48.62
|
PP = $46.79
|
|
MB = $49.13
|
Most Recent Note - 6/11/2018 12:27:38 PM
G - Hit another new all-time high today. Stubbornly held its ground after volume-driven gains. Disciplined investors avoid chasing stocks extended more than +5% from a sound base. Prior highs in the $45-46 area define initial support to watch on pullbacks.
>>> FEATURED STOCK ARTICLE : Volume-Driven Gain for New All-Time High - 6/1/2018 |
View all notes |
Set NEW NOTE alert |
Company Profile |
SEC
News |
Chart |
Request a new note
C
A
S
I |
NOVT
-
NASDAQ
Novanta Inc
Elec-Scientific/Msrng
|
$67.30
|
+0.85
1.28% |
$67.40
|
145,460
64.36% of 50 DAV
50 DAV is 226,000
|
$68.00
-1.03%
|
4/17/2018
|
$60.55
|
PP = $60.40
|
|
MB = $63.42
|
Most Recent Note - 6/6/2018 3:12:37 PM
G - Hitting another new high with today's 8th consecutive gain. Found support near prior highs in the $58 area and stayed above its 50 DMA line ($59.60) during the recent consolidation.
>>> FEATURED STOCK ARTICLE : Quietly Hovering Near All-Time High - 5/25/2018 |
View all notes |
Set NEW NOTE alert |
Company Profile |
SEC
News |
Chart |
Request a new note
C
A
S
I |
BZUN
-
NASDAQ
Baozun Inc Cl A Ads
Computer Sftwr-Enterprse
|
$66.33
|
+1.93
3.00% |
$67.41
|
2,018,022
79.99% of 50 DAV
50 DAV is 2,523,000
|
$65.65
1.04%
|
5/15/2018
|
$45.38
|
PP = $52.43
|
|
MB = $55.05
|
Most Recent Note - 6/12/2018 5:52:03 PM
G - Hit yet another new all-time high with 3rd consecutive today's gain on below average volume, getting more extended from the prior base. Prior highs in the $51-53 area and its 50 DMA line define support to watch on pullbacks.
>>> FEATURED STOCK ARTICLE : Earnings News Due; Formed a Base-on-Base Pattern - 5/16/2018 |
View all notes |
Set NEW NOTE alert |
Company Profile |
SEC
News |
Chart |
Request a new note
C
A
S
I |
SEND
-
NYSE
Sendgrid Inc
INTERNET - Content
|
$26.70
|
+0.65
2.50% |
$26.80
|
767,955
150.88% of 50 DAV
50 DAV is 509,000
|
$32.03
-16.63%
|
3/6/2018
|
$28.00
|
PP = $28.37
|
|
MB = $29.79
|
Most Recent Note - 6/8/2018 3:25:55 PM
G - Gapped down today slumping back below its 50 DMA line ($26.89) toward prior lows. The prior low ($23.77 on 4/04/18) defines the next important support to watch. Faces resistance due to overhead supply up to the $32 level. Completed a new Public Offering and Secondary Offering on 4/05/18.
>>> FEATURED STOCK ARTICLE : Earnings News Continues to be Strong - 5/1/2018 |
View all notes |
Set NEW NOTE alert |
Company Profile |
SEC
News |
Chart |
Request a new note
C
A
S
I |
Symbol/Exchange
Company Name
Industry Group |
PRICE |
CHANGE
(%Change) |
Day High |
Volume
(% DAV)
(% 50 day avg vol) |
52 Wk Hi
% From Hi |
Featured
Date |
Price
Featured |
Pivot Featured |
|
Max Buy |