You are not logged in.
This means you
CAN ONLY VIEW reports that were published prior to Thursday, March 20, 2025.
You
MUST UPGRADE YOUR MEMBERSHIP if you want to see any current reports.
AFTER MARKET UPDATE - TUESDAY, DECEMBER 29TH, 2015
Previous After Market Report Next After Market Report >>>
|
|
|
|
DOW |
+192.71 |
17,720.98 |
+1.10% |
|
Volume |
572,422,600 |
-4% |
|
Volume |
1,271,937,210 |
+5% |
|
NASDAQ |
+66.95 |
5,107.94 |
+1.33% |
|
Advancers |
2,277 |
74% |
|
Advancers |
2,028 |
70% |
|
S&P 500 |
+21.86 |
2,078.36 |
+1.06% |
|
Decliners |
793 |
26% |
|
Decliners |
864 |
30% |
|
Russell 2000 |
+12.31 |
1,160.52 |
+1.07% |
|
52 Wk Highs |
100 |
|
|
52 Wk Highs |
81 |
|
|
S&P 600 |
+7.06 |
687.44 |
+1.04% |
|
52 Wk Lows |
31 |
|
|
52 Wk Lows |
52 |
|
|
 |
Major Averages Rebounded and Leadership Improved
Kenneth J. Gruneisen - Passed the CAN SLIM® Master's Exam
Stocks finished soundly higher on Tuesday. The Dow climbed 192 points to 17720. The S&P 500 added 21 points to 2078. The NASDAQ gained 66 points at 5107. Volume totals were lighter than average, lower on the NYSE while slightly higher than the prior session total on the Nasdaq exchange. Breadth was positive as advancers led decliners by almost a 3-1 margin on the NYSE and 5-2 the Nasdaq exchange. There were 52 high-ranked companies from the Leaders List that made new 52-week highs and were listed on the BreakOuts Page, up from 16 on the prior session. There were gains for all high-ranked companies currently on the Featured Stocks Page. New 52-week highs outnumbered new 52-week lows on the NYSE and on the Nasdaq exchange. Charts used courtesy of www.stockcharts.com
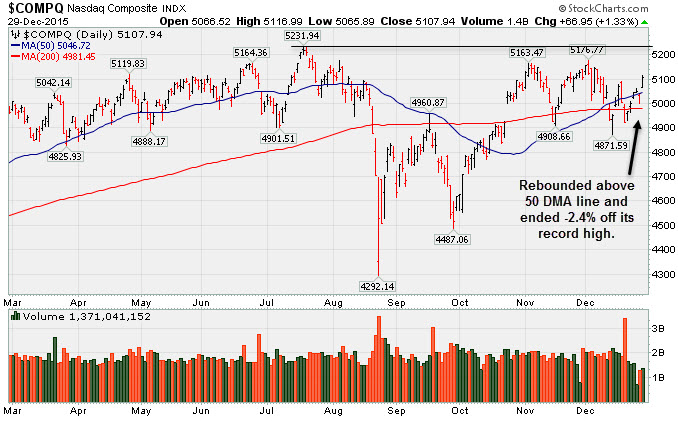
PICTURED: The Nasdaq Composite Index rebounded above its 50-day moving average (DMA) lines and ended -2.4% off its record high. New leadership (stocks hitting new highs) improved while the major averages (M criteria) have repaired recent damage and avoided a deeper correction. The major averages advanced, propelling the S&P 500 into positive territory for 2015. On the economic front, the consumer confidence index increased to 96.5 in December, up from 90.4 in the prior month and well ahead of the 93.5 level projected by analysts. In a separate release, the Case-Shiller index showed home prices rose 5.5% in October from a year ago. In corporate news, Willis Group (WSH +4.55%) following the announcement that the broker will replace watchmaker Fossil (FOSL +1.06%) in the S&P 500 index. Pep-Boys (PBY +8.79%) rose after activist investor Carl Icahn raised his bid to acquire the auto parts retailer. Freeport-McMoRan (FCX 1.75%) on news of Chairman James Moffett’s resignation from the company. All ten sectors in the S&P 500 finished higher on the session with technology and healthcare stocks pacing the gains. Treasuries retreated across the curve with the 10-year note falling 21/32 to yield 2.31%. In commodities, WTI crude rebounded 2.8% to $37.83/barrel on the NYMEX after a 3% decline on Monday. COMEX gold was 0.7% higher at $1077.50/ounce. In FOREX, the dollar gained modestly with particular strength against the euro. The Featured Stocks Page includes most current notes with headline links for access to more detailed letter-by-letter analysis including price/volume graphs annotated by our experts. See the Premium Member Homepage for archives to all prior pay reports.
|
 Kenneth J. Gruneisen started out as a licensed stockbroker in August 1987, a couple of months prior to the historic stock market crash that took the Dow Jones Industrial Average down -22.6% in a single day. He has published daily fact-based fundamental and technical analysis on high-ranked stocks online for two decades. Through FACTBASEDINVESTING.COM, Kenneth provides educational articles, news, market commentary, and other information regarding proven investment systems that work in good times and bad.
Comments contained in the body of this report are technical opinions only and are not necessarily those of Gruneisen Growth Corp. The material herein has been obtained from sources believed to be reliable and accurate, however, its accuracy and completeness cannot be guaranteed. Our firm, employees, and customers may effect transactions, including transactions contrary to any recommendation herein, or have positions in the securities mentioned herein or options with respect thereto. Any recommendation contained in this report may not be suitable for all investors and it is not to be deemed an offer or solicitation on our part with respect to the purchase or sale of any securities. |
|
 |
Tech, Financial, and Retail Groups Led Widespread Rally
Kenneth J. Gruneisen - Passed the CAN SLIM® Master's Exam
The Oil Services Index ($OSX +0.51%) and the Integrated Oil Index ($XOI +0.60%) both edged higher and the Gold & Silver Index ($XAU +0.81%) also rose. The Retail Index ($RLX+1.66%) and the Bank Index ($BKX+1.02%) and Broker/Dealer Index ($XBD +0.97%) also had a positive influence on the major averages on Tuesday's session. Rounding out the widely positive session the Biotechnology Index ($BTK +1.59%), Networking Index ($NWX +1.24%) and the Semiconductor Index ($SOX +1.19%) ended unanimously higher.Charts courtesy www.stockcharts.com
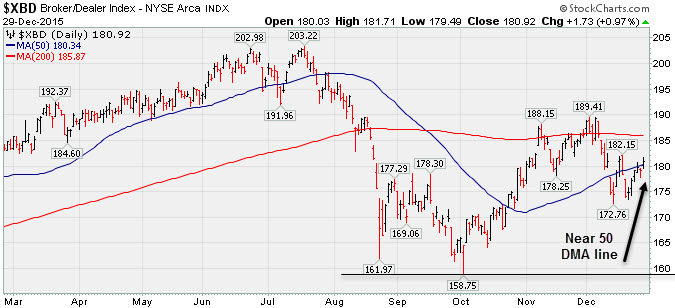
PICTURED: The Broker/Dealer Index ($XBD +0.97%) is consolidating near its 50-day moving average (DMA) line. It has been sputtering recently, yet staying well above prior lows defining important near-term support.
| Oil Services |
$OSX |
159.15 |
+0.81 |
+0.51% |
-24.53% |
| Integrated Oil |
$XOI |
1,088.57 |
+6.46 |
+0.60% |
-19.25% |
| Semiconductor |
$SOX |
679.78 |
+8.03 |
+1.20% |
-1.03% |
| Networking |
$NWX |
382.60 |
+4.70 |
+1.24% |
+6.89% |
| Broker/Dealer |
$XBD |
180.92 |
+1.73 |
+0.97% |
-2.01% |
| Retail |
$RLX |
1,308.79 |
+21.38 |
+1.66% |
+26.73% |
| Gold & Silver |
$XAU |
46.15 |
+0.37 |
+0.81% |
-32.90% |
| Bank |
$BKX |
74.53 |
+0.75 |
+1.02% |
+0.36% |
| Biotech |
$BTK |
3,868.26 |
+60.54 |
+1.59% |
+12.48% |
|
|
|
 |
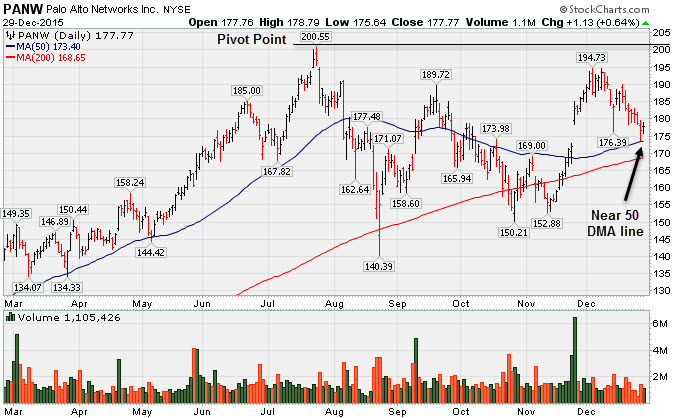
Halted Slide at 50-Day Moving Average
Kenneth J. Gruneisen - Passed the CAN SLIM® Master's Exam
Palo Alto Networks (PANW +$+1.13 or +0.64% to $177.77) encountered distributional pressure with a streak of consecutive losses testing its 50-day moving average (DMA) line this week. Since featured in the 12/14/15 mid-day report it has not produced the volume-driven gains for new highs needed to trigger a new technical buy signal. It was last shown in this FSU section with annotated graphs on 12/14/15 under the headline, "Perched Within Striking Distance of Highs Again". It was highlighted in yellow with new pivot point cited based on its 7/24/15 high plus 10 cents in the 12/14/15 mid-day report (read here). Members were previously reminded - "Disciplined investors will note that 3 out of 4 stocks typically move in the same direction as the major averages. For now, PANW might be added back to investors' watch lists until strength returns to the broader market, and then a new technical breakout might justify action." The Computer Software - Security firm reported strong sales revenues +133% and earnings +55% for the Oct '15 quarter, and fundamentals remain strong. The past 6 consecutive comparisons came with strong sales revenues increases and earnings above the +25% minimum guideline satisfying the C criteria. Sequentially, it has shown mostly encouraging acceleration with earnings increases of +57%, +88%, +90%, +109%, +155% and +133% in the Jul, Oct '14, Jan, Apr, Jul, and Oct '15 quarters, respectively, versus the year ago periods. It has an Earnings Per Share (EPS) Rating of 99, the highest possible rating. It has a strong annual earnings (A criteria) history.
PANW traded up as much as +164% since first highlighted at $75.95 in yellow back on May 29, 2014 when shown breaking out of a "double bottom" base pattern. The number of top-rated funds owning its shares rose from 246 in Jun '13 to 925 in Sep '15, a very reassuring sign concerning the I criteria. Its small supply (S criteria) of 85.9 million shares outstanding is another favorable characteristic. |
|
|
Color Codes Explained :
Y - Better candidates highlighted by our
staff of experts.
G - Previously featured
in past reports as yellow but may no longer be buyable under the
guidelines.
***Last / Change / Volume data in this table is the closing quote data***
Symbol/Exchange
Company Name
Industry Group |
PRICE |
CHANGE
(%Change) |
Day High |
Volume
(% DAV)
(% 50 day avg vol) |
52 Wk Hi
% From Hi |
Featured
Date |
Price
Featured |
Pivot Featured |
|
Max Buy |
SFNC
-
NASDAQ
Simmons First Natl Cp A
BANKING - Regional - Southeast Banks
|
$52.89
|
+0.35
0.67% |
$53.40
|
85,375
46.15% of 50 DAV
50 DAV is 185,000
|
$58.75
-9.97%
|
10/22/2015
|
$50.13
|
PP = $48.98
|
|
MB = $51.43
|
Most Recent Note - 12/28/2015 6:27:02 PM
G - Still sputtering below its 50 DMA line ($53.57). The longer it lingers below that important short-term average the worse its outlook gets.
>>> FEATURED STOCK ARTICLE : Slide Below Prior Lows and 50-Day Average Raised More Serious Concerns - 12/22/2015 |
View all notes |
Set NEW NOTE alert |
Company Profile |
SEC
News |
Chart |
Request a new note
C
A
S
I |
MANH
-
NASDAQ
Manhattan Associates Inc
COMPUTER SOFTWARE and SERVICES - Technical and System Software
|
$69.43
|
+0.48
0.70% |
$70.06
|
407,586
77.78% of 50 DAV
50 DAV is 524,000
|
$77.75
-10.70%
|
10/21/2015
|
$69.18
|
PP = $69.91
|
|
MB = $73.41
|
 Most Recent Note - 12/29/2015 10:59:51 PM
G - Still below its recent low ($69.85 on 12/11/15) after losses triggering a technical sell signal. A rebound above the 50 DMA line is needed for its outlook to improve.
>>> FEATURED STOCK ARTICLE : Falters and Slumps Into Prior Base Raising Concerns - 12/23/2015 |
View all notes |
Set NEW NOTE alert |
Company Profile |
SEC
News |
Chart |
Request a new note
C
A
S
I |
HAWK
-
NASDAQ
Blackhawk Network Inc
DIVERSIFIED SERVICES - Business/Management Services
|
$45.58
|
+0.43
0.95% |
$45.84
|
194,319
43.96% of 50 DAV
50 DAV is 442,000
|
$48.40
-5.83%
|
11/25/2015
|
$47.63
|
PP = $47.07
|
|
MB = $49.42
|
Most Recent Note - 12/28/2015 6:22:08 PM
G - Sputtering near its 50 DMA line which acted as support after damaging losses on volume triggered a technical sell signal. Disciplined investors will note that a proper buy signal was not triggered since first featured in yellow in the 11/25/15 mid-day report.
>>> FEATURED STOCK ARTICLE : Hovering Near Highs But Not Showing Fresh Signs of Accumulation - 12/15/2015 |
View all notes |
Set NEW NOTE alert |
Company Profile |
SEC
News |
Chart |
Request a new note
C
A
S
I |
STMP
-
NASDAQ
Stamps.com Inc
INTERNET - Internet Software and Services
|
$113.35
|
+1.43
1.28% |
$114.26
|
283,557
84.39% of 50 DAV
50 DAV is 336,000
|
$113.61
-0.23%
|
11/6/2015
|
$100.75
|
PP = $88.97
|
|
MB = $93.42
|
Most Recent Note - 12/28/2015 6:30:37 PM
G - Perched near its 52-week high after volume-driven gains. Its 50 DMA line ($94.39) and recent lows define near-term support to watch. Disciplined investors avoid chasing extended stocks. See the latest FSU analysis for more details and a new annotated graph.
>>> FEATURED STOCK ARTICLE : Consolidation Was Brief Following Prior Breakaway Gap - 12/28/2015 |
View all notes |
Set NEW NOTE alert |
Company Profile |
SEC
News |
Chart |
Request a new note
C
A
S
I |
ULTI
-
NASDAQ
Ultimate Software Group
INTERNET - Internet Software and Services
|
$196.44
|
+2.01
1.03% |
$197.26
|
135,102
51.57% of 50 DAV
50 DAV is 262,000
|
$216.27
-9.17%
|
10/28/2015
|
$204.38
|
PP = $195.28
|
|
MB = $205.04
|
Most Recent Note - 12/28/2015 6:28:46 PM
G - Still sputtering below its 50 DMA line, and a rebound above it is needed for its outlook to improve. Subsequent deterioration below recent lows ($188) would raise greater concerns.
>>> FEATURED STOCK ARTICLE : Slumped Back Below 50-Day Moving Average Line Raising Concerns - 12/21/2015 |
View all notes |
Set NEW NOTE alert |
Company Profile |
SEC
News |
Chart |
Request a new note
C
A
S
I |
Symbol/Exchange
Company Name
Industry Group |
PRICE |
CHANGE
(%Change) |
Day High |
Volume
(% DAV)
(% 50 day avg vol) |
52 Wk Hi
% From Hi |
Featured
Date |
Price
Featured |
Pivot Featured |
|
Max Buy |
LXFT
-
NYSE
Luxoft Holding Inc Cl A
Comp Sftwr-Spec Enterprs
|
$78.18
|
+0.80
1.03% |
$78.36
|
102,688
43.70% of 50 DAV
50 DAV is 235,000
|
$80.64
-3.05%
|
10/22/2015
|
$66.65
|
PP = $68.95
|
|
MB = $72.40
|
Most Recent Note - 12/24/2015 10:49:15 AM
G - Volume totals have still been cooling while consolidating near all-time highs. Disciplined investors avoid chasing extended stocks. Its 50 DMA line ($73) and prior lows define near-term support to watch on pullbacks.
>>> FEATURED STOCK ARTICLE : Consolidating Well Above 50-Day Moving Average Line - 12/18/2015 |
View all notes |
Set NEW NOTE alert |
Company Profile |
SEC
News |
Chart |
Request a new note
C
A
S
I |
PANW
-
NYSE
Palo Alto Networks
Computer Sftwr-Security
|
$177.77
|
+1.13
0.64% |
$178.79
|
1,105,426
67.98% of 50 DAV
50 DAV is 1,626,000
|
$200.55
-11.36%
|
12/14/2015
|
$179.20
|
PP = $200.65
|
|
MB = $210.68
|
Most Recent Note - 12/29/2015 10:53:28 PM
Y - Halted its slide at its 50 DMA line today after a streak of losses. Since featured in the 12/14/15 mid-day report it has not produced the volume-driven gains for new highs needed to trigger a new technical buy signal. See the latest FSU analysis for more details and a new annotated graph.
>>> FEATURED STOCK ARTICLE : FSDU - 12/29/2015 |
View all notes |
Set NEW NOTE alert |
Company Profile |
SEC
News |
Chart |
Request a new note
C
A
S
I |
VBTX
-
NASDAQ
Veritex Holdings Inc
BANKING - Regional - Southwest Banks
|
$16.11
|
+0.08
0.50% |
$16.52
|
13,985
73.61% of 50 DAV
50 DAV is 19,000
|
$17.95
-10.25%
|
11/4/2015
|
$17.00
|
PP = $18.05
|
|
MB = $18.95
|
Most Recent Note - 12/28/2015 12:42:26 PM
G - Recent lows and its 200 DMA line define important near-term support in the $15.50 area where subsequent violations would raise greater concerns. The 50 DMA line acted as resistance recently, and a rebound above that important short-term average is needed for its outlook to improve. See the latest FSU analysis for more details and an annotated graph.
>>> FEATURED STOCK ARTICLE : 50-Day Moving Average Acted as Resistance After 200 DMA Test - 12/24/2015 |
View all notes |
Set NEW NOTE alert |
Company Profile |
SEC
News |
Chart |
Request a new note
C
A
S
I |
NHTC
-
NASDAQ
Natural Health Trends
Cosmetics/Personal Care
|
$40.24
|
+0.40
1.00% |
$41.31
|
386,114
90.85% of 50 DAV
50 DAV is 425,000
|
$55.45
-27.43%
|
10/23/2015
|
$42.12
|
PP = $44.85
|
|
MB = $47.09
|
Most Recent Note - 12/29/2015 10:56:46 PM
Failed to rebound after a damaging loss on the prior session raised more serious concerns. Faces resistance due to overhead supply up through the $55 level. It will be dropped from the Featured Stocks list tonight.
>>> FEATURED STOCK ARTICLE : Prior Resistance and 50-Day Moving Average Line Acting as Support - 12/16/2015 |
View all notes |
Set NEW NOTE alert |
Company Profile |
SEC
News |
Chart |
Request a new note
C
A
S
I |
|
|
|
THESE ARE NOT BUY RECOMMENDATIONS!
Comments contained in the body of this report are technical
opinions only. The material herein has been obtained
from sources believed to be reliable and accurate, however,
its accuracy and completeness cannot be guaranteed.
This site is not an investment advisor, hence it does
not endorse or recommend any securities or other investments.
Any recommendation contained in this report may not
be suitable for all investors and it is not to be deemed
an offer or solicitation on our part with respect to
the purchase or sale of any securities. All trademarks,
service marks and trade names appearing in this report
are the property of their respective owners, and are
likewise used for identification purposes only.
This report is a service available
only to active Paid Premium Members.
You may opt-out of receiving report notifications
at any time. Questions or comments may be submitted
by writing to Premium Membership Services 665 S.E. 10 Street, Suite 201 Deerfield Beach, FL 33441-5634 or by calling 1-800-965-8307
or 954-785-1121.
|
|
|