You are not logged in.
This means you
CAN ONLY VIEW reports that were published prior to Wednesday, March 26, 2025.
You
MUST UPGRADE YOUR MEMBERSHIP if you want to see any current reports.
AFTER MARKET UPDATE - MONDAY, MAY 1ST, 2017
Previous After Market Report Next After Market Report >>>
|
|
|
|
DOW |
-27.05 |
20,913.46 |
-0.13% |
|
Volume |
874,210,860 |
-34% |
|
Volume |
1,572,804,880 |
-13% |
|
NASDAQ |
+43.99 |
6,091.60 |
+0.73% |
|
Advancers |
1,647 |
57% |
|
Advancers |
1,645 |
58% |
|
S&P 500 |
+4.13 |
2,388.33 |
+0.17% |
|
Decliners |
1,256 |
43% |
|
Decliners |
1,200 |
42% |
|
Russell 2000 |
+6.93 |
1,407.36 |
+0.50% |
|
52 Wk Highs |
176 |
|
|
52 Wk Highs |
199 |
|
|
S&P 600 |
+3.66 |
855.02 |
+0.43% |
|
52 Wk Lows |
39 |
|
|
52 Wk Lows |
54 |
|
|
 |
Nasdaq Index Outpaces Peers
Kenneth J. Gruneisen - Passed the CAN SLIM® Master's Exam
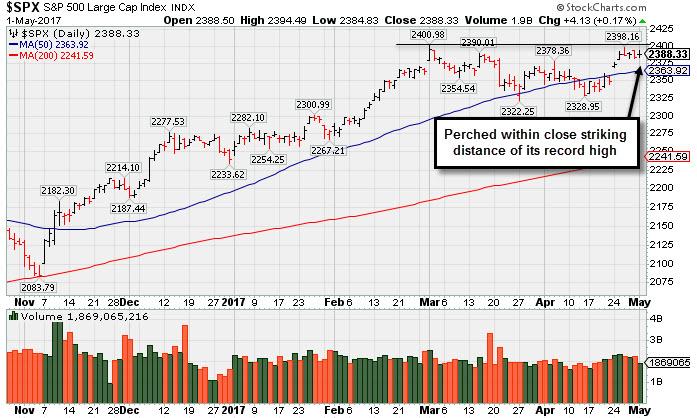
Stocks finished mixed on Monday. The Dow was off 27 points to 20913. The S&P 500 added 4 points to 2388 and the Nasdaq Composite gained 44 points to 6091. The volume totals reported were lighter than the prior session totals on the NYSE and lighter on the Nasdaq exchange. Advancer led decliners by 4-3 on the NYSE and on the Nasdaq exchange. There were 61 high-ranked companies from the Leaders List that made new 52-week highs and were listed on the BreakOuts Page, versus the total of 56 on the prior session. New 52-week highs totals expanded and solidly outnumbered new 52-week lows on the NYSE and on the Nasdaq exchange. PICTURED: The S&P 500 Index is perched within close striking distance of its record high.
The major averages' (M criteria) are in a confirmed uptrend, and there has been a reassuring expansion in leadership (number of high-ranked stocks hitting new highs). New buying efforts should be made only in stocks matching all of the fundamental and technical criteria of the fact-based investment system. The Featured Stocks Page lists noteworthy high-ranked leaders.
The major averages fluctuated amid a busy day of economic and political headlines. Lawmakers reached an accord Sunday to avoid a government shutdown, extending the debt ceiling through the end of September. On the data front, the PCE deflator, which is the Fed’s preferred proxy for inflation, slipped 0.2% sequentially in March. ISM’s gauge of U.S. manufacturing activity for April came in at 54.8, below the expected 56.5 expansion, while Markit’s reading on manufacturing matched projections at 52.8. Separate releases on personal income and spending came in below consensus, while construction spending unexpectedly dipped into negative territory in March.
Five of 11 sectors in the S&P 500 ended the session in the green. Technology stocks paced the gains with Twitter (TWTR +6.43%) rising amid news that CEO Jack Dorsey purchased additional shares of the company. Financials finished higher as well, despite President Trump saying in an interview that he is considering a break up of giant Wall Street banks. Telecom stocks lagged with AT&T (T -1.1%) edging lower.
Treasuries declined with the benchmark 10-year note sliding 11/32 to yield 2.32%. In commodities, NYMEX WTI crude is lost 1.1% to $48.76/barrel. |
 Kenneth J. Gruneisen started out as a licensed stockbroker in August 1987, a couple of months prior to the historic stock market crash that took the Dow Jones Industrial Average down -22.6% in a single day. He has published daily fact-based fundamental and technical analysis on high-ranked stocks online for two decades. Through FACTBASEDINVESTING.COM, Kenneth provides educational articles, news, market commentary, and other information regarding proven investment systems that work in good times and bad.
Comments contained in the body of this report are technical opinions only and are not necessarily those of Gruneisen Growth Corp. The material herein has been obtained from sources believed to be reliable and accurate, however, its accuracy and completeness cannot be guaranteed. Our firm, employees, and customers may effect transactions, including transactions contrary to any recommendation herein, or have positions in the securities mentioned herein or options with respect thereto. Any recommendation contained in this report may not be suitable for all investors and it is not to be deemed an offer or solicitation on our part with respect to the purchase or sale of any securities. |
|
 |
Financial, Retail, and Tech Groups Rose
Kenneth J. Gruneisen - Passed the CAN SLIM® Master's Exam
The Bank Index ($BKX +0.93%) and the Broker/Dealer Index ($XBD +0.37%) posted gains along with the Retail Index ($RLX +0.46%) on Monday. The tech sector was led higher by the Semiconductor Index ($SOX +0.98%) and the Biotechnology Index ($BTK +0.85%) while the Networking Index ($NWX +0.05%) finished flat. Commodity-linked groups had a negative bias as the Oil Services Index ($OSX -1.72%), Integrated Oil Index ($XOI -0.40%), and the Gold & Silver index ($XAU -2.80%) fell. Charts courtesy www.stockcharts.com
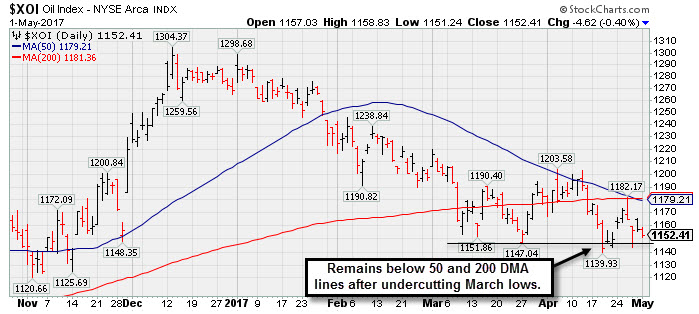 PICTURED: The Integrated Oil Index ($XOI -0.40%) remains below its 50-day and 200-day moving average (DMA) lines after recently undercutting the March lows.
| Oil Services |
$OSX |
150.78 |
-2.64 |
-1.72% |
-17.96% |
| Integrated Oil |
$XOI |
1,152.41 |
-4.62 |
-0.40% |
-9.12% |
| Semiconductor |
$SOX |
1,015.43 |
+9.90 |
+0.98% |
+12.02% |
| Networking |
$NWX |
452.52 |
+0.21 |
+0.05% |
+1.44% |
| Broker/Dealer |
$XBD |
216.85 |
+0.79 |
+0.37% |
+5.64% |
| Retail |
$RLX |
1,507.42 |
+6.90 |
+0.46% |
+12.24% |
| Gold & Silver |
$XAU |
80.77 |
-2.33 |
-2.80% |
+2.42% |
| Bank |
$BKX |
92.08 |
+0.85 |
+0.93% |
+0.32% |
| Biotech |
$BTK |
3,667.35 |
+31.07 |
+0.85% |
+19.26% |
|
|
|
 |
Wedging Higher With Recent Gains Lacking Great Volume
Kenneth J. Gruneisen - Passed the CAN SLIM® Master's Exam
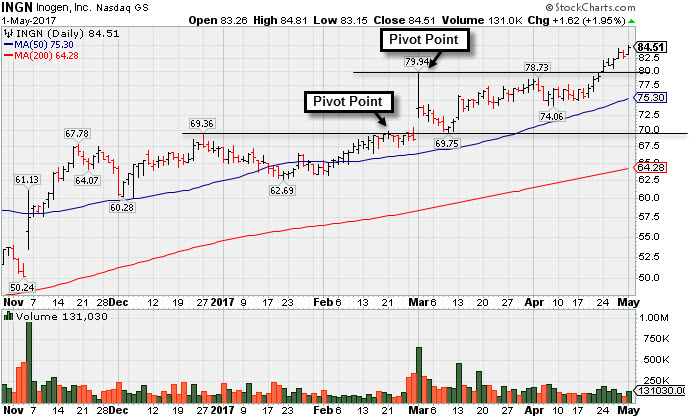
Inogen Inc (INGN +$1.62 or +1.95%to $84.51) hit a new all-time high with today's gain on below average volume, edging further above its "max buy" level. Disciplined investors avoid chasing extended stocks. No resistance remains due to overhead supply. Recent gains above the pivot point lacked the minimum +40% above average volume needed to trigger a proper new (or add-on) technical buy signal. Its 50-day moving average (DMA) line ($75.30) defines near-term support to watch on pullbacks.
INGN was last shown in this FSU section on 3/31/17 with an annotated graph under the headline, "Best Ever Close For High-Ranked Medical Product Maker". It was highlighted in yellow with pivot point cited based on its 9/29/16 high plus 10 cents in the earlier mid-day report (read here).
It reported Mar '17 quarterly earnings +45% on +39% sales revenues. Three of the past four quarterly earnings were above the +25% minimum guideline (C criteria). Its annual earnings (A criteria) history has been very strong since the high ranked Internet Content firm completed a new Public Offering on 9/03/14.
The number of top-rated funds owning its shares rose from 318 in Jun '16 to 334 in Mar '17, a reassuring sign concerning the I criteria. The current Up/Down Volume Ratio of 1.5 is an unbiased indication its shares have been under accumulation over the past 50 days. It has a fairly small supply of only 20.6 million shares (S criteria) outstanding, which can contribute to greater price volatility in the event of institutional buying or selling.
|
|
|
Color Codes Explained :
Y - Better candidates highlighted by our
staff of experts.
G - Previously featured
in past reports as yellow but may no longer be buyable under the
guidelines.
***Last / Change / Volume data in this table is the closing quote data***
Symbol/Exchange
Company Name
Industry Group |
PRICE |
CHANGE
(%Change) |
Day High |
Volume
(% DAV)
(% 50 day avg vol) |
52 Wk Hi
% From Hi |
Featured
Date |
Price
Featured |
Pivot Featured |
|
Max Buy |
SBCF
-
NASDAQ
Seacoast Banking Corp Fl
BANKING - Regional - Mid-Atlantic Banks
|
$24.20
|
+0.00
0.00% |
$24.64
|
350,632
76.72% of 50 DAV
50 DAV is 457,000
|
$25.88
-6.49%
|
4/24/2017
|
$25.33
|
PP = $24.38
|
|
MB = $25.60
|
Most Recent Note - 4/27/2017 9:41:25 PM
Y - Pulled back today with light volume, closing near the new pivot point cited based on its 3/31/17 high after a cup with handle base. Recent gains above the pivot point lacked the above average volume needed to trigger a proper new (or add-on) technical buy signal. The 50 DMA line ($23.79) and recent low ($21.89 on 3/22/17) define support where violations would raise more serious concerns and trigger worrisome technical sell signals.
>>> FEATURED STOCK ARTICLE : Pullback Following Recent Gains With Unimpressive Volume - 4/27/2017 |
View all notes |
Set NEW NOTE alert |
Company Profile |
SEC
News |
Chart |
Request a new note
C
A
S
I |
CSFL
-
NASDAQ
Centerstate Banks Inc
Banks-Southeast
|
$25.39
|
+0.16
0.63% |
$25.60
|
190,258
60.98% of 50 DAV
50 DAV is 312,000
|
$26.94
-5.74%
|
3/13/2017
|
$25.54
|
PP = $26.40
|
|
MB = $27.72
|
Most Recent Note - 4/27/2017 9:53:26 PM
Y - Reported earnings +10% on +13% sales revenues for the Mar '17 quarter, below the +25% minimum earnings guideline. Pulled back toward its 50 DMA line ($25.26). Damaging losses below its recent low ($23.64 on 4/17/17) would raise more serious concerns.
>>> FEATURED STOCK ARTICLE : Positive Reversal After Intra-day Low Undercut Prior Lows - 4/17/2017 |
View all notes |
Set NEW NOTE alert |
Company Profile |
SEC
News |
Chart |
Request a new note
C
A
S
I |
NSP
-
NYSE
Insperity Inc
Comml Svcs-Outsourcing
|
$86.60
|
-4.75
-5.20% |
$89.60
|
493,857
352.76% of 50 DAV
50 DAV is 140,000
|
$93.65
-7.53%
|
4/21/2017
|
$88.65
|
PP = $90.65
|
|
MB = $95.18
|
 Most Recent Note - 5/1/2017 1:11:45 PM
G - Reported earnings +13% on +10% sales revenues for the Mar '17 quarter, below the +25% minimum guideline (C criteria), raising fundamental concerns. Technically, it gapped down today and violated its 50 DMA line, then it found prompt support and rebounded near that important short-term average. The recent gains above the pivot point lacked the minimum +40% above average volume needed to trigger a proper new (or add-on) technical buy signal.
>>> FEATURED STOCK ARTICLE : New Base Formed Above 50-Day Moving Average Line - 4/21/2017 |
View all notes |
Set NEW NOTE alert |
Company Profile |
SEC
News |
Chart |
Request a new note
C
A
S
I |
HTHT
-
NASDAQ
China Lodging Group Ads
LEISURE - Lodging
|
$70.47
|
-0.51
-0.72% |
$72.26
|
117,092
71.40% of 50 DAV
50 DAV is 164,000
|
$72.85
-3.27%
|
9/29/2016
|
$46.12
|
PP = $47.82
|
|
MB = $50.21
|
Most Recent Note - 4/28/2017 8:33:14 PM
G - Hit yet another new all-time high with today's 5th consecutive gain with lighter than average volume. Found prompt support near its 50 DMA line during its ongoing advance. Recent low ($57.89 on 4/11/17) defines near-term support to watch on pullbacks. Repeatedly noted with caution - "The 2 latest quarterly comparisons (Sep and Dec '16) were below the +25% minimum earnings guideline (C criteria), and its waning sales revenues growth rate was also noted recently as a fundamental concern.
>>> FEATURED STOCK ARTICLE : Support Shown Promptly After 50-Day Moving Average Violation - 4/19/2017 |
View all notes |
Set NEW NOTE alert |
Company Profile |
SEC
News |
Chart |
Request a new note
C
A
S
I |
SIRI
-
NASDAQ
Sirius X M Holdings Inc
MEDIA - Broadcasting - Radio
|
$4.96
|
+0.01
0.20% |
$4.98
|
38,089,146
138.19% of 50 DAV
50 DAV is 27,563,500
|
$5.53
-10.31%
|
3/13/2017
|
$5.48
|
PP = $5.32
|
|
MB = $5.59
|
Most Recent Note - 5/1/2017 4:45:22 PM
G - A prompt rebound above its 50 DMA line ($5.13) is needed for its outlook to improve. Halted its slide with a small gain today backed by above average volume. Volume-driven losses last week triggered a technical sell signal. It reported earnings +33% on +8% sales revenues for the Mar '17 quarter, a 3rd consecutive quarterly comparison above the +25% minimum guideline (C criteria).
>>> FEATURED STOCK ARTICLE : Consolidating Above Near-Term Support Level - 4/13/2017 |
View all notes |
Set NEW NOTE alert |
Company Profile |
SEC
News |
Chart |
Request a new note
C
A
S
I |
Symbol/Exchange
Company Name
Industry Group |
PRICE |
CHANGE
(%Change) |
Day High |
Volume
(% DAV)
(% 50 day avg vol) |
52 Wk Hi
% From Hi |
Featured
Date |
Price
Featured |
Pivot Featured |
|
Max Buy |
BEAT
-
NASDAQ
BioTelemetry Inc
Medical-Services
|
$33.75
|
+0.85
2.58% |
$33.95
|
538,922
117.67% of 50 DAV
50 DAV is 458,000
|
$33.45
0.90%
|
2/14/2017
|
$25.10
|
PP = $24.55
|
|
MB = $25.78
|
Most Recent Note - 5/1/2017 4:47:57 PM
G - Hit another new all-time high today with its gain backed by volume slightly above average. It is extended from any sound base. Its 50 DMA line ($28.26) defines the nearest support level.
>>> FEATURED STOCK ARTICLE : Perched Near High, Extended From Prior Base - 4/3/2017 |
View all notes |
Set NEW NOTE alert |
Company Profile |
SEC
News |
Chart |
Request a new note
C
A
S
I |
ULTA
-
NASDAQ
Ulta Salon Cosm & Frag
SPECIALTY RETAIL - Specialty Retail, Other
|
$283.22
|
+1.78
0.63% |
$283.84
|
493,894
75.76% of 50 DAV
50 DAV is 651,900
|
$289.27
-2.09%
|
3/6/2017
|
$274.96
|
PP = $278.73
|
|
MB = $292.67
|
Most Recent Note - 5/1/2017 4:21:47 PM
G - Its current Relative Strength rank is 71, below the 80+ guideline for buy candidates. Tested prior highs in the $278 area defining important support along with its 50 DMA line ($280.94). More damaging losses would raise concerns and trigger technical sell signals.
>>> FEATURED STOCK ARTICLE : Volume Totals Cooling Following Technical Breakout - 4/7/2017 |
View all notes |
Set NEW NOTE alert |
Company Profile |
SEC
News |
Chart |
Request a new note
C
A
S
I |
ESNT
-
NYSE
Essent Group Ltd
Finance-MrtgandRel Svc
|
$36.79
|
-0.22
-0.59% |
$37.47
|
714,399
103.69% of 50 DAV
50 DAV is 689,000
|
$39.50
-6.86%
|
4/4/2017
|
$36.38
|
PP = $36.81
|
|
MB = $38.65
|
Most Recent Note - 4/27/2017 9:46:49 PM
Y - Color code is changed to yellow after again pulling back below its "max buy" level. Its 50 DMA line ($36.12) and recent lows define important near-term support.
>>> FEATURED STOCK ARTICLE : Quiet Volume Behind Gain for New High Close - 4/10/2017 |
View all notes |
Set NEW NOTE alert |
Company Profile |
SEC
News |
Chart |
Request a new note
C
A
S
I |
MTSI
-
NASDAQ
Macom Tech Solution Hldg
Elec-Semiconductor Mfg
|
$48.89
|
+0.01
0.02% |
$49.07
|
605,143
113.96% of 50 DAV
50 DAV is 531,000
|
$55.18
-11.39%
|
4/25/2017
|
$54.57
|
PP = $53.90
|
|
MB = $56.60
|
Most Recent Note - 4/27/2017 9:55:13 PM
G - Pulled back for a 3rd consecutive loss with above average volume. Gapped down on the prior session and undercut its 50 DMA line then found prompt support. Its color code was changed to green. Had a "negative reversal" after highlighted in yellow in the 4/25/17 mid-day report with a pivot point cited based on its 12/07/16 high plus 10 cents. No resistance remains. Reported +38% earnings on +39% sales revenues for the Mar '17 quarter after the close. Volume and volatility often increase near earnings news. See the latest FSU analysis for more details and an annotated graph.
>>> FEATURED STOCK ARTICLE : Strong Earnings Report While Perched at All-Time High - 4/25/2017 |
View all notes |
Set NEW NOTE alert |
Company Profile |
SEC
News |
Chart |
Request a new note
C
A
S
I |
VEEV
-
NYSE
Veeva Systems Inc Cl A
Computer Sftwr-Medical
|
$54.24
|
+0.62
1.16% |
$54.50
|
814,426
61.93% of 50 DAV
50 DAV is 1,315,000
|
$53.88
0.67%
|
3/16/2017
|
$49.00
|
PP = $48.05
|
|
MB = $50.45
|
Most Recent Note - 4/26/2017 5:09:25 PM
G - Small gain backed by light volume today for a best-ever close. Its 50 DMA line defines support along with prior highs in the $47-48 area.
>>> FEATURED STOCK ARTICLE : Hovering Near High, Stubbornly Holding its Ground - 4/18/2017 |
View all notes |
Set NEW NOTE alert |
Company Profile |
SEC
News |
Chart |
Request a new note
C
A
S
I |
Symbol/Exchange
Company Name
Industry Group |
PRICE |
CHANGE
(%Change) |
Day High |
Volume
(% DAV)
(% 50 day avg vol) |
52 Wk Hi
% From Hi |
Featured
Date |
Price
Featured |
Pivot Featured |
|
Max Buy |
ANET
-
NYSE
Arista Networks Inc
TELECOMMUNICATIONS - Communication Equipment
|
$141.10
|
+1.46
1.05% |
$141.92
|
705,701
80.01% of 50 DAV
50 DAV is 882,000
|
$140.32
0.56%
|
4/17/2017
|
$132.75
|
PP = $135.27
|
|
MB = $142.03
|
Most Recent Note - 5/1/2017 8:19:20 PM
Y - Hit yet another new all-time high with a gain on light volume. Gains with at least +40% above average volume while rising above the new pivot point cited would trigger a new (or add-on) technical buy signal.
>>> FEATURED STOCK ARTICLE : Extended From Any Sound Base After a Considerable Rally - 4/5/2017 |
View all notes |
Set NEW NOTE alert |
Company Profile |
SEC
News |
Chart |
Request a new note
C
A
S
I |
GRUB
-
NYSE
Grubhub Inc
COMPUTER SOFTWARE and SERVICES - Technical and System Software
|
$42.89
|
-0.09
-0.21% |
$43.39
|
3,110,926
134.09% of 50 DAV
50 DAV is 2,320,000
|
$45.09
-4.88%
|
4/28/2017
|
$44.22
|
PP = $44.68
|
|
MB = $46.91
|
Most Recent Note - 4/28/2017 8:31:32 PM
Y - Touched a new 52-week high but finished near the session low after highlighted in yellow with pivot point cited based on its 9/29/16 high plus 10 cents in the earlier mid-day report. A strong close above the pivot point may clinch a more convincing technical buy signal. A volume-driven gap up gain on the prior session clear recent highs. Reported Mar '17 quarterly earnings +45% on +39% sales revenues. Three of the past four quarterly earnings were above the +25% minimum guideline (C criteria). Increasing ownership by top-rated funds. See the latest FSU analysis for more details and a new annotated graph.
>>> FEATURED STOCK ARTICLE : Hit New 52-Week High But Ended Near Session Low - 4/28/2017 |
View all notes |
Set NEW NOTE alert |
Company Profile |
SEC
News |
Chart |
Request a new note
C
A
S
I |
IBP
-
NYSE
Installed Building Prod
DIVERSIFIED SERVICES - Business/Management Services
|
$53.90
|
+0.55
1.03% |
$54.25
|
78,829
50.21% of 50 DAV
50 DAV is 157,000
|
$55.45
-2.80%
|
4/17/2017
|
$51.75
|
PP = $53.10
|
|
MB = $55.76
|
Most Recent Note - 5/1/2017 8:15:44 PM
Y - Hovered near its all-time high today with a small gain backed by light volume. Wedged higher with gains lacking great volume conviction after an advanced "3-weeks tight" base was noted. Subsequent volume-driven gains above the new pivot point cited may clinch a new (or add-on) technical buy signal. Its 50 DMA line ($50.29) and recent low define important near-term support to watch.
>>> FEATURED STOCK ARTICLE : Hovering Near All-Time High Following Volume-Driven Gains - 4/4/2017 |
View all notes |
Set NEW NOTE alert |
Company Profile |
SEC
News |
Chart |
Request a new note
C
A
S
I |
NCOM
-
NASDAQ
National Commerce Corp
BANKING - Regional - Southeast Banks
|
$38.85
|
+0.15
0.39% |
$39.35
|
27,172
84.91% of 50 DAV
50 DAV is 32,000
|
$40.00
-2.88%
|
4/25/2017
|
$38.95
|
PP = $40.09
|
|
MB = $42.09
|
Most Recent Note - 5/1/2017 8:17:25 PM
Y - Still perched near its 52-week high. A gain above the pivot point backed by a minimum of +40% above average volume may trigger a technical buy signal.
>>> FEATURED STOCK ARTICLE : Challenging 52-Week High With Volume-Driven Gains - 4/26/2017 |
View all notes |
Set NEW NOTE alert |
Company Profile |
SEC
News |
Chart |
Request a new note
C
A
S
I |
INGN
-
NASDAQ
Inogen Inc
HEALTH SERVICES - Medical Instruments and Supplies
|
$84.51
|
+1.62
1.95% |
$84.81
|
131,030
73.61% of 50 DAV
50 DAV is 178,000
|
$84.25
0.31%
|
4/17/2017
|
$76.77
|
PP = $80.04
|
|
MB = $84.04
|
Most Recent Note - 5/1/2017 4:20:25 PM
G - Color code is changed to green after hitting a new all-time high and finishing the session above its "max buy" level with a gain on below average volume. Recent gains above the pivot point lacked the minimum +40% above average volume needed to trigger a proper new (or add-on) technical buy signal. Its 50 DMA line ($75.30) defines near-term support to watch.
>>> FEATURED STOCK ARTICLE : Wedging Higher With Recent Gains Lacking Great Volume - 5/1/2017 |
View all notes |
Set NEW NOTE alert |
Company Profile |
SEC
News |
Chart |
Request a new note
C
A
S
I |
Symbol/Exchange
Company Name
Industry Group |
PRICE |
CHANGE
(%Change) |
Day High |
Volume
(% DAV)
(% 50 day avg vol) |
52 Wk Hi
% From Hi |
Featured
Date |
Price
Featured |
Pivot Featured |
|
Max Buy |
PLAY
-
NASDAQ
Dave & Busters Ent Inc
Retail-Restaurants
|
$64.26
|
+0.25
0.39% |
$64.34
|
328,127
40.96% of 50 DAV
50 DAV is 801,000
|
$64.50
-0.37%
|
2/23/2017
|
$55.41
|
PP = $58.35
|
|
MB = $61.27
|
Most Recent Note - 4/26/2017 5:06:38 PM
G - Posted a small gain with light volume today for a new high close. Its 50 DMA line ($59.45) defines near-term support to watch on pullbacks. Latest quarter was below the +25% minimum guideline (C criteria), raising fundamental concerns.
>>> FEATURED STOCK ARTICLE : Retreated From All-Time High Following Earnings Report - 3/29/2017 |
View all notes |
Set NEW NOTE alert |
Company Profile |
SEC
News |
Chart |
Request a new note
C
A
S
I |
OLLI
-
NASDAQ
Ollies Bargain Outlet
Retail-DiscountandVariety
|
$38.00
|
-0.30
-0.78% |
$38.35
|
570,471
96.53% of 50 DAV
50 DAV is 591,000
|
$38.88
-2.25%
|
3/27/2017
|
$32.80
|
PP = $33.55
|
|
MB = $35.23
|
Most Recent Note - 4/27/2017 9:59:46 PM
G - Paused today after a streak of 8 consecutive gains, getting very extended from any sound base. Bullish action has continued since reporting earnings +22% on +16% sales revenues for the Jan '17 quarter, below the +25% minimum earnings guideline (C criteria). Its 50 DMA line and prior highs in the $33 area define near-term support.
>>> FEATURED STOCK ARTICLE : Winning Streak Continues for Discount Retailer - 4/24/2017 |
View all notes |
Set NEW NOTE alert |
Company Profile |
SEC
News |
Chart |
Request a new note
C
A
S
I |
MOMO
-
NASDAQ
Momo Inc Ads Cl A
INTERNET - Content
|
$39.43
|
+1.45
3.82% |
$39.95
|
4,462,592
84.63% of 50 DAV
50 DAV is 5,273,000
|
$39.25
0.46%
|
3/7/2017
|
$29.71
|
PP = $27.83
|
|
MB = $29.22
|
Most Recent Note - 5/1/2017 4:49:54 PM
G - Hit a new all-time high with today's gain on average volume. Its 50 DMA line ($33.31) defines important support to watch.
>>> FEATURED STOCK ARTICLE : Extended From Prior Base and Perched Near High - 4/6/2017 |
View all notes |
Set NEW NOTE alert |
Company Profile |
SEC
News |
Chart |
Request a new note
C
A
S
I |
|
|
|
THESE ARE NOT BUY RECOMMENDATIONS!
Comments contained in the body of this report are technical
opinions only. The material herein has been obtained
from sources believed to be reliable and accurate, however,
its accuracy and completeness cannot be guaranteed.
This site is not an investment advisor, hence it does
not endorse or recommend any securities or other investments.
Any recommendation contained in this report may not
be suitable for all investors and it is not to be deemed
an offer or solicitation on our part with respect to
the purchase or sale of any securities. All trademarks,
service marks and trade names appearing in this report
are the property of their respective owners, and are
likewise used for identification purposes only.
This report is a service available
only to active Paid Premium Members.
You may opt-out of receiving report notifications
at any time. Questions or comments may be submitted
by writing to Premium Membership Services 665 S.E. 10 Street, Suite 201 Deerfield Beach, FL 33441-5634 or by calling 1-800-965-8307
or 954-785-1121.
|
|
|