You are not logged in.
This means you
CAN ONLY VIEW reports that were published prior to Wednesday, March 26, 2025.
You
MUST UPGRADE YOUR MEMBERSHIP if you want to see any current reports.
AFTER MARKET UPDATE - WEDNESDAY, MAY 3RD, 2017
Previous After Market Report Next After Market Report >>>
|
|
|
|
DOW |
+8.01 |
20,957.90 |
+0.04% |
|
Volume |
1,064,649,840 |
-1% |
|
Volume |
1,963,213,260 |
+0% |
|
NASDAQ |
-22.82 |
6,072.55 |
-0.37% |
|
Advancers |
1,170 |
40% |
|
Advancers |
1,014 |
36% |
|
S&P 500 |
-3.04 |
2,388.13 |
-0.13% |
|
Decliners |
1,736 |
60% |
|
Decliners |
1,802 |
64% |
|
Russell 2000 |
-8.44 |
1,390.92 |
-0.60% |
|
52 Wk Highs |
120 |
|
|
52 Wk Highs |
91 |
|
|
S&P 600 |
-5.53 |
846.43 |
-0.65% |
|
52 Wk Lows |
51 |
|
|
52 Wk Lows |
68 |
|
|
 |
Indices Were Little Changed While Leadership Thinned
Kenneth J. Gruneisen - Passed the CAN SLIM® Master's Exam
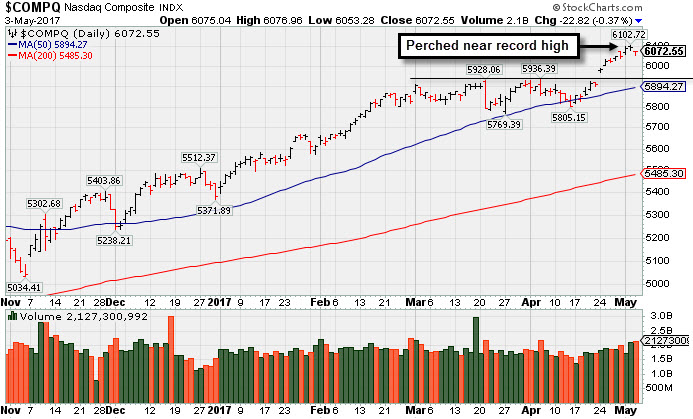
Stocks were little changed on Wednesday. The Dow was up 8 points to 20957. The S&P 500 lost 3 points to 2388 and the Nasdaq Composite fell 22 points to 6072. The volume totals reported were near the prior session totals on the NYSE and on the Nasdaq exchange. Breadth was negative as decliners led advancers by a 3-2 margin on the NYSE and 9-5 on the Nasdaq exchange. There were 33 high-ranked companies from the Leaders List that made new 52-week highs and were listed on the BreakOuts Page, versus the total of 72 on the prior session. New 52-week highs totals contracted yet still outnumbered new 52-week lows on the NYSE and on the Nasdaq exchange. PICTURED: The Nasdaq Composite Index is perched near its record high.
The major averages' (M criteria) are in a confirmed uptrend, and there has remains a healthy level of market leadership (number of high-ranked stocks hitting new highs). New buying efforts should be made only in stocks matching all of the fundamental and technical criteria of the fact-based investment system. The Featured Stocks Page lists noteworthy high-ranked leaders.
The major averages finished mostly lower after Federal Reserve officials expressed concern with the pace of economic growth. As expected, the central bank left the benchmark interest rate unchanged as inflation is still below the 2% target objective. On the data front, an ADP report showed that 177,000 workers were added to private payrolls in April, slightly above estimates of 175,000. Separately, ISM’s non-manufacturing composite index expanded to 55.2 last month, above expectations.
Seven of 11 sectors in the S&P 500 ended in negative territory. Technology stocks underperformed with Apple (AAPL -0.31%) edging lower as the tech giant’s revenue missed forecasts amid weaker-than-expected iPhone sales. Akamai Technologies (AKAM -15.52%) slid after the company cited continued weakness in its video business. Elsewhere in Tech, Facebook (FB -0.64%) edged lower ahead of its scheduled release after the closing bell. FireEye (FEYE +12.86%) rose after being the subject of positive analyst commentary. In the consumer space, Mondelez International (MDLZ +2.95%) rose as the snack maker beat estimates on the top and bottom line.
Treasuries finished mostly lower with the benchmark 10-year note down 11/32 to yield 2.32%. In commodities, NYMEX WTI crude added 0.1% to $47.72/barrel. COMEX gold fell 1.3% to $1240.70/ounce. |
 Kenneth J. Gruneisen started out as a licensed stockbroker in August 1987, a couple of months prior to the historic stock market crash that took the Dow Jones Industrial Average down -22.6% in a single day. He has published daily fact-based fundamental and technical analysis on high-ranked stocks online for two decades. Through FACTBASEDINVESTING.COM, Kenneth provides educational articles, news, market commentary, and other information regarding proven investment systems that work in good times and bad.
Comments contained in the body of this report are technical opinions only and are not necessarily those of Gruneisen Growth Corp. The material herein has been obtained from sources believed to be reliable and accurate, however, its accuracy and completeness cannot be guaranteed. Our firm, employees, and customers may effect transactions, including transactions contrary to any recommendation herein, or have positions in the securities mentioned herein or options with respect thereto. Any recommendation contained in this report may not be suitable for all investors and it is not to be deemed an offer or solicitation on our part with respect to the purchase or sale of any securities. |
|
 |
Financial, Oil Services, Semiconductor and Biotech Indexes Rose
Kenneth J. Gruneisen - Passed the CAN SLIM® Master's Exam
The Bank Index ($BKX +1.01%) and the Broker/Dealer Index ($XBD +0.53%) posted gains on Wednesday. The Retail Index ($RLX -0.10%) edged lower. The tech sector was led lower by the Networking Index ($NWX -0.75%) while the Semiconductor Index ($SOX +0.34%) and the Biotechnology Index ($BTK +0.25%) both posted small gains. Commodity-linked groups were mixed as the Oil Services Index ($OSX +0.58%) edged higher but the Integrated Oil Index ($XOI -0.25%) and the Gold & Silver index ($XAU -0.85%) both ended lower. Charts courtesy www.stockcharts.com
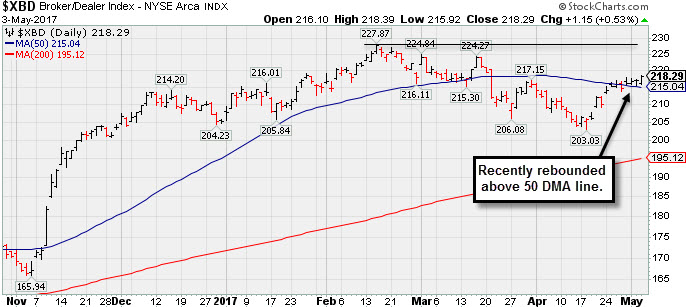 PICTURED: The Broker/Dealer Index ($XBD +0.53%) recently rebounded above its 50-day moving average (DMA) line.
| Oil Services |
$OSX |
149.83 |
+0.86 |
+0.58% |
-18.48% |
| Integrated Oil |
$XOI |
1,144.32 |
-2.83 |
-0.25% |
-9.75% |
| Semiconductor |
$SOX |
1,008.05 |
+3.43 |
+0.34% |
+11.21% |
| Networking |
$NWX |
447.89 |
-3.40 |
-0.75% |
+0.40% |
| Broker/Dealer |
$XBD |
218.29 |
+1.15 |
+0.53% |
+6.34% |
| Retail |
$RLX |
1,514.89 |
-1.49 |
-0.10% |
+12.80% |
| Gold & Silver |
$XAU |
80.57 |
-0.69 |
-0.85% |
+2.17% |
| Bank |
$BKX |
92.69 |
+0.93 |
+1.01% |
+0.98% |
| Biotech |
$BTK |
3,640.25 |
+9.20 |
+0.25% |
+18.38% |
|
|
|
 |
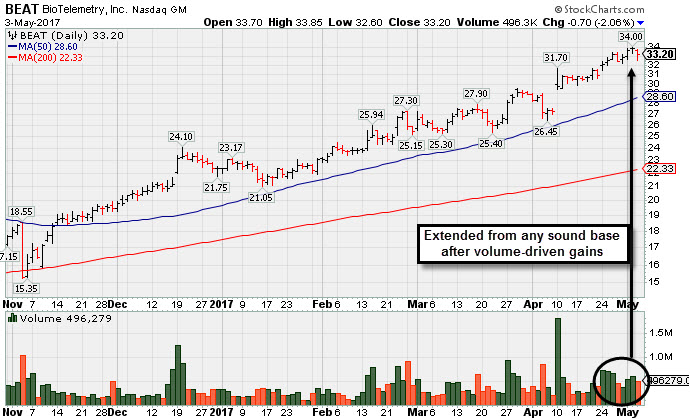
Extended From Sound Base and Earnings Below +25% Guideline
Kenneth J. Gruneisen - Passed the CAN SLIM® Master's Exam
BioTelemetry Inc (BEAT -$0.70 or -2.06% to $33.20) pulled back from all-time high territory with a loss today on average volume. After the close it reported earnings -20% on +15% sales revenues for the Mar '17 quarter, below the +25% minimum earnings guideline (C criteria), raising fundamental concerns. Volume and volatility often increase near earnings news.
Prior earnings growth was much stronger. Members were repeatedly reminded in recent weeks - "It is extended from its prior base. Disciplined investors avoid chasing extended stocks. Prior highs in the $24 area and its 50-day moving average (DMA) line ($28.60) define important near-term support to watch."
BEAT was last shown in this FSU section on 4/03/17 with an annotated graph under the headline, "Perched Near High, Extended From Prior Base". It traded up as much as +48.4% since first highlighted in yellow with pivot point cited based on its 10/05/16 high plus 10 cents in the 12/19/16 mid-day report (read here).
Its current Up/Down Volume Ratio of 1.8 is an unbiased indication its shares have been under accumulation over the past 50 days. The number of top-rated funds owning its shares rose from 194 in Dec '15 to 276 in Mar '17. Increasing ownership by top-rated funds is a reassuring sign concerning the I criteria, and it has a small supply (S criteria) of only 28.1 million shares outstanding.
|
|
|
Color Codes Explained :
Y - Better candidates highlighted by our
staff of experts.
G - Previously featured
in past reports as yellow but may no longer be buyable under the
guidelines.
***Last / Change / Volume data in this table is the closing quote data***
Symbol/Exchange
Company Name
Industry Group |
PRICE |
CHANGE
(%Change) |
Day High |
Volume
(% DAV)
(% 50 day avg vol) |
52 Wk Hi
% From Hi |
Featured
Date |
Price
Featured |
Pivot Featured |
|
Max Buy |
SBCF
-
NASDAQ
Seacoast Banking Corp Fl
BANKING - Regional - Mid-Atlantic Banks
|
$23.78
|
-0.19
-0.79% |
$23.99
|
270,116
69.44% of 50 DAV
50 DAV is 389,000
|
$25.88
-8.11%
|
4/24/2017
|
$25.33
|
PP = $24.38
|
|
MB = $25.60
|
Most Recent Note - 5/2/2017 6:51:31 PM
Y - Pulled back today with light volume, closing just above its 50 DMA line. Recent gains above the pivot point lacked the above average volume needed to trigger a proper new (or add-on) technical buy signal. The 50 DMA line ($23.80) and recent low ($21.89 on 3/22/17) define support where violations would raise more serious concerns and trigger worrisome technical sell signals.
>>> FEATURED STOCK ARTICLE : Pullback Following Recent Gains With Unimpressive Volume - 4/27/2017 |
View all notes |
Set NEW NOTE alert |
Company Profile |
SEC
News |
Chart |
Request a new note
C
A
S
I |
CSFL
-
NASDAQ
Centerstate Banks Inc
Banks-Southeast
|
$25.23
|
-0.06
-0.24% |
$25.31
|
342,969
109.23% of 50 DAV
50 DAV is 314,000
|
$26.94
-6.34%
|
3/13/2017
|
$25.54
|
PP = $26.40
|
|
MB = $27.72
|
Most Recent Note - 5/2/2017 6:52:37 PM
Y - Consolidating near its 50 DMA line ($25.25). Reported earnings +10% on +13% sales revenues for the Mar '17 quarter, below the +25% minimum earnings guideline. Damaging losses below its recent low ($23.64 on 4/17/17) would raise more serious concerns.
>>> FEATURED STOCK ARTICLE : Positive Reversal After Intra-day Low Undercut Prior Lows - 4/17/2017 |
View all notes |
Set NEW NOTE alert |
Company Profile |
SEC
News |
Chart |
Request a new note
C
A
S
I |
NSP
-
NYSE
Insperity Inc
Comml Svcs-Outsourcing
|
$84.75
|
-2.35
-2.70% |
$86.80
|
161,961
110.93% of 50 DAV
50 DAV is 146,000
|
$93.65
-9.50%
|
4/21/2017
|
$88.65
|
PP = $90.65
|
|
MB = $95.18
|
 Most Recent Note - 5/3/2017 6:07:29 PM
G - Sank below its 50 DMA line today with a loss on average volume testing prior lows. Only a prompt rebound above the 50 DMA line ($87.02) would help its outlook improve. More damaging losses would raise greater concerns. Reported earnings +13% on +10% sales revenues for the Mar '17 quarter, below the +25% minimum guideline (C criteria), raising fundamental concerns.
>>> FEATURED STOCK ARTICLE : New Base Formed Above 50-Day Moving Average Line - 4/21/2017 |
View all notes |
Set NEW NOTE alert |
Company Profile |
SEC
News |
Chart |
Request a new note
C
A
S
I |
HTHT
-
NASDAQ
China Lodging Group Ads
LEISURE - Lodging
|
$71.56
|
+0.02
0.03% |
$71.90
|
96,893
59.81% of 50 DAV
50 DAV is 162,000
|
$72.85
-1.78%
|
9/29/2016
|
$46.12
|
PP = $47.82
|
|
MB = $50.21
|
Most Recent Note - 5/3/2017 6:02:54 PM
G - Holding its ground stubbornly at its all-time high. Found prompt support near its 50 DMA line during its ongoing advance. Repeatedly noted with caution - "The 2 latest quarterly comparisons (Sep and Dec '16) were below the +25% minimum earnings guideline (C criteria), and its waning sales revenues growth rate was also noted recently as a fundamental concern.
>>> FEATURED STOCK ARTICLE : Support Shown Promptly After 50-Day Moving Average Violation - 4/19/2017 |
View all notes |
Set NEW NOTE alert |
Company Profile |
SEC
News |
Chart |
Request a new note
C
A
S
I |
SIRI
-
NASDAQ
Sirius XM Holdings Inc
MEDIA - Broadcasting - Radio
|
$4.85
|
+0.01
0.21% |
$4.91
|
28,371,602
99.87% of 50 DAV
50 DAV is 28,409,600
|
$5.53
-12.30%
|
3/13/2017
|
$5.48
|
PP = $5.32
|
|
MB = $5.59
|
Most Recent Note - 5/3/2017 2:06:43 PM
Fundamentals remain strong, however its Relative Strength rank has slumped to 66, below the 80+ minimum guideline for buy candidates. A rebound above the 50 DMA line ($5.13) is needed for its outlook to improve. It will be dropped from the Featured Stocks list tonight.
>>> FEATURED STOCK ARTICLE : Consolidating Above Near-Term Support Level - 4/13/2017 |
View all notes |
Set NEW NOTE alert |
Company Profile |
SEC
News |
Chart |
Request a new note
C
A
S
I |
Symbol/Exchange
Company Name
Industry Group |
PRICE |
CHANGE
(%Change) |
Day High |
Volume
(% DAV)
(% 50 day avg vol) |
52 Wk Hi
% From Hi |
Featured
Date |
Price
Featured |
Pivot Featured |
|
Max Buy |
BEAT
-
NASDAQ
BioTelemetry Inc
Medical-Services
|
$33.20
|
-0.70
-2.06% |
$33.85
|
496,299
108.13% of 50 DAV
50 DAV is 459,000
|
$34.00
-2.35%
|
2/14/2017
|
$25.10
|
PP = $24.55
|
|
MB = $25.78
|
Most Recent Note - 5/3/2017 6:01:31 PM
G - Reported earnings -20% on +15% sales revenues for the Mar '17 quarter versus the year ago period. Volume and volatility often increase near earnings news. Extended from any sound base. Its 50 DMA line ($28.60) defines the nearest support level. See the latest FSU analysis for more details and a new annotated graph.
>>> FEATURED STOCK ARTICLE : Extended From Sound Base and Earnings Below +25% Guideline - 5/3/2017 |
View all notes |
Set NEW NOTE alert |
Company Profile |
SEC
News |
Chart |
Request a new note
C
A
S
I |
ULTA
-
NASDAQ
Ulta Beauty Inc
SPECIALTY RETAIL - Specialty Retail, Other
|
$290.36
|
+1.77
0.61% |
$22.00
|
457,706
69.66% of 50 DAV
50 DAV is 657,100
|
$289.27
0.38%
|
3/6/2017
|
$274.96
|
PP = $278.73
|
|
MB = $292.67
|
Most Recent Note - 5/1/2017 4:21:47 PM
G - Its current Relative Strength rank is 71, below the 80+ guideline for buy candidates. Tested prior highs in the $278 area defining important support along with its 50 DMA line ($280.94). More damaging losses would raise concerns and trigger technical sell signals.
>>> FEATURED STOCK ARTICLE : Volume Totals Cooling Following Technical Breakout - 4/7/2017 |
View all notes |
Set NEW NOTE alert |
Company Profile |
SEC
News |
Chart |
Request a new note
C
A
S
I |
ESNT
-
NYSE
Essent Group Ltd
Finance-MrtgandRel Svc
|
$36.64
|
-0.01
-0.03% |
$36.82
|
452,589
66.75% of 50 DAV
50 DAV is 678,000
|
$39.50
-7.24%
|
4/4/2017
|
$36.38
|
PP = $36.81
|
|
MB = $38.65
|
Most Recent Note - 5/2/2017 6:55:11 PM
Y - Suffered a 4th consecutive loss on near average volume today. Its 50 DMA line ($36.17) and recent lows define important near-term support where violations would trigger technical sell signals.
>>> FEATURED STOCK ARTICLE : Quiet Volume Behind Gain for New High Close - 4/10/2017 |
View all notes |
Set NEW NOTE alert |
Company Profile |
SEC
News |
Chart |
Request a new note
C
A
S
I |
MTSI
-
NASDAQ
Macom Tech Solution Hldg
Elec-Semiconductor Mfg
|
$45.67
|
-1.28
-2.73% |
$46.65
|
802,817
147.04% of 50 DAV
50 DAV is 546,000
|
$55.18
-17.23%
|
4/25/2017
|
$54.57
|
PP = $53.90
|
|
MB = $56.60
|
Most Recent Note - 5/3/2017 2:03:40 PM
Fundamentals remain strong. Slumping near its 200 DMA line today and its Relative Strength rating has slumped to 70, below the 80+ minimum guideline for buy candidates. Gains above the 50 DMA line ($48.13) are needed for its outlook to improve. It will be dropped from the Featured Stocks list tonight.
>>> FEATURED STOCK ARTICLE : Strong Earnings Report While Perched at All-Time High - 4/25/2017 |
View all notes |
Set NEW NOTE alert |
Company Profile |
SEC
News |
Chart |
Request a new note
C
A
S
I |
VEEV
-
NYSE
Veeva Systems Inc Cl A
Computer Sftwr-Medical
|
$54.03
|
+0.02
0.04% |
$54.36
|
858,187
64.43% of 50 DAV
50 DAV is 1,332,000
|
$54.50
-0.86%
|
3/16/2017
|
$49.00
|
PP = $48.05
|
|
MB = $50.45
|
Most Recent Note - 5/2/2017 1:55:41 PM
G - Perched near its all-time high, extended from any sound base. Its 50 DMA line ($48.97) defines support above prior highs in the $47-48 area.
>>> FEATURED STOCK ARTICLE : Hovering Near High, Stubbornly Holding its Ground - 4/18/2017 |
View all notes |
Set NEW NOTE alert |
Company Profile |
SEC
News |
Chart |
Request a new note
C
A
S
I |
Symbol/Exchange
Company Name
Industry Group |
PRICE |
CHANGE
(%Change) |
Day High |
Volume
(% DAV)
(% 50 day avg vol) |
52 Wk Hi
% From Hi |
Featured
Date |
Price
Featured |
Pivot Featured |
|
Max Buy |
ANET
-
NYSE
Arista Networks Inc
TELECOMMUNICATIONS - Communication Equipment
|
$140.68
|
-0.51
-0.36% |
$141.85
|
679,070
88.65% of 50 DAV
50 DAV is 766,000
|
$141.92
-0.87%
|
4/17/2017
|
$132.75
|
PP = $135.27
|
|
MB = $142.03
|
Most Recent Note - 5/1/2017 8:19:20 PM
Y - Hit yet another new all-time high with a gain on light volume. Gains with at least +40% above average volume while rising above the new pivot point cited would trigger a new (or add-on) technical buy signal.
>>> FEATURED STOCK ARTICLE : Extended From Any Sound Base After a Considerable Rally - 4/5/2017 |
View all notes |
Set NEW NOTE alert |
Company Profile |
SEC
News |
Chart |
Request a new note
C
A
S
I |
GRUB
-
NYSE
Grubhub Inc
COMPUTER SOFTWARE and SERVICES - Technical and System Software
|
$44.89
|
+0.80
1.81% |
$44.92
|
2,222,377
88.33% of 50 DAV
50 DAV is 2,516,000
|
$45.09
-0.44%
|
4/28/2017
|
$44.22
|
PP = $44.68
|
|
MB = $46.91
|
Most Recent Note - 5/2/2017 1:49:00 PM
Y - Challenging its 52-week high with volume running at an above average pace behind today's big gain. A gain and strong close above the pivot point may clinch a technical buy signal.
>>> FEATURED STOCK ARTICLE : Hit New 52-Week High But Ended Near Session Low - 4/28/2017 |
View all notes |
Set NEW NOTE alert |
Company Profile |
SEC
News |
Chart |
Request a new note
C
A
S
I |
IBP
-
NYSE
Installed Building Prod
DIVERSIFIED SERVICES - Business/Management Services
|
$51.85
|
-0.75
-1.43% |
$53.00
|
177,490
109.56% of 50 DAV
50 DAV is 162,000
|
$55.45
-6.49%
|
4/17/2017
|
$51.75
|
PP = $53.10
|
|
MB = $55.76
|
Most Recent Note - 5/2/2017 6:48:49 PM
Y - Pulled back below its pivot point with near average volume behind today's 3rd loss in the span of 4 sessions after reversing at its all-time high. Wedged higher with gains lacking great volume conviction after an advanced "3-weeks tight" base was noted. Subsequent volume-driven gains above the new pivot point cited may clinch a new (or add-on) technical buy signal. Its 50 DMA line ($50.51) and recent low define important near-term support to watch.
>>> FEATURED STOCK ARTICLE : Hovering Near All-Time High Following Volume-Driven Gains - 4/4/2017 |
View all notes |
Set NEW NOTE alert |
Company Profile |
SEC
News |
Chart |
Request a new note
C
A
S
I |
NCOM
-
NASDAQ
National Commerce Corp
BANKING - Regional - Southeast Banks
|
$38.85
|
-0.15
-0.38% |
$39.00
|
26,567
83.02% of 50 DAV
50 DAV is 32,000
|
$40.00
-2.88%
|
4/25/2017
|
$38.95
|
PP = $40.09
|
|
MB = $42.09
|
Most Recent Note - 5/1/2017 8:17:25 PM
Y - Still perched near its 52-week high. A gain above the pivot point backed by a minimum of +40% above average volume may trigger a technical buy signal.
>>> FEATURED STOCK ARTICLE : Challenging 52-Week High With Volume-Driven Gains - 4/26/2017 |
View all notes |
Set NEW NOTE alert |
Company Profile |
SEC
News |
Chart |
Request a new note
C
A
S
I |
INGN
-
NASDAQ
Inogen Inc
HEALTH SERVICES - Medical Instruments and Supplies
|
$83.73
|
-0.99
-1.17% |
$84.63
|
139,022
77.67% of 50 DAV
50 DAV is 179,000
|
$85.94
-2.57%
|
4/17/2017
|
$76.77
|
PP = $80.04
|
|
MB = $84.04
|
Most Recent Note - 5/1/2017 4:20:25 PM
G - Color code is changed to green after hitting a new all-time high and finishing the session above its "max buy" level with a gain on below average volume. Recent gains above the pivot point lacked the minimum +40% above average volume needed to trigger a proper new (or add-on) technical buy signal. Its 50 DMA line ($75.30) defines near-term support to watch.
>>> FEATURED STOCK ARTICLE : Wedging Higher With Recent Gains Lacking Great Volume - 5/1/2017 |
View all notes |
Set NEW NOTE alert |
Company Profile |
SEC
News |
Chart |
Request a new note
C
A
S
I |
Symbol/Exchange
Company Name
Industry Group |
PRICE |
CHANGE
(%Change) |
Day High |
Volume
(% DAV)
(% 50 day avg vol) |
52 Wk Hi
% From Hi |
Featured
Date |
Price
Featured |
Pivot Featured |
|
Max Buy |
PLAY
-
NASDAQ
Dave & Buster's Ent Inc
Retail-Restaurants
|
$65.78
|
+0.01
0.02% |
$65.93
|
490,956
61.68% of 50 DAV
50 DAV is 796,000
|
$65.78
0.00%
|
2/23/2017
|
$55.41
|
PP = $58.35
|
|
MB = $61.27
|
Most Recent Note - 5/2/2017 6:44:42 PM
G - Finished at the session high with a gain on near average volume. Its 50 DMA line ($59.99) defines near-term support to watch on pullbacks. Latest quarter was below the +25% minimum guideline (C criteria), raising fundamental concerns. See the latest FSU analysis for more details and a new annotated graph.
>>> FEATURED STOCK ARTICLE : New Record High With Solid Gain on Near Average Volume - 5/2/2017 |
View all notes |
Set NEW NOTE alert |
Company Profile |
SEC
News |
Chart |
Request a new note
C
A
S
I |
OLLI
-
NASDAQ
Ollie's Bargain Outlet
Retail-DiscountandVariety
|
$39.50
|
+0.45
1.15% |
$39.58
|
595,554
99.93% of 50 DAV
50 DAV is 596,000
|
$39.10
1.02%
|
3/27/2017
|
$32.80
|
PP = $33.55
|
|
MB = $35.23
|
Most Recent Note - 5/2/2017 6:49:44 PM
G - Hit yet another new high today, getting very extended from any sound base. Bullish action has continued since reporting earnings +22% on +16% sales revenues for the Jan '17 quarter, below the +25% minimum earnings guideline (C criteria). Its 50 DMA line and prior highs in the $33 area define near-term support.
>>> FEATURED STOCK ARTICLE : Winning Streak Continues for Discount Retailer - 4/24/2017 |
View all notes |
Set NEW NOTE alert |
Company Profile |
SEC
News |
Chart |
Request a new note
C
A
S
I |
MOMO
-
NASDAQ
Momo Inc Ads Cl A
INTERNET - Content
|
$38.30
|
-1.24
-3.14% |
$39.56
|
3,747,093
70.70% of 50 DAV
50 DAV is 5,300,000
|
$40.43
-5.27%
|
3/7/2017
|
$29.71
|
PP = $27.83
|
|
MB = $29.22
|
Most Recent Note - 5/3/2017 6:04:20 PM
G - Pulled back from its all-time high with today's loss on below average volume. Its 50 DMA line ($33.77) defines important near-term support to watch.
>>> FEATURED STOCK ARTICLE : Extended From Prior Base and Perched Near High - 4/6/2017 |
View all notes |
Set NEW NOTE alert |
Company Profile |
SEC
News |
Chart |
Request a new note
C
A
S
I |
|
|
|
THESE ARE NOT BUY RECOMMENDATIONS!
Comments contained in the body of this report are technical
opinions only. The material herein has been obtained
from sources believed to be reliable and accurate, however,
its accuracy and completeness cannot be guaranteed.
This site is not an investment advisor, hence it does
not endorse or recommend any securities or other investments.
Any recommendation contained in this report may not
be suitable for all investors and it is not to be deemed
an offer or solicitation on our part with respect to
the purchase or sale of any securities. All trademarks,
service marks and trade names appearing in this report
are the property of their respective owners, and are
likewise used for identification purposes only.
This report is a service available
only to active Paid Premium Members.
You may opt-out of receiving report notifications
at any time. Questions or comments may be submitted
by writing to Premium Membership Services 665 S.E. 10 Street, Suite 201 Deerfield Beach, FL 33441-5634 or by calling 1-800-965-8307
or 954-785-1121.
|
|
|