***Last / Change / Volume data in this table is the closing quote data***
Symbol/Exchange
Company Name
Industry Group |
PRICE |
CHANGE
(%Change) |
Day High |
Volume
(% DAV)
(% 50 day avg vol) |
52 Wk Hi
% From Hi |
Featured
Date |
Price
Featured |
Pivot Featured |
|
Max Buy |
SBCF
-
NASDAQ
Seacoast Banking Corp Fl
BANKING - Regional - Mid-Atlantic Banks
|
$25.00
|
-0.23
-0.91% |
$25.58
|
573,259
124.08% of 50 DAV
50 DAV is 462,000
|
$25.88
-3.40%
|
4/24/2017
|
$25.33
|
PP = $24.38
|
|
MB = $25.60
|
Most Recent Note - 4/24/2017 6:31:14 PM
Y - Color code is changed to yellow with new pivot point cited based on its 3/31/17 high after a cup with handle base. Gapped up today and hit a new all-time high with today's 6th consecutive gain. Gains above the pivot point should be backed by a minimum of +40% above average volume to trigger a proper new (or add-on) technical buy signal. The 50 DMA line ($23.72) and recent low ($21.89 on 3/22/17) define support where violations would raise more serious concerns and trigger worrisome technical sell signals.
>>> FEATURED STOCK ARTICLE : Rebound After Slump Below 50-Day Average Into Prior Base - 3/28/2017 |
View all notes |
Set NEW NOTE alert |
Company Profile |
SEC
News |
Chart |
Request a new note
C
A
S
I |
CSFL
-
NASDAQ
Centerstate Banks Inc
Banks-Southeast
|
$26.16
|
+0.07
0.27% |
$26.54
|
335,456
113.71% of 50 DAV
50 DAV is 295,000
|
$26.94
-2.89%
|
3/13/2017
|
$25.54
|
PP = $26.40
|
|
MB = $27.72
|
Most Recent Note - 4/24/2017 6:22:52 PM
Y - Rebounded further above its 50 DMA line toward prior highs. Damaging losses below its recent low ($23.64 on 4/17/17) would raise more serious concerns.
>>> FEATURED STOCK ARTICLE : Positive Reversal After Intra-day Low Undercut Prior Lows - 4/17/2017 |
View all notes |
Set NEW NOTE alert |
Company Profile |
SEC
News |
Chart |
Request a new note
C
A
S
I |
NSP
-
NYSE
Insperity Inc
Comml Svcs-Outsourcing
|
$92.25
|
+1.45
1.60% |
$93.43
|
115,260
75.33% of 50 DAV
50 DAV is 153,000
|
$91.80
0.49%
|
4/21/2017
|
$88.65
|
PP = $90.65
|
|
MB = $95.18
|
Most Recent Note - 4/25/2017 7:37:17 PM
Y - Hit a new high with today's gain on light volume. Color code was changed to yellow with new pivot point cited based on its 3/15/17 high plus 10 cents. Gains above the pivot point backed by at least +40% above average volume are needed to trigger a proper new (or add-on) technical buy signal. Found support while consolidating in an orderly fashion above its 50 DMA line. See the latest FSU analysis for more details and an annotated graph.
>>> FEATURED STOCK ARTICLE : New Base Formed Above 50-Day Moving Average Line - 4/21/2017 |
View all notes |
Set NEW NOTE alert |
Company Profile |
SEC
News |
Chart |
Request a new note
C
A
S
I |
HTHT
-
NASDAQ
China Lodging Group Ads
LEISURE - Lodging
|
$68.64
|
+1.28
1.90% |
$68.96
|
71,575
42.86% of 50 DAV
50 DAV is 167,000
|
$68.34
0.44%
|
9/29/2016
|
$46.12
|
PP = $47.82
|
|
MB = $50.21
|
 Most Recent Note - 4/26/2017 5:04:56 PM
G - Touched another new all-time high with today's 3rd consecutive gain with light volume. Found prompt support after violating its 50 DMA line on 4/11/17. Recent low ($57.89 on 4/11/17) defines near-term support to watch on pullbacks. Repeatedly noted with caution - "The 2 latest quarterly comparisons (Sep and Dec '16) were below the +25% minimum earnings guideline (C criteria), and its waning sales revenues growth rate was also noted recently as a fundamental concern.
>>> FEATURED STOCK ARTICLE : Support Shown Promptly After 50-Day Moving Average Violation - 4/19/2017 |
View all notes |
Set NEW NOTE alert |
Company Profile |
SEC
News |
Chart |
Request a new note
C
A
S
I |
SIRI
-
NASDAQ
Sirius X M Holdings Inc
MEDIA - Broadcasting - Radio
|
$5.11
|
-0.10
-1.83% |
$5.20
|
33,671,781
127.73% of 50 DAV
50 DAV is 26,361,000
|
$5.53
-7.59%
|
3/13/2017
|
$5.48
|
PP = $5.32
|
|
MB = $5.59
|
Most Recent Note - 4/24/2017 6:33:46 PM
G - Finished at the session high with above average volume behind today's 5th consecutive gain, closing above its 50 DMA line ($5.11), helping its outlook to improve. More damaging losses below the recent low ($4.95 on 4/19/17) would raise greater concerns and trigger a more worrisome technical sell signal.
>>> FEATURED STOCK ARTICLE : Consolidating Above Near-Term Support Level - 4/13/2017 |
View all notes |
Set NEW NOTE alert |
Company Profile |
SEC
News |
Chart |
Request a new note
C
A
S
I |
Symbol/Exchange
Company Name
Industry Group |
PRICE |
CHANGE
(%Change) |
Day High |
Volume
(% DAV)
(% 50 day avg vol) |
52 Wk Hi
% From Hi |
Featured
Date |
Price
Featured |
Pivot Featured |
|
Max Buy |
BEAT
-
NASDAQ
BioTelemetry Inc
Medical-Services
|
$33.20
|
+0.65
2.00% |
$33.45
|
654,616
144.51% of 50 DAV
50 DAV is 453,000
|
$32.85
1.07%
|
2/14/2017
|
$25.10
|
PP = $24.55
|
|
MB = $25.78
|
Most Recent Note - 4/24/2017 6:21:30 PM
G - Gapped up and rallied with average volume for a new all-time high on M&A news. Disciplined investors avoid chasing extended stocks. During recent consolidations it found support well above its 50 DMA line and above prior highs in the $24 area.
>>> FEATURED STOCK ARTICLE : Perched Near High, Extended From Prior Base - 4/3/2017 |
View all notes |
Set NEW NOTE alert |
Company Profile |
SEC
News |
Chart |
Request a new note
C
A
S
I |
ULTA
-
NASDAQ
Ulta Salon Cosm & Frag
SPECIALTY RETAIL - Specialty Retail, Other
|
$279.69
|
+1.70
0.61% |
$280.98
|
485,437
74.32% of 50 DAV
50 DAV is 653,200
|
$289.27
-3.31%
|
3/6/2017
|
$274.96
|
PP = $278.73
|
|
MB = $292.67
|
Most Recent Note - 4/25/2017 11:27:40 AM
G - Color code is changed to green as its Relative Strength rank has slumped to 69, below the 80+ guideline for buy candidates. Testing prior highs in the $278 area defining important support along with its 50 DMA line ($280.12). More damaging losses would raise concerns and trigger technical sell signals.
>>> FEATURED STOCK ARTICLE : Volume Totals Cooling Following Technical Breakout - 4/7/2017 |
View all notes |
Set NEW NOTE alert |
Company Profile |
SEC
News |
Chart |
Request a new note
C
A
S
I |
ESNT
-
NYSE
Essent Group Ltd
Finance-MrtgandRel Svc
|
$38.91
|
+0.93
2.45% |
$39.38
|
567,902
80.90% of 50 DAV
50 DAV is 702,000
|
$39.50
-1.49%
|
4/4/2017
|
$36.38
|
PP = $36.81
|
|
MB = $38.65
|
Most Recent Note - 4/26/2017 3:20:46 PM
G - Color code is changed to green today after rising back above its "max buy" level. Its 50 DMA line ($36.11) and recent lows define important near-term support.
>>> FEATURED STOCK ARTICLE : Quiet Volume Behind Gain for New High Close - 4/10/2017 |
View all notes |
Set NEW NOTE alert |
Company Profile |
SEC
News |
Chart |
Request a new note
C
A
S
I |
MTSI
-
NASDAQ
Macom Tech Solution Hldg
Elec-Semiconductor Mfg
|
$50.32
|
-3.52
-6.54% |
$51.19
|
4,437,952
1,010.92% of 50 DAV
50 DAV is 439,000
|
$55.18
-8.80%
|
4/25/2017
|
$54.57
|
PP = $53.90
|
|
MB = $56.60
|
Most Recent Note - 4/26/2017 1:17:59 PM
G - Gapped down today and undercut its 50 DMA line then found prompt support. Its color code was changed to green. Had a "negative reversal" after highlighted in yellow in the 4/25/17 mid-day report with a pivot point cited based on its 12/07/16 high plus 10 cents. No resistance remains. Reported +38% earnings on +39% sales revenues for the Mar '17 quarter after the close. Volume and volatility often increase near earnings news. See the latest FSU analysis for more details and an annotated graph.
>>> FEATURED STOCK ARTICLE : Strong Earnings Report While Perched at All-Time High - 4/25/2017 |
View all notes |
Set NEW NOTE alert |
Company Profile |
SEC
News |
Chart |
Request a new note
C
A
S
I |
VEEV
-
NYSE
Veeva Systems Inc Cl A
Computer Sftwr-Medical
|
$52.99
|
+0.79
1.51% |
$53.19
|
821,318
62.70% of 50 DAV
50 DAV is 1,310,000
|
$53.37
-0.71%
|
3/16/2017
|
$49.00
|
PP = $48.05
|
|
MB = $50.45
|
Most Recent Note - 4/26/2017 5:09:25 PM
G - Small gain backed by light volume today for a best-ever close. Its 50 DMA line defines support along with prior highs in the $47-48 area.
>>> FEATURED STOCK ARTICLE : Hovering Near High, Stubbornly Holding its Ground - 4/18/2017 |
View all notes |
Set NEW NOTE alert |
Company Profile |
SEC
News |
Chart |
Request a new note
C
A
S
I |
Symbol/Exchange
Company Name
Industry Group |
PRICE |
CHANGE
(%Change) |
Day High |
Volume
(% DAV)
(% 50 day avg vol) |
52 Wk Hi
% From Hi |
Featured
Date |
Price
Featured |
Pivot Featured |
|
Max Buy |
ANET
-
NYSE
Arista Networks Inc
TELECOMMUNICATIONS - Communication Equipment
|
$139.36
|
-0.06
-0.04% |
$139.98
|
700,848
79.37% of 50 DAV
50 DAV is 883,000
|
$140.32
-0.68%
|
4/17/2017
|
$132.75
|
PP = $135.27
|
|
MB = $142.03
|
Most Recent Note - 4/21/2017 6:06:40 PM
Y - Perched at its all-time high following 5 consecutive small gains with light volume. Wedged higher with gains lacking great volume conviction since forming an advanced "3-weeks tight" base. Gains with at least +40% above average volume while rising above the new pivot point cited would trigger a new (or add-on) technical buy signal.
>>> FEATURED STOCK ARTICLE : Extended From Any Sound Base After a Considerable Rally - 4/5/2017 |
View all notes |
Set NEW NOTE alert |
Company Profile |
SEC
News |
Chart |
Request a new note
C
A
S
I |
IBP
-
NYSE
Installed Building Prod
DIVERSIFIED SERVICES - Business/Management Services
|
$54.80
|
+1.35
2.53% |
$54.90
|
117,390
76.23% of 50 DAV
50 DAV is 154,000
|
$54.60
0.37%
|
4/17/2017
|
$51.75
|
PP = $53.10
|
|
MB = $55.76
|
Most Recent Note - 4/26/2017 5:11:21 PM
Y - Hit a new all-time high today with another gain backed by light volume. Wedged higher with gains lacking great volume conviction after an advanced "3-weeks tight" base was noted. Subsequent volume-driven gains above the new pivot point cited may trigger a new (or add-on) technical buy signal. Its 50 DMA line ($49.53) defines important near-term support to watch.
>>> FEATURED STOCK ARTICLE : Hovering Near All-Time High Following Volume-Driven Gains - 4/4/2017 |
View all notes |
Set NEW NOTE alert |
Company Profile |
SEC
News |
Chart |
Request a new note
C
A
S
I |
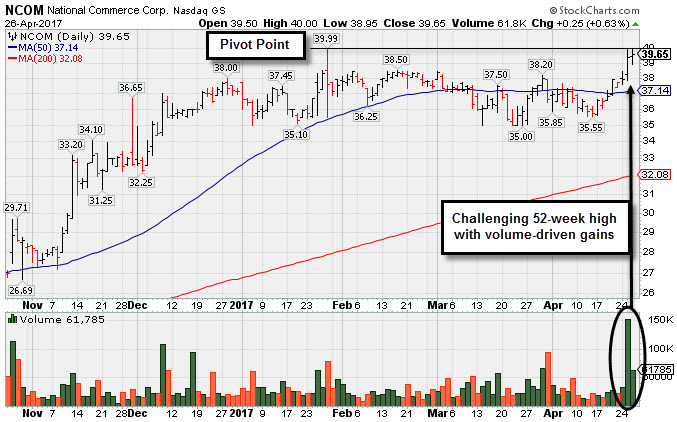
NCOM
-
NASDAQ
National Commerce Corp
BANKING - Regional - Southeast Banks
|
$39.65
|
+0.25
0.63% |
$40.00
|
61,785
199.31% of 50 DAV
50 DAV is 31,000
|
$40.00
-0.88%
|
4/25/2017
|
$38.95
|
PP = $40.09
|
|
MB = $42.09
|
Most Recent Note - 4/26/2017 5:00:53 PM
Y - Touched a new 52-week high with above average volume behind today's 3rd consecutive gain. It finished strong after highlighted in yellow in the 4/25/17 mid-day report with new pivot point cited based on its 1/27/17 high plus 10 cents. A gain above the pivot point backed by a minimum of +40% above average volume may trigger a technical buy signal. Up from its $20 IPO on 3/19/15. Reported Mar '17 earnings +32% on +42% sales revenues extending its streak to 9 consecutive quarterly comparisons with earnings increasing above the +25% minimum guideline (C criteria). See the latest FSU analysis for more details and an annotated graph.
>>> FEATURED STOCK ARTICLE : Challenging 52-Week High With Volume-Driven Gains - 4/26/2017 |
View all notes |
Set NEW NOTE alert |
Company Profile |
SEC
News |
Chart |
Request a new note
C
A
S
I |
INGN
-
NASDAQ
Inogen Inc
HEALTH SERVICES - Medical Instruments and Supplies
|
$82.30
|
+1.12
1.38% |
$82.52
|
154,608
87.85% of 50 DAV
50 DAV is 176,000
|
$82.38
-0.10%
|
4/17/2017
|
$76.77
|
PP = $80.04
|
|
MB = $84.04
|
Most Recent Note - 4/25/2017 11:33:25 AM
Y - Hitting a new all-time high with today's 4th consecutive gain on higher volume. Gains above the pivot point backed by at least +40% above average volume are needed to trigger a proper new (or add-on) technical buy signal. Its 50 DMA line ($74.13) defines near-term support to watch.
>>> FEATURED STOCK ARTICLE : Best Ever Close For High-Ranked Medical Product Maker - 3/31/2017 |
View all notes |
Set NEW NOTE alert |
Company Profile |
SEC
News |
Chart |
Request a new note
C
A
S
I |
PLAY
-
NASDAQ
Dave & Buster's Ent Inc
Retail-Restaurants
|
$64.03
|
+0.69
1.09% |
$64.50
|
436,894
54.54% of 50 DAV
50 DAV is 801,000
|
$64.48
-0.70%
|
2/23/2017
|
$55.41
|
PP = $58.35
|
|
MB = $61.27
|
Most Recent Note - 4/26/2017 5:06:38 PM
G - Posted a small gain with light volume today for a new high close. Its 50 DMA line ($59.45) defines near-term support to watch on pullbacks. Latest quarter was below the +25% minimum guideline (C criteria), raising fundamental concerns.
>>> FEATURED STOCK ARTICLE : Retreated From All-Time High Following Earnings Report - 3/29/2017 |
View all notes |
Set NEW NOTE alert |
Company Profile |
SEC
News |
Chart |
Request a new note
C
A
S
I |
Symbol/Exchange
Company Name
Industry Group |
PRICE |
CHANGE
(%Change) |
Day High |
Volume
(% DAV)
(% 50 day avg vol) |
52 Wk Hi
% From Hi |
Featured
Date |
Price
Featured |
Pivot Featured |
|
Max Buy |
OLLI
-
NASDAQ
Ollie's Bargain Outlet
Retail-DiscountandVariety
|
$38.45
|
+0.80
2.12% |
$38.88
|
714,664
122.37% of 50 DAV
50 DAV is 584,000
|
$37.95
1.32%
|
3/27/2017
|
$32.80
|
PP = $33.55
|
|
MB = $35.23
|
Most Recent Note - 4/24/2017 6:43:06 PM
G - Rallied further above its "max buy" level for a new all-time high with today's 6th consecutive gain. Bullish action has continued since reporting earnings +22% on +16% sales revenues for the Jan '17 quarter, below the +25% minimum earnings guideline (C criteria). See the latest FSU analysis for more details and a new annotated graph.
>>> FEATURED STOCK ARTICLE : Winning Streak Continues for Discount Retailer - 4/24/2017 |
View all notes |
Set NEW NOTE alert |
Company Profile |
SEC
News |
Chart |
Request a new note
C
A
S
I |
MOMO
-
NASDAQ
Momo Inc Ads Cl A
INTERNET - Content
|
$37.43
|
-0.73
-1.91% |
$37.50
|
6,105,647
118.44% of 50 DAV
50 DAV is 5,155,000
|
$39.25
-4.64%
|
3/7/2017
|
$29.71
|
PP = $27.83
|
|
MB = $29.22
|
Most Recent Note - 4/26/2017 10:29:04 AM
G - Gapped down today retreating from its all-time high. Its 50 DMA line ($32.55) defines important support to watch.
>>> FEATURED STOCK ARTICLE : Extended From Prior Base and Perched Near High - 4/6/2017 |
View all notes |
Set NEW NOTE alert |
Company Profile |
SEC
News |
Chart |
Request a new note
C
A
S
I |