You are not logged in.
This means you
CAN ONLY VIEW reports that were published prior to Thursday, March 20, 2025.
You
MUST UPGRADE YOUR MEMBERSHIP if you want to see any current reports.
AFTER MARKET UPDATE - MONDAY, MAY 8TH, 2017
Previous After Market Report Next After Market Report >>>
|
|
|
|
DOW |
+5.34 |
21,012.28 |
+0.03% |
|
Volume |
1,024,026,970 |
+6% |
|
Volume |
1,731,800,960 |
+0% |
|
NASDAQ |
+1.90 |
6,102.66 |
+0.03% |
|
Advancers |
1,318 |
45% |
|
Advancers |
1,293 |
45% |
|
S&P 500 |
+0.09 |
2,399.38 |
+0.00% |
|
Decliners |
1,608 |
55% |
|
Decliners |
1,569 |
55% |
|
Russell 2000 |
-5.36 |
1,391.64 |
-0.38% |
|
52 Wk Highs |
147 |
|
|
52 Wk Highs |
169 |
|
|
S&P 600 |
-2.82 |
846.14 |
-0.33% |
|
52 Wk Lows |
33 |
|
|
52 Wk Lows |
58 |
|
|
 |
Major Indices Ended Little Changed
Kenneth J. Gruneisen - Passed the CAN SLIM® Master's Exam
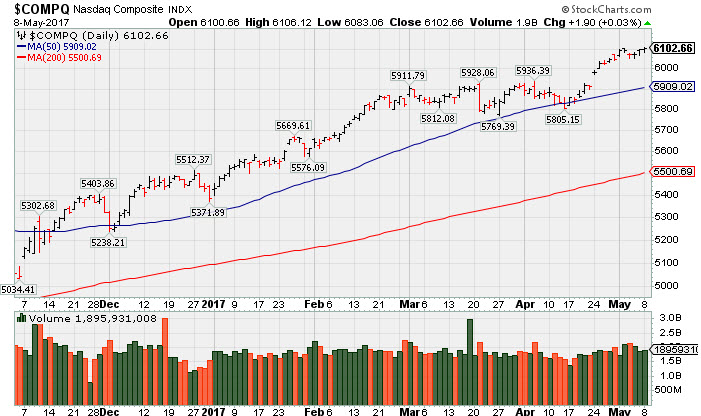
Stocks finished little changed on Monday. The Dow was up 5 points to 21012. The S&P 500 finished flat at 2399 and the Nasdaq Composite gained 2 points to 6102. The volume totals reported were higher than the prior session totals on the NYSE and on the Nasdaq exchange. Breadth was slightly negative as decliners led advancers by a 7-5 margin on the NYSE and on the Nasdaq exchange. There were 61 high-ranked companies from the Leaders List that made new 52-week highs and were listed on the BreakOuts Page, versus the total of 69 on the prior session. New 52-week highs totals contracted yet solidly outnumbered new 52-week lows on the NYSE and on the Nasdaq exchange. PICTURED: The Nasdaq Composite Index posted a 3rd consecutive gain and touched a new record high.
The major averages' (M criteria) are in a confirmed uptrend, and there has remains a healthy level of market leadership (number of high-ranked stocks hitting new highs). New buying efforts should be made only in stocks matching all of the fundamental and technical criteria of the fact-based investment system. The Featured Stocks Page lists noteworthy high-ranked leaders.
The major averages fluctuated on the session after centrist Emmanuel Macron claimed victory in the French presidential election, defeating anti-EU opponent Marine Le Pen. While Macron was widely favored by investors, most of the gains embedded into the result seem to have already been priced in the markets. In Fed news, Cleveland President Loretta Mester stated that the central bank should continue its gradual path of raising interest rates to prevent the risk of overheating the U.S. economy.
Seven of 11 sectors in the S&P 500 ended in negative territory. Materials underperformed with LyondellBasell Industries (LYB -4.02%) down after being the subject of negative analyst commentary. In earnings, Tyson Foods (TSN -6.08%) down after quarterly profit came in below Street forecasts. Newell Brands (NWL +11.94%) rose as the household products maker reported better-than-expected quarterly results. On the M&A front, Kate Spade (KATE +8.31%) rose after agreeing to a $2.4 billion takeover bid from Coach (COH +4.81%). Charter Communications (CHTR -3.28%) fell after announcing a new operational agreement with Comcast (CMCSA +0.49%) on wireless communications plans.
Treasuries declined with the benchmark 10-year note down 9/32 to yield 2.38%. In commodities, NYMEX WTI crude added 0.4% to $46.42/barrel. In FOREX, the Dollar Index gained 0.4%. |
 Kenneth J. Gruneisen started out as a licensed stockbroker in August 1987, a couple of months prior to the historic stock market crash that took the Dow Jones Industrial Average down -22.6% in a single day. He has published daily fact-based fundamental and technical analysis on high-ranked stocks online for two decades. Through FACTBASEDINVESTING.COM, Kenneth provides educational articles, news, market commentary, and other information regarding proven investment systems that work in good times and bad.
Comments contained in the body of this report are technical opinions only and are not necessarily those of Gruneisen Growth Corp. The material herein has been obtained from sources believed to be reliable and accurate, however, its accuracy and completeness cannot be guaranteed. Our firm, employees, and customers may effect transactions, including transactions contrary to any recommendation herein, or have positions in the securities mentioned herein or options with respect thereto. Any recommendation contained in this report may not be suitable for all investors and it is not to be deemed an offer or solicitation on our part with respect to the purchase or sale of any securities. |
|
 |
Bank and Retail Indexes Rose; Tech Sector Edged Lower
Kenneth J. Gruneisen - Passed the CAN SLIM® Master's Exam
The Retail Index ($RLX +0.64%) and the Bank Index ($BKX +0.32%) both posted small gains, meanwhile the Broker/Dealer Index ($XBD -0.07%) ended slightly in the red on Monday. Commodity-linked groups were mixed as the Gold & Silver index ($XAU +0.35%) and the Integrated Oil Index ($XOI +0.60%) rose but the Oil Services Index ($OSX -0.55%) edged lower. The tech sector had a negative bias, led lower by the Biotechnology Index ($BTK -2.68%) while the Networking Index ($NWX -0.24%) and the Semiconductor Index ($SOX -0.38%) both posted smaller losses. Charts courtesy www.stockcharts.com
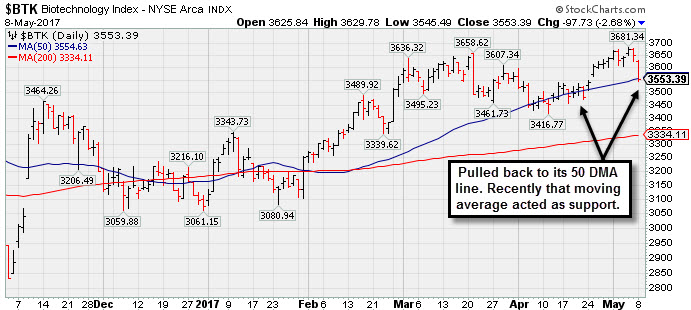 PICTURED: The Biotechnology Index ($BTK -2.68%) pulled back to its 50-day moving average (DMA) line. Recently that important moving average line acted as a support level.
| Oil Services |
$OSX |
150.82 |
-0.83 |
-0.55% |
-17.94% |
| Integrated Oil |
$XOI |
1,154.19 |
+6.93 |
+0.60% |
-8.97% |
| Semiconductor |
$SOX |
1,007.16 |
-3.87 |
-0.38% |
+11.11% |
| Networking |
$NWX |
445.35 |
-1.07 |
-0.24% |
-0.17% |
| Broker/Dealer |
$XBD |
216.81 |
-0.15 |
-0.07% |
+5.62% |
| Retail |
$RLX |
1,525.90 |
+9.71 |
+0.64% |
+13.62% |
| Gold & Silver |
$XAU |
80.56 |
+0.28 |
+0.35% |
+2.16% |
| Bank |
$BKX |
92.94 |
+0.29 |
+0.31% |
+1.25% |
| Biotech |
$BTK |
3,553.39 |
-97.73 |
-2.68% |
+15.56% |
|
|
|
 |
Bullish Technical Action Following Recent Earnings
Kenneth J. Gruneisen - Passed the CAN SLIM® Master's Exam
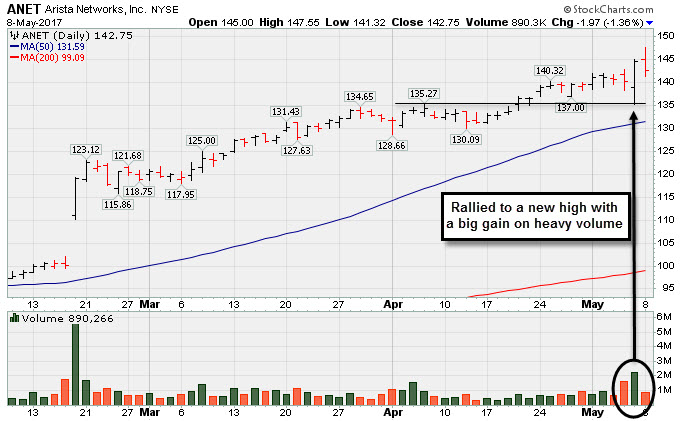
Arista Networks Inc (ANET -$1.97 or -1.36% to $142.75) pulled back today. On the prior session it rallied above its "max buy" level hitting a new all-time high with a big volume-driven gain. The gain followed the recently reported quarter as its Mar '17 earnings rose +37% on +39% sales revenues versus the year ago period. ANET has shown strong and steady increases in quarterly sales revenues while earnings have routinely been well above the +25% minimum guideline (C criteria). Its annual earnings (A criteria) growth has been strong, however, its history is limited since its $43 IPO in June of 2014.
Disciplined investors avoid chasing extended stocks. It was last shown in this FSU section on 4/05/17 with an annotated graph under the headline, "Extended From Any Sound Base After a Considerable Rally ". ANET is up +52.18% since first highlighted at $93.80 in yellow with pivot point cited based on its 2015 high plus 10 cents in the 11/21/16 mid-day report (read here). Along the way, a damaging loss on 1/17/17 with heavy volume raised concerns and triggered a technical sell signal. It halted its slide near prior highs in the $87 area and eventually rebounded above its 50 DMA line helping its outlook to improve.
The number of top-rated funds owning its shares rose from 360 in Dec '15 to 461 Mar '17, a reassuring sign concerning the I criteria. The high-ranked Computer - Networking firm has a Timeliness Rating of A and a Sponsorship Rating of B. Its small supply of 44.6 million shares (S criteria) in the public float may contribute to greater volatility in the event of institutional buying or selling.
|
|
|
Color Codes Explained :
Y - Better candidates highlighted by our
staff of experts.
G - Previously featured
in past reports as yellow but may no longer be buyable under the
guidelines.
***Last / Change / Volume data in this table is the closing quote data***
Symbol/Exchange
Company Name
Industry Group |
PRICE |
CHANGE
(%Change) |
Day High |
Volume
(% DAV)
(% 50 day avg vol) |
52 Wk Hi
% From Hi |
Featured
Date |
Price
Featured |
Pivot Featured |
|
Max Buy |
SBCF
-
NASDAQ
Seacoast Banking Corp Fl
BANKING - Regional - Mid-Atlantic Banks
|
$24.25
|
+0.16
0.66% |
$24.38
|
107,286
29.47% of 50 DAV
50 DAV is 364,000
|
$25.88
-6.30%
|
4/24/2017
|
$25.33
|
PP = $24.38
|
|
MB = $25.60
|
Most Recent Note - 5/2/2017 6:51:31 PM
Y - Pulled back today with light volume, closing just above its 50 DMA line. Recent gains above the pivot point lacked the above average volume needed to trigger a proper new (or add-on) technical buy signal. The 50 DMA line ($23.80) and recent low ($21.89 on 3/22/17) define support where violations would raise more serious concerns and trigger worrisome technical sell signals.
>>> FEATURED STOCK ARTICLE : Pullback Following Recent Gains With Unimpressive Volume - 4/27/2017 |
View all notes |
Set NEW NOTE alert |
Company Profile |
SEC
News |
Chart |
Request a new note
C
A
S
I |
CSFL
-
NASDAQ
Centerstate Banks Inc
Banks-Southeast
|
$25.46
|
-0.15
-0.59% |
$25.65
|
151,604
46.94% of 50 DAV
50 DAV is 323,000
|
$26.94
-5.48%
|
3/13/2017
|
$25.54
|
PP = $26.40
|
|
MB = $27.72
|
Most Recent Note - 5/2/2017 6:52:37 PM
Y - Consolidating near its 50 DMA line ($25.25). Reported earnings +10% on +13% sales revenues for the Mar '17 quarter, below the +25% minimum earnings guideline. Damaging losses below its recent low ($23.64 on 4/17/17) would raise more serious concerns.
>>> FEATURED STOCK ARTICLE : Positive Reversal After Intra-day Low Undercut Prior Lows - 4/17/2017 |
View all notes |
Set NEW NOTE alert |
Company Profile |
SEC
News |
Chart |
Request a new note
C
A
S
I |
HTHT
-
NASDAQ
China Lodging Group Ads
LEISURE - Lodging
|
$74.22
|
+5.10
7.38% |
$74.35
|
213,698
129.51% of 50 DAV
50 DAV is 165,000
|
$72.85
1.87%
|
9/29/2016
|
$46.12
|
PP = $47.82
|
|
MB = $50.21
|
Most Recent Note - 5/4/2017 11:47:08 AM
G - Retreating from its all-time high. Prior highs in the $64 area and its 50 DMA line ($62.19) define near term support to watch. Repeatedly noted with caution - "The 2 latest quarterly comparisons (Sep and Dec '16) were below the +25% minimum earnings guideline (C criteria), and its waning sales revenues growth rate was also noted recently as a fundamental concern.
>>> FEATURED STOCK ARTICLE : Support Shown Promptly After 50-Day Moving Average Violation - 4/19/2017 |
View all notes |
Set NEW NOTE alert |
Company Profile |
SEC
News |
Chart |
Request a new note
C
A
S
I |
BEAT
-
NASDAQ
BioTelemetry Inc
Medical-Services
|
$28.75
|
+0.40
1.41% |
$29.30
|
766,031
150.79% of 50 DAV
50 DAV is 508,000
|
$34.00
-15.44%
|
2/14/2017
|
$25.10
|
PP = $24.55
|
|
MB = $25.78
|
Most Recent Note - 5/4/2017 11:45:21 AM
G - Down considerably today with a loss on heavy volume undercutting its 50 DMA line ($28.66). Reported earnings -20% on +15% sales revenues for the Mar '17 quarter versus the year ago period, raising fundamental concerns. Volume and volatility often increase near earnings news.
>>> FEATURED STOCK ARTICLE : Extended From Sound Base and Earnings Below +25% Guideline - 5/3/2017 |
View all notes |
Set NEW NOTE alert |
Company Profile |
SEC
News |
Chart |
Request a new note
C
A
S
I |
ULTA
-
NASDAQ
Ulta Beauty Inc
SPECIALTY RETAIL - Specialty Retail, Other
|
$297.54
|
+2.07
0.70% |
$298.13
|
532,904
81.99% of 50 DAV
50 DAV is 650,000
|
$296.17
0.46%
|
5/5/2017
|
$293.17
|
PP = $289.37
|
|
MB = $303.84
|
Most Recent Note - 5/5/2017 1:23:19 PM
Y - Color code is changed to yellow with new pivot point cited based on its 3/17/17 high plus 10 cents. Wedging into new high territory with recent gains lacking great volume conviction. Its current Relative Strength rank is 79, just below the 80+ guideline for buy candidates. Recent lows near the $276 area define important support where more damaging losses would raise concerns and trigger technical sell signals.
>>> FEATURED STOCK ARTICLE : Volume Totals Cooling Following Technical Breakout - 4/7/2017 |
View all notes |
Set NEW NOTE alert |
Company Profile |
SEC
News |
Chart |
Request a new note
C
A
S
I |
Symbol/Exchange
Company Name
Industry Group |
PRICE |
CHANGE
(%Change) |
Day High |
Volume
(% DAV)
(% 50 day avg vol) |
52 Wk Hi
% From Hi |
Featured
Date |
Price
Featured |
Pivot Featured |
|
Max Buy |
ESNT
-
NYSE
Essent Group Ltd
Finance-MrtgandRel Svc
|
$34.76
|
-1.17
-3.26% |
$36.25
|
1,139,010
170.26% of 50 DAV
50 DAV is 669,000
|
$39.50
-12.00%
|
4/4/2017
|
$36.38
|
PP = $36.81
|
|
MB = $38.65
|
Most Recent Note - 5/5/2017 1:08:32 PM
G - Color code is changed to green as today's volume-driven loss violated its 50 DMA line ($36.27) and tested recent lows triggering technical sell signals. Only a prompt rebound above the 50 DMA line would help its outlook improve.
>>> FEATURED STOCK ARTICLE : Quiet Volume Behind Gain for New High Close - 4/10/2017 |
View all notes |
Set NEW NOTE alert |
Company Profile |
SEC
News |
Chart |
Request a new note
C
A
S
I |
VEEV
-
NYSE
Veeva Systems Inc Cl A
Computer Sftwr-Medical
|
$55.24
|
+0.85
1.56% |
$55.48
|
1,055,648
78.25% of 50 DAV
50 DAV is 1,349,000
|
$54.78
0.84%
|
3/16/2017
|
$49.00
|
PP = $48.05
|
|
MB = $50.45
|
 Most Recent Note - 5/8/2017 8:59:35 PM
G - Hit another new all-time high with today's 4th consecutive gain. Extended from any sound base. Its 50 DMA line ($49.82) defines support above prior highs in the $47-48 area.
>>> FEATURED STOCK ARTICLE : Hovering Near High, Stubbornly Holding its Ground - 4/18/2017 |
View all notes |
Set NEW NOTE alert |
Company Profile |
SEC
News |
Chart |
Request a new note
C
A
S
I |
ANET
-
NYSE
Arista Networks Inc
TELECOMMUNICATIONS - Communication Equipment
|
$142.75
|
-1.97
-1.36% |
$147.55
|
890,266
113.70% of 50 DAV
50 DAV is 783,000
|
$144.94
-1.51%
|
4/17/2017
|
$132.75
|
PP = $135.27
|
|
MB = $142.03
|
Most Recent Note - 5/8/2017 8:51:02 PM
G - Pulled back after hitting a new all-time high with a considerable volume-driven gain. See the latest FSU for more details and a new annotated graph.
>>> FEATURED STOCK ARTICLE : Bullish Technical Action Following Recent Earnings - 5/8/2017 |
View all notes |
Set NEW NOTE alert |
Company Profile |
SEC
News |
Chart |
Request a new note
C
A
S
I |
GRUB
-
NYSE
Grubhub Inc
COMPUTER SOFTWARE and SERVICES - Technical and System Software
|
$45.30
|
-0.42
-0.92% |
$46.84
|
1,663,439
65.16% of 50 DAV
50 DAV is 2,553,000
|
$45.91
-1.33%
|
4/28/2017
|
$44.22
|
PP = $44.68
|
|
MB = $46.91
|
Most Recent Note - 5/8/2017 10:19:47 AM
Y - Hitting a new 52-week high with today's 4th consecutive gain. A gain backed by at least +40% above average volume and strong close above the pivot point may clinch a technical buy signal.
>>> FEATURED STOCK ARTICLE : Hit New 52-Week High But Ended Near Session Low - 4/28/2017 |
View all notes |
Set NEW NOTE alert |
Company Profile |
SEC
News |
Chart |
Request a new note
C
A
S
I |
IBP
-
NYSE
Installed Building Prod
DIVERSIFIED SERVICES - Business/Management Services
|
$48.05
|
-4.15
-7.95% |
$52.60
|
476,681
296.08% of 50 DAV
50 DAV is 161,000
|
$55.45
-13.35%
|
4/17/2017
|
$51.75
|
PP = $53.10
|
|
MB = $55.76
|
Most Recent Note - 5/8/2017 12:36:41 PM
G - Slumping below its 50-day moving average (DMA) line ($51.36) with today's big loss on higher volume raising concerns. Reported earnings +35% on +33% sales revenues for the Mar '17 quarter, above the +25% minimum guideline (C criteria). Volume and volatility often increase near earnings news. See the latest FSU analysis for more details and an annotated graph.
>>> FEATURED STOCK ARTICLE : Due to Report Earnings Prior to Friday's Open - 5/4/2017 |
View all notes |
Set NEW NOTE alert |
Company Profile |
SEC
News |
Chart |
Request a new note
C
A
S
I |
Symbol/Exchange
Company Name
Industry Group |
PRICE |
CHANGE
(%Change) |
Day High |
Volume
(% DAV)
(% 50 day avg vol) |
52 Wk Hi
% From Hi |
Featured
Date |
Price
Featured |
Pivot Featured |
|
Max Buy |
NCOM
-
NASDAQ
National Commerce Corp
BANKING - Regional - Southeast Banks
|
$39.25
|
+0.05
0.13% |
$39.40
|
23,128
72.28% of 50 DAV
50 DAV is 32,000
|
$40.00
-1.88%
|
4/25/2017
|
$38.95
|
PP = $40.09
|
|
MB = $42.09
|
Most Recent Note - 5/8/2017 10:15:36 AM
Y - Volume totals have been cooling while consolidating within close striking distance of its 52-week high. A gain above the pivot point backed by a minimum of +40% above average volume may trigger a technical buy signal.
>>> FEATURED STOCK ARTICLE : Challenging 52-Week High With Volume-Driven Gains - 4/26/2017 |
View all notes |
Set NEW NOTE alert |
Company Profile |
SEC
News |
Chart |
Request a new note
C
A
S
I |
INGN
-
NASDAQ
Inogen Inc
HEALTH SERVICES - Medical Instruments and Supplies
|
$84.21
|
+0.69
0.83% |
$84.46
|
205,699
112.40% of 50 DAV
50 DAV is 183,000
|
$85.94
-2.01%
|
4/17/2017
|
$76.77
|
PP = $80.04
|
|
MB = $84.04
|
Most Recent Note - 5/8/2017 10:13:12 AM
Y - Color code is changed to yellow while consolidating near its all-time high and just below its "max buy" level. Due to report Mar '17 earnings news after the close on Tuesday, May 9th. Volume and volatility often increase near earnings news. Recent gains above the pivot point lacked the minimum +40% above average volume needed to trigger a proper new (or add-on) technical buy signal. Prior highs in the $79 area define support above its 50 DMA line ($76.76).
>>> FEATURED STOCK ARTICLE : Wedging Higher With Recent Gains Lacking Great Volume - 5/1/2017 |
View all notes |
Set NEW NOTE alert |
Company Profile |
SEC
News |
Chart |
Request a new note
C
A
S
I |
PLAY
-
NASDAQ
Dave & Buster's Ent Inc
Retail-Restaurants
|
$65.90
|
-0.38
-0.57% |
$66.39
|
412,205
52.31% of 50 DAV
50 DAV is 788,000
|
$66.36
-0.69%
|
2/23/2017
|
$55.41
|
PP = $58.35
|
|
MB = $61.27
|
Most Recent Note - 5/8/2017 8:56:54 PM
G - Quietly perched at its all-time high. Its 50 DMA line ($60.72) defines near-term support to watch on pullbacks. Latest quarter was below the +25% minimum guideline (C criteria), raising fundamental concerns.
>>> FEATURED STOCK ARTICLE : New Record High With Solid Gain on Near Average Volume - 5/2/2017 |
View all notes |
Set NEW NOTE alert |
Company Profile |
SEC
News |
Chart |
Request a new note
C
A
S
I |
OLLI
-
NASDAQ
Ollie's Bargain Outlet
Retail-DiscountandVariety
|
$40.10
|
-0.90
-2.20% |
$41.30
|
752,172
124.12% of 50 DAV
50 DAV is 606,000
|
$41.00
-2.20%
|
3/27/2017
|
$32.80
|
PP = $33.55
|
|
MB = $35.23
|
Most Recent Note - 5/5/2017 6:07:33 PM
G - Finished at the session high and hit yet another new high with today's volume-driven gain. Getting very extended from any sound base. Bullish action has continued since reporting earnings +22% on +16% sales revenues for the Jan '17 quarter, below the +25% minimum earnings guideline (C criteria). Its 50 DMA line and prior highs in the $33 area define near-term support.
>>> FEATURED STOCK ARTICLE : Winning Streak Continues for Discount Retailer - 4/24/2017 |
View all notes |
Set NEW NOTE alert |
Company Profile |
SEC
News |
Chart |
Request a new note
C
A
S
I |
MOMO
-
NASDAQ
Momo Inc Ads Cl A
INTERNET - Content
|
$38.58
|
-0.55
-1.39% |
$39.49
|
2,628,778
49.48% of 50 DAV
50 DAV is 5,313,000
|
$40.43
-4.59%
|
3/7/2017
|
$29.71
|
PP = $27.83
|
|
MB = $29.22
|
Most Recent Note - 5/3/2017 6:04:20 PM
G - Pulled back from its all-time high with today's loss on below average volume. Its 50 DMA line ($33.77) defines important near-term support to watch.
>>> FEATURED STOCK ARTICLE : Extended From Prior Base and Perched Near High - 4/6/2017 |
View all notes |
Set NEW NOTE alert |
Company Profile |
SEC
News |
Chart |
Request a new note
C
A
S
I |
Symbol/Exchange
Company Name
Industry Group |
PRICE |
CHANGE
(%Change) |
Day High |
Volume
(% DAV)
(% 50 day avg vol) |
52 Wk Hi
% From Hi |
Featured
Date |
Price
Featured |
Pivot Featured |
|
Max Buy |
|
|
|
THESE ARE NOT BUY RECOMMENDATIONS!
Comments contained in the body of this report are technical
opinions only. The material herein has been obtained
from sources believed to be reliable and accurate, however,
its accuracy and completeness cannot be guaranteed.
This site is not an investment advisor, hence it does
not endorse or recommend any securities or other investments.
Any recommendation contained in this report may not
be suitable for all investors and it is not to be deemed
an offer or solicitation on our part with respect to
the purchase or sale of any securities. All trademarks,
service marks and trade names appearing in this report
are the property of their respective owners, and are
likewise used for identification purposes only.
This report is a service available
only to active Paid Premium Members.
You may opt-out of receiving report notifications
at any time. Questions or comments may be submitted
by writing to Premium Membership Services 665 S.E. 10 Street, Suite 201 Deerfield Beach, FL 33441-5634 or by calling 1-800-965-8307
or 954-785-1121.
|
|
|