Symbol/Exchange
Company Name
Industry Group |
PRICE |
CHANGE
(%Change) |
Day High |
Volume
(% DAV)
(% 50 day avg vol) |
52 Wk Hi
% From Hi |
Featured
Date |
Price
Featured |
Pivot Featured |
|
Max Buy |
SBCF
-
NASDAQ
Seacoast Banking Corp Fl
BANKING - Regional - Mid-Atlantic Banks
|
$23.50
|
-0.07
-0.30% |
$23.57
|
299,979
73.34% of 50 DAV
50 DAV is 409,000
|
$25.13
-6.49%
|
2/13/2017
|
$24.84
|
PP = $23.10
|
|
MB = $24.26
|
 Most Recent Note - 3/20/2017 4:50:04 PM
Y - Still stubbornly holding its ground above its pivot point. Prior highs and its 50 DMA line in the $23 area define important near-term support to watch.
>>> FEATURED STOCK ARTICLE : Gap Up Gain and Strong Finish Triggered Technical Buy Signal - 2/13/2017 |
View all notes |
Set NEW NOTE alert |
Company Profile |
SEC
News |
Chart |
Request a new note
C
A
S
I |
CSFL
-
NASDAQ
Centerstate Banks Inc
Banks-Southeast
|
$26.42
|
-0.06
-0.23% |
$26.94
|
269,904
86.51% of 50 DAV
50 DAV is 312,000
|
$26.62
-0.75%
|
3/13/2017
|
$25.54
|
PP = $26.40
|
|
MB = $27.72
|
Most Recent Note - 3/17/2017 5:11:14 PM
Y - Clinched a technical buy signal with heavy volume behind today's volume-driven gain as it rose and closed above the new pivot point cited based on its 1/26/17 high plus 10 cents. Its 50 DMA line ($25) and recent low ($23.80 on 2/08/17) define important near-term support where further deterioration would trigger a technical sell signal. Completed a new Public Offering of shares on 1/10/17. See the latest FSU analysis for more details and an annotated graph.
>>> FEATURED STOCK ARTICLE : Gain Backed By Volume For Best Ever Close - 3/15/2017 |
View all notes |
Set NEW NOTE alert |
Company Profile |
SEC
News |
Chart |
Request a new note
C
A
S
I |
IESC
-
NASDAQ
I E S Holdings Inc
Bldg-Maintenance and Svc
|
$19.35
|
-0.60
-3.01% |
$19.95
|
56,193
106.02% of 50 DAV
50 DAV is 53,000
|
$23.00
-15.87%
|
11/23/2016
|
$19.35
|
PP = $18.26
|
|
MB = $19.17
|
Most Recent Note - 3/20/2017 5:00:16 PM
G - Technically, it slumped with average volume today and closed back below its 50 DMA line ($19.44). Prior low ($18.05 on 1/18/17) defines important support near prior highs. Recently reported Dec '16 quarterly earnings -33% on +27% sales revenues, below the +25% minimum earnings guideline (C criteria), raising fundamental concerns.
>>> FEATURED STOCK ARTICLE : Recent Low Defines Support Near Prior Highs - 3/3/2017 |
View all notes |
Set NEW NOTE alert |
Company Profile |
SEC
News |
Chart |
Request a new note
C
A
S
I |
NSP
-
NYSE
Insperity Inc
Comml Svcs-Outsourcing
|
$89.00
|
-0.25
-0.28% |
$89.85
|
89,050
56.72% of 50 DAV
50 DAV is 157,000
|
$90.55
-1.71%
|
2/14/2017
|
$84.30
|
PP = $82.28
|
|
MB = $86.39
|
Most Recent Note - 3/17/2017 5:01:49 PM
G - Encountered distributional pressure today with a loss on above average volume. Wedged higher with gains in the past 2 weeks lacking volume conviction, getting extended from prior highs. The recent low ($79.97 on 2/24/17) defines important near-term support.
>>> FEATURED STOCK ARTICLE : Big Volume-Driven Gains Indicative of Institutional Demand - 2/14/2017 |
View all notes |
Set NEW NOTE alert |
Company Profile |
SEC
News |
Chart |
Request a new note
C
A
S
I |
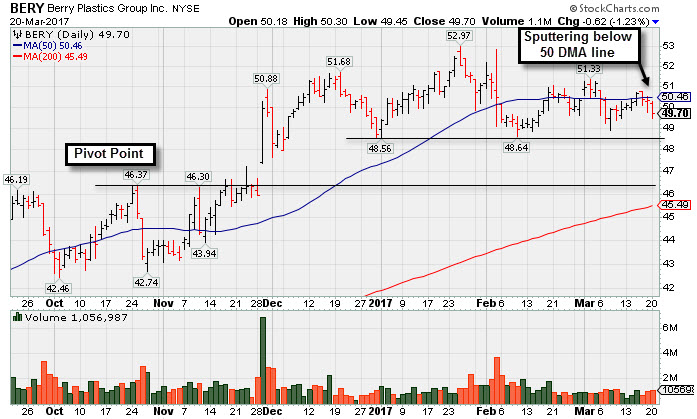
BERY
-
NYSE
Berry Plastics Group Inc
CONSUMER NON-DURABLES - Packaging and Containers
|
$49.70
|
-0.62
-1.23% |
$50.30
|
1,056,687
90.41% of 50 DAV
50 DAV is 1,168,800
|
$52.97
-6.17%
|
11/30/2016
|
$50.26
|
PP = $46.47
|
|
MB = $48.79
|
Most Recent Note - 3/20/2017 5:44:31 PM
G - Relative Strength Rating is 74, below the 80+ minimum for buy candidates under the fact-based investment system. Recently consolidating near its 50 DMA line ($50.46) while prior lows in the $48.50 area define important near-term support. Damaging losses and violations would trigger a more worrisome technical sell signal. Reported earnings +43% on -7% sales revenues for the Dec '16 quarter. See the latest FSU analysis for more details and a new annotated graph.
>>> FEATURED STOCK ARTICLE : Sputtering Below its 50-Day Moving Average - 3/20/2017 |
View all notes |
Set NEW NOTE alert |
Company Profile |
SEC
News |
Chart |
Request a new note
C
A
S
I |
Symbol/Exchange
Company Name
Industry Group |
PRICE |
CHANGE
(%Change) |
Day High |
Volume
(% DAV)
(% 50 day avg vol) |
52 Wk Hi
% From Hi |
Featured
Date |
Price
Featured |
Pivot Featured |
|
Max Buy |
EVR
-
NYSE
Evercore Partners Inc
FINANCIAL SERVICES - Investment Banking
|
$80.60
|
-1.30
-1.59% |
$82.15
|
453,254
102.31% of 50 DAV
50 DAV is 443,000
|
$83.30
-3.24%
|
1/5/2017
|
$71.40
|
PP = $72.07
|
|
MB = $75.67
|
Most Recent Note - 3/20/2017 4:44:52 PM
G - Repeatedly noted as extended from its prior base. Its 50 DMA line ($78.14) and prior low ($74.75 on 2/08/17) define near-term support to watch. Recently reported Dec '16 quarterly earnings +17% on +9% sales revenues, below the +25% minimum earnings guideline (C criteria), raising fundamental concerns.
>>> FEATURED STOCK ARTICLE : Holding Ground After Latest Earnings Were Below +25% Guideline - 2/17/2017 |
View all notes |
Set NEW NOTE alert |
Company Profile |
SEC
News |
Chart |
Request a new note
C
A
S
I |
NTES
-
NASDAQ
Netease Inc Adr
INTERNET - Internet Information Providers
|
$294.34
|
+2.84
0.97% |
$296.75
|
1,292,197
111.30% of 50 DAV
50 DAV is 1,161,000
|
$308.66
-4.64%
|
2/10/2017
|
$259.30
|
PP = $272.68
|
|
MB = $286.31
|
Most Recent Note - 3/20/2017 4:49:15 PM
G - Perched within close striking distance of all-time highs while consolidating in a tight range following a big "breakaway gap" on 2/16/17. Prior highs in the $272 area define initial support to watch along with its 50 DMA line.
>>> FEATURED STOCK ARTICLE : Rebounding With Earnings News Due Soon - 2/10/2017 |
View all notes |
Set NEW NOTE alert |
Company Profile |
SEC
News |
Chart |
Request a new note
C
A
S
I |
STMP
-
NASDAQ
Stamps.com Inc
INTERNET - Internet Software and Services
|
$128.30
|
-0.50
-0.39% |
$129.68
|
187,117
72.53% of 50 DAV
50 DAV is 258,000
|
$136.00
-5.66%
|
2/16/2017
|
$129.45
|
PP = $123.85
|
|
MB = $130.04
|
Most Recent Note - 3/17/2017 5:36:09 PM
Y - Pulled back with above average volume today and its color code is changed to yellow after finishing below its "max buy" level again. Subsequent losses leading to deterioration below the 50 DMA line or recent low ($120.11 on 3/02/17) would trigger technical sell signals.
>>> FEATURED STOCK ARTICLE : Recent Gains Have Lacked Heavy Volume Indicative of Accumulation - 2/16/2017 |
View all notes |
Set NEW NOTE alert |
Company Profile |
SEC
News |
Chart |
Request a new note
C
A
S
I |
HTHT
-
NASDAQ
China Lodging Group Ads
LEISURE - Lodging
|
$61.58
|
+1.60
2.67% |
$62.00
|
241,051
182.61% of 50 DAV
50 DAV is 132,000
|
$63.87
-3.59%
|
9/29/2016
|
$46.12
|
PP = $47.82
|
|
MB = $50.21
|
Most Recent Note - 3/20/2017 12:57:23 PM
G - Perched near all-time highs following volume-driven gains last week, Previously noted with caution - "Reported earnings +0% on +4% sales revenues for the Dec '16 quarter versus the year ago period, marking a 2nd comparison below the +25% minimum earnings guideline (C criteria), and its waning sales revenues growth rate is also a concern." See the latest FSU analysis for more details and an annotated graph.
>>> FEATURED STOCK ARTICLE : Bullish Action Led to +54% Rally Since First Featured - 3/17/2017 |
View all notes |
Set NEW NOTE alert |
Company Profile |
SEC
News |
Chart |
Request a new note
C
A
S
I |
SIRI
-
NASDAQ
Sirius X M Holdings Inc
MEDIA - Broadcasting - Radio
|
$5.29
|
-0.07
-1.31% |
$5.37
|
13,418,130
56.34% of 50 DAV
50 DAV is 23,817,000
|
$5.53
-4.34%
|
3/13/2017
|
$5.48
|
PP = $5.32
|
|
MB = $5.59
|
Most Recent Note - 3/20/2017 4:58:05 PM
Y - Pulled back today with very light volume. Volume totals have been cooling since its powerful breakout. First highlighted in the 3/13/17 mid-day report (read here) in yellow with pivot point cited based on its 2/22/17 high plus 10 cents. Its prior high ($5.22 on 2/22/17) defines initial support to watch. Disciplined investors always limit losses by selling any stock that falls more than -7% from their purchase price.
>>> FEATURED STOCK ARTICLE : Breakout From Advanced Base Pattern Backed By Very Heavy Volume - 3/13/2017 |
View all notes |
Set NEW NOTE alert |
Company Profile |
SEC
News |
Chart |
Request a new note
C
A
S
I |
Symbol/Exchange
Company Name
Industry Group |
PRICE |
CHANGE
(%Change) |
Day High |
Volume
(% DAV)
(% 50 day avg vol) |
52 Wk Hi
% From Hi |
Featured
Date |
Price
Featured |
Pivot Featured |
|
Max Buy |
BEAT
-
NASDAQ
BioTelemetry Inc
Medical-Services
|
$27.20
|
-0.25
-0.91% |
$27.50
|
271,923
85.24% of 50 DAV
50 DAV is 319,000
|
$27.90
-2.51%
|
2/14/2017
|
$25.10
|
PP = $24.55
|
|
MB = $25.78
|
Most Recent Note - 3/20/2017 4:41:01 PM
G - Quietly held its ground today perched near its all-time high. Prior highs in the $24 area and its 50 DMA line ($24.38) define important near-term support.
>>> FEATURED STOCK ARTICLE : Perched Near All-Time High With Earnings Report Due - 2/21/2017 |
View all notes |
Set NEW NOTE alert |
Company Profile |
SEC
News |
Chart |
Request a new note
C
A
S
I |
ULTA
-
NASDAQ
Ulta Beauty Inc
SPECIALTY RETAIL - Specialty Retail, Other
|
$285.71
|
-3.10
-1.07% |
$288.98
|
646,216
93.25% of 50 DAV
50 DAV is 693,000
|
$289.27
-1.23%
|
3/6/2017
|
$274.96
|
PP = $278.73
|
|
MB = $292.67
|
Most Recent Note - 3/15/2017 8:37:07 PM
Y - Closed at a best-ever high with today's small gain on light volume. Its 50 DMA line ($271) defines near term support to watch on pullbacks. After highlighted in yellow in the 3/06/17 mid-day report a volume-driven gain for new highs on 3/10/17 triggered a new technical buy signal. Reported earnings +33% on +25% sales revenues for the Jan '17 quarter and prior earnings history satisfied the C and A criteria.
>>> FEATURED STOCK ARTICLE : Earnings News Due as Good Looking Candidate Hovers Near Highs - 3/6/2017 |
View all notes |
Set NEW NOTE alert |
Company Profile |
SEC
News |
Chart |
Request a new note
C
A
S
I |
ESNT
-
NYSE
Essent Group Ltd
Finance-MrtgandRel Svc
|
$35.48
|
-0.52
-1.44% |
$36.16
|
536,062
80.61% of 50 DAV
50 DAV is 665,000
|
$38.10
-6.88%
|
1/25/2017
|
$34.09
|
PP = $34.04
|
|
MB = $35.74
|
Most Recent Note - 3/20/2017 4:43:50 PM
Y - Color code is changed to yellow after a loss today on light volume closing below its "max buy" level. Its 50 DMA line ($34.72) and prior highs define important near-term support in the $33-34 area. Subsequent losses leading to violations may trigger technical sell signals.
>>> FEATURED STOCK ARTICLE : Consolidating Above Support Following Breakout - 3/10/2017 |
View all notes |
Set NEW NOTE alert |
Company Profile |
SEC
News |
Chart |
Request a new note
C
A
S
I |
VEEV
-
NYSE
Veeva Systems Inc Cl A
Computer Sftwr-Medical
|
$49.85
|
+0.06
0.12% |
$50.75
|
2,049,179
208.04% of 50 DAV
50 DAV is 985,000
|
$49.83
0.05%
|
3/16/2017
|
$49.00
|
PP = $48.05
|
|
MB = $50.45
|
Most Recent Note - 3/20/2017 1:19:01 PM
Y - Touched another new high today after 3 consecutive volume-driven gains for new highs. Highlighted in yellow in the 3/16/17 mid-day report and it triggered a technical buy signal with a gain above the pivot point backed by 3 times average volume. Prior highs in the $47-48 area define initial support to watch on pullbacks. See the latest FSU analysis for more details and an annotated graph.
>>> FEATURED STOCK ARTICLE : Breakout Gain for New Highs Backed by Three Times Average Volume - 3/16/2017 |
View all notes |
Set NEW NOTE alert |
Company Profile |
SEC
News |
Chart |
Request a new note
C
A
S
I |
ANET
-
NYSE
Arista Networks Inc
TELECOMMUNICATIONS - Communication Equipment
|
$130.33
|
+2.23
1.74% |
$131.43
|
715,163
80.18% of 50 DAV
50 DAV is 892,000
|
$128.93
1.09%
|
3/6/2017
|
$119.43
|
PP = $123.22
|
|
MB = $129.38
|
Most Recent Note - 3/20/2017 4:39:18 PM
G - Color code is changed to green after gapping up and rallying above its "max buy" level today for another new high. The session was marked by lighter than average volume, revealing a lack of institutional buying demand while it wedged up from the previously noted advanced "3-weeks tight" base pattern.
>>> FEATURED STOCK ARTICLE : Stubbornly Holding Ground After Breakaway Gap - 3/1/2017 |
View all notes |
Set NEW NOTE alert |
Company Profile |
SEC
News |
Chart |
Request a new note
C
A
S
I |
Symbol/Exchange
Company Name
Industry Group |
PRICE |
CHANGE
(%Change) |
Day High |
Volume
(% DAV)
(% 50 day avg vol) |
52 Wk Hi
% From Hi |
Featured
Date |
Price
Featured |
Pivot Featured |
|
Max Buy |
VBTX
-
NASDAQ
Veritex Holdings Inc
BANKING - Regional - Southwest Banks
|
$28.07
|
-0.18
-0.64% |
$28.49
|
45,229
52.59% of 50 DAV
50 DAV is 86,000
|
$29.43
-4.62%
|
1/23/2017
|
$27.30
|
PP = $27.87
|
|
MB = $29.26
|
Most Recent Note - 3/17/2017 5:05:26 PM
Y - Consolidating above its pivot point but below its "max buy" level. Posted a gain today with higher volume as prior highs in the $27 area and its 50 DMA line acted as important technical support.
>>> FEATURED STOCK ARTICLE : Hovering Near Highs But Latest Earnings Were Below Guidelines - 3/8/2017 |
View all notes |
Set NEW NOTE alert |
Company Profile |
SEC
News |
Chart |
Request a new note
C
A
S
I |
IBP
-
NYSE
Installed Building Prod
DIVERSIFIED SERVICES - Business/Management Services
|
$51.85
|
-0.60
-1.14% |
$52.70
|
115,297
72.51% of 50 DAV
50 DAV is 159,000
|
$52.60
-1.43%
|
2/27/2017
|
$44.83
|
PP = $44.40
|
|
MB = $46.62
|
Most Recent Note - 3/15/2017 8:29:48 PM
G - Hit another new high with today's gain on higher volume, getting very extended from its prior base. Stubbornly held its ground after an impressive streak of volume-driven gains. Prior highs in the $44 area define initial support to watch.
>>> FEATURED STOCK ARTICLE : Big Breakout Followed Solid Earnings News - 2/28/2017 |
View all notes |
Set NEW NOTE alert |
Company Profile |
SEC
News |
Chart |
Request a new note
C
A
S
I |
SFBS
-
NASDAQ
Servisfirst Bancshares
BANKING - Regional - Southeast Banks
|
$38.81
|
-0.45
-1.15% |
$39.44
|
279,476
137.67% of 50 DAV
50 DAV is 203,000
|
$42.66
-9.02%
|
7/19/2016
|
$26.64
|
PP = $26.41
|
|
MB = $27.73
|
Most Recent Note - 3/20/2017 4:52:34 PM
G - Slumped further below its 50 DMA line today, failing to rebound after a 3/17/17 loss on above average volume triggered a technical sell signal. Only a prompt rebound above the 50 DMA line $39.91) would help its outlook improve. Recently reported earnings +8% on +20% sales revenues for the Dec '16 quarter, below the +25% minimum guideline (C criteria), raising fundamental concerns.
>>> FEATURED STOCK ARTICLE : Perched Near All-Time High After Concerns Raised by Latest Earnings - 2/22/2017 |
View all notes |
Set NEW NOTE alert |
Company Profile |
SEC
News |
Chart |
Request a new note
C
A
S
I |
INGN
-
NASDAQ
Inogen Inc
HEALTH SERVICES - Medical Instruments and Supplies
|
$76.44
|
+0.31
0.41% |
$76.68
|
208,435
127.87% of 50 DAV
50 DAV is 163,000
|
$79.94
-4.38%
|
2/27/2017
|
$68.69
|
PP = $69.94
|
|
MB = $73.44
|
Most Recent Note - 3/20/2017 4:47:31 PM
G - Posted a small gain today with above average volume for yet another new high close. Its 50 DMA line and prior highs in the $69 area define important near-term support to watch.
>>> FEATURED STOCK ARTICLE : Formed Orderly Base With Earnings News Due After Tuesday's Close - 2/27/2017 |
View all notes |
Set NEW NOTE alert |
Company Profile |
SEC
News |
Chart |
Request a new note
C
A
S
I |
PLAY
-
NASDAQ
Dave & Buster's Ent Inc
Retail-Restaurants
|
$59.66
|
-0.27
-0.45% |
$60.56
|
390,735
64.16% of 50 DAV
50 DAV is 609,000
|
$61.20
-2.52%
|
2/23/2017
|
$55.41
|
PP = $58.35
|
|
MB = $61.27
|
Most Recent Note - 3/15/2017 8:38:46 PM
Y - Posted a solid volume-driven gain for a best-ever close today. Held its ground after a 2nd consecutive volume-driven gain on 3/10/17 triggered a technical buy signal. Its 50 DMA line ($56) has recently acted as a support level.
>>> FEATURED STOCK ARTICLE : Consolidating Near 50 DMA After Recent Gains Lacked Volume - 2/23/2017 |
View all notes |
Set NEW NOTE alert |
Company Profile |
SEC
News |
Chart |
Request a new note
C
A
S
I |
Symbol/Exchange
Company Name
Industry Group |
PRICE |
CHANGE
(%Change) |
Day High |
Volume
(% DAV)
(% 50 day avg vol) |
52 Wk Hi
% From Hi |
Featured
Date |
Price
Featured |
Pivot Featured |
|
Max Buy |
LITE
-
NASDAQ
Lumentum Holdings Inc
TELECOMMUNICATIONS - Cables / Satalite Equipment
|
$49.20
|
-0.25
-0.51% |
$49.75
|
1,273,952
77.87% of 50 DAV
50 DAV is 1,636,000
|
$53.70
-8.37%
|
2/8/2017
|
$44.60
|
PP = $44.80
|
|
MB = $47.04
|
Most Recent Note - 3/16/2017 12:57:45 PM
Y - Rebounding toward prior highs with a 2nd big gain today on heavier volume. Subsequent damaging losses below the 50 DMA line ($42.50) would trigger a more worrisome technical sell signal. See the latest FSU analysis for more details and an annotated graph.
>>> FEATURED STOCK ARTICLE : Support Elusive Following Prior Demand - 3/14/2017 |
View all notes |
Set NEW NOTE alert |
Company Profile |
SEC
News |
Chart |
Request a new note
C
A
S
I |
MOMO
-
NASDAQ
Momo Inc Ads Cl A
INTERNET - Content
|
$34.25
|
-0.76
-2.17% |
$35.76
|
5,818,203
174.35% of 50 DAV
50 DAV is 3,337,000
|
$35.73
-4.14%
|
3/7/2017
|
$29.71
|
PP = $27.83
|
|
MB = $29.22
|
Most Recent Note - 3/20/2017 1:07:14 PM
G - Pulling back today following a streak of gains with above average volume. It is still too extended from its prior base to be bought under the fact-based investment system's guidelines. Prior highs in the $27-28 area define initial support to watch on pullbacks.
>>> FEATURED STOCK ARTICLE : Breakaway Gap Followed Very Strong Earnings Report - 3/7/2017 |
View all notes |
Set NEW NOTE alert |
Company Profile |
SEC
News |
Chart |
Request a new note
C
A
S
I |