You are not logged in.
This means you
CAN ONLY VIEW reports that were published prior to Wednesday, March 26, 2025.
You
MUST UPGRADE YOUR MEMBERSHIP if you want to see any current reports.
AFTER MARKET UPDATE - TUESDAY, MAY 2ND, 2017
Previous After Market Report Next After Market Report >>>
|
|
|
|
DOW |
+36.43 |
20,949.89 |
+0.17% |
|
Volume |
1,070,363,320 |
+22% |
|
Volume |
1,956,809,630 |
+24% |
|
NASDAQ |
+3.77 |
6,095.37 |
+0.06% |
|
Advancers |
1,444 |
50% |
|
Advancers |
1,256 |
44% |
|
S&P 500 |
+2.84 |
2,391.17 |
+0.12% |
|
Decliners |
1,435 |
50% |
|
Decliners |
1,576 |
56% |
|
Russell 2000 |
-8.00 |
1,399.36 |
-0.57% |
|
52 Wk Highs |
180 |
|
|
52 Wk Highs |
202 |
|
|
S&P 600 |
-3.06 |
851.96 |
-0.36% |
|
52 Wk Lows |
31 |
|
|
52 Wk Lows |
52 |
|
|
 |
Leadership Remains Healthy as Major Indices Post Small Gains
Kenneth J. Gruneisen - Passed the CAN SLIM® Master's Exam
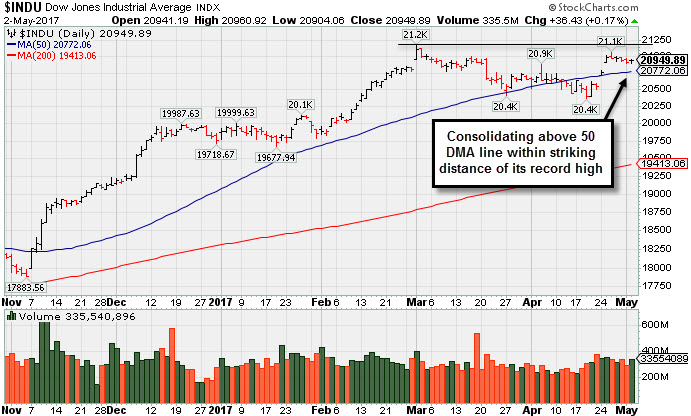
Stocks finished modestly higher on Tuesday. The Dow was up 36 points to 20949. The S&P 500 added 2 points to 2391 and the Nasdaq Composite gained 3 points to 6095. The volume totals reported were higher than the prior session totals on the NYSE and on the Nasdaq exchange. Advancers and decliners were evenly mixed on the NYSE while decliners led advancers by nearly 4-3 on the Nasdaq exchange. There were 72 high-ranked companies from the Leaders List that made new 52-week highs and were listed on the BreakOuts Page, versus the total of 61 on the prior session. New 52-week highs totals improved slightly and solidly outnumbered new 52-week lows on the NYSE and on the Nasdaq exchange. PICTURED: The Dow Jones Industrial Average is consolidating above its 50-day moving average (DMA) line, perched within striking distance of its record high.
The major averages' (M criteria) are in a confirmed uptrend, and there has been a reassuring expansion in leadership (number of high-ranked stocks hitting new highs). New buying efforts should be made only in stocks matching all of the fundamental and technical criteria of the fact-based investment system. The Featured Stocks Page lists noteworthy high-ranked leaders.
The major averages advanced as the Federal Reserve began its two-day May policy meeting. The central bank is largely expected to leave interest rates unchanged at the conclusion of the meeting on Wednesday. According to Bloomberg data, futures are currently pricing a 14% probability of a rate hike. Investors will key in on Janet Yellen’s remarks Wednesday regarding an update on the Fed’s plan to unwind its massive $4.5 trillion balance sheet.
Seven of 11 sectors in the S&P 500 ended in positive territory. Health Care stocks fluctuated with Aetna (AET +1.56%) rising. Pfizer (PFE -0.50%) edged lower as quarterly revenue fell short of Street forecasts. In the consumer space, CVS Health (CVS -3.61%) fell as profit dropped from a year earlier on fewer filled prescriptions. Coach (COH +11.38%) rallied after the handbag maker posted better-than-expected quarterly profit. Elsewhere in earnings, Hilton Worldwide (HLT +3.66%) rose as the hotel operator raised its full-year EPS guidance. Charter Communications (CHTR -1.87%) fell after losing more TV subscribers in the quarter than anticipated.
Treasuries advanced with the benchmark 10-year note up 8/32 to yield 2.29%. In commodities, NYMEX WTI crude retreated 2.5% to $47.61/barrel. In FOREX, the Dollar Index fell 0.1%. |
 Kenneth J. Gruneisen started out as a licensed stockbroker in August 1987, a couple of months prior to the historic stock market crash that took the Dow Jones Industrial Average down -22.6% in a single day. He has published daily fact-based fundamental and technical analysis on high-ranked stocks online for two decades. Through FACTBASEDINVESTING.COM, Kenneth provides educational articles, news, market commentary, and other information regarding proven investment systems that work in good times and bad.
Comments contained in the body of this report are technical opinions only and are not necessarily those of Gruneisen Growth Corp. The material herein has been obtained from sources believed to be reliable and accurate, however, its accuracy and completeness cannot be guaranteed. Our firm, employees, and customers may effect transactions, including transactions contrary to any recommendation herein, or have positions in the securities mentioned herein or options with respect thereto. Any recommendation contained in this report may not be suitable for all investors and it is not to be deemed an offer or solicitation on our part with respect to the purchase or sale of any securities. |
|
 |
Retail Index Posted Standout Gain
Kenneth J. Gruneisen - Passed the CAN SLIM® Master's Exam
The Retail Index ($RLX +0.59%) posted a modest gain, helping to boost the major averages. The Bank Index ($BKX -0.35%) edged lower while the Broker/Dealer Index ($XBD +0.13%) eked out a small gain on Tuesday. The tech sector was led lower by the Semiconductor Index ($SOX -1.06%) and the Biotechnology Index ($BTK -0.99%) while the Networking Index ($NWX -0.27) suffered a smaller loss. Commodity-linked groups were mixed as the Oil Services Index ($OSX -1.20%) and Integrated Oil Index ($XOI -0.46%) fell, meanwhile, the Gold & Silver index ($XAU +0.60%) posted a small gain. Charts courtesy www.stockcharts.com
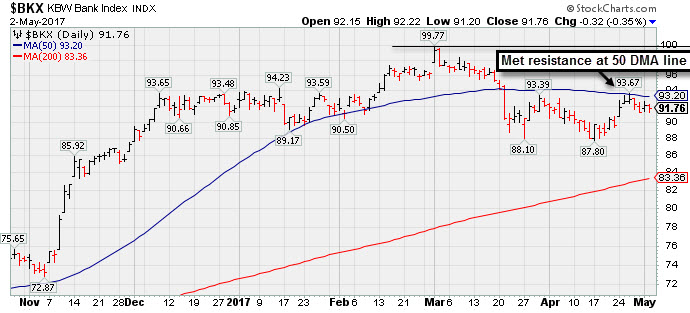 PICTURED: The Bank Index ($BKX -0.35%) met resistance at its 50-day moving average (DMA) line when rebounding after recently undercutting the March lows. Gains above the 50 DMA line for this index would bode well for the broader market outlook, since the financial groups have been reliable leading indicators.
| Oil Services |
$OSX |
148.97 |
-1.81 |
-1.20% |
-18.95% |
| Integrated Oil |
$XOI |
1,147.15 |
-5.26 |
-0.46% |
-9.53% |
| Semiconductor |
$SOX |
1,004.62 |
-10.81 |
-1.06% |
+10.83% |
| Networking |
$NWX |
451.29 |
-1.23 |
-0.27% |
+1.16% |
| Broker/Dealer |
$XBD |
217.14 |
+0.29 |
+0.13% |
+5.78% |
| Retail |
$RLX |
1,516.38 |
+8.96 |
+0.59% |
+12.91% |
| Gold & Silver |
$XAU |
81.26 |
+0.49 |
+0.61% |
+3.04% |
| Bank |
$BKX |
91.76 |
-0.32 |
-0.35% |
-0.03% |
| Biotech |
$BTK |
3,631.05 |
-36.31 |
-0.99% |
+18.08% |
|
|
|
 |
New Record High With Solid Gain on Near Average Volume
Kenneth J. Gruneisen - Passed the CAN SLIM® Master's Exam
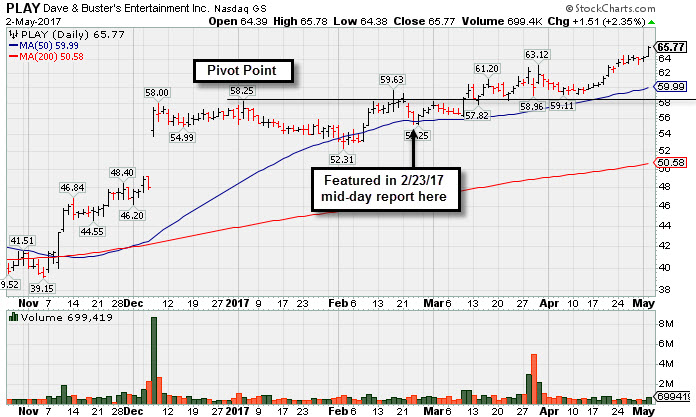
Dave & Buster's Ent Inc (PLAY +$1.51 or +2.35% to $65.77) finished a penny off the session high today with a big gain backed by near average volume. It recently reported earnings +19% on +15% sales revenues for the Jan '17 quarter, below the +25% minimum guideline (C criteria), raising fundamental concerns. Its 50-day moving average (DMA) line defines a near-term support level. Subsequent losses leading to a violation of the 50 DMA line ($59.99) would raise concerns and trigger a technical sell signal.
Disciplined followers of the fact-based investment system know that buying efforts should only be made in fundamentally superior stocks and only after after a technical buy signal has been triggered. Selling should not be based upon a change fundamentals, but should strictly be based upon the technical action in a stock or market. Therefore, some investors may still be electing to give it the benefit of the doubt until any worrisome technical sell signals raise concerns.
The Retail - Restaurant firm was last shown in this FSU section on 3/29/17 with an annotated graph under the headline, "Retreated From All-Time High Following Earnings Report". The number of top-rated funds owning its shares rose from 310 in Mar '16 to 393 in Mar '17, a reassuring sign concerning the I criteria. Its small supply of only 42 million shares outstanding (S criteria) can contribute to greater price volatility in the event of institutional buying ore selling. Its annual earnings history (A criteria) has been strong. Currently it has an A Timeliness Rating and a B Sponsorship Rating. Following its $16 IPO on 10/10/14 it completed Secondary Offerings on 2/05/15, 5/27/15, and 10/01/15.
|
|
|
Color Codes Explained :
Y - Better candidates highlighted by our
staff of experts.
G - Previously featured
in past reports as yellow but may no longer be buyable under the
guidelines.
***Last / Change / Volume data in this table is the closing quote data***
Symbol/Exchange
Company Name
Industry Group |
PRICE |
CHANGE
(%Change) |
Day High |
Volume
(% DAV)
(% 50 day avg vol) |
52 Wk Hi
% From Hi |
Featured
Date |
Price
Featured |
Pivot Featured |
|
Max Buy |
SBCF
-
NASDAQ
Seacoast Banking Corp Fl
BANKING - Regional - Mid-Atlantic Banks
|
$23.97
|
-0.23
-0.95% |
$24.30
|
200,882
43.96% of 50 DAV
50 DAV is 457,000
|
$25.88
-7.38%
|
4/24/2017
|
$25.33
|
PP = $24.38
|
|
MB = $25.60
|
 Most Recent Note - 5/2/2017 6:51:31 PM
Y - Pulled back today with light volume, closing just above its 50 DMA line. Recent gains above the pivot point lacked the above average volume needed to trigger a proper new (or add-on) technical buy signal. The 50 DMA line ($23.80) and recent low ($21.89 on 3/22/17) define support where violations would raise more serious concerns and trigger worrisome technical sell signals.
>>> FEATURED STOCK ARTICLE : Pullback Following Recent Gains With Unimpressive Volume - 4/27/2017 |
View all notes |
Set NEW NOTE alert |
Company Profile |
SEC
News |
Chart |
Request a new note
C
A
S
I |
CSFL
-
NASDAQ
Centerstate Banks Inc
Banks-Southeast
|
$25.29
|
-0.10
-0.39% |
$25.77
|
193,710
62.09% of 50 DAV
50 DAV is 312,000
|
$26.94
-6.12%
|
3/13/2017
|
$25.54
|
PP = $26.40
|
|
MB = $27.72
|
Most Recent Note - 5/2/2017 6:52:37 PM
Y - Consolidating near its 50 DMA line ($25.25). Reported earnings +10% on +13% sales revenues for the Mar '17 quarter, below the +25% minimum earnings guideline. Damaging losses below its recent low ($23.64 on 4/17/17) would raise more serious concerns.
>>> FEATURED STOCK ARTICLE : Positive Reversal After Intra-day Low Undercut Prior Lows - 4/17/2017 |
View all notes |
Set NEW NOTE alert |
Company Profile |
SEC
News |
Chart |
Request a new note
C
A
S
I |
NSP
-
NYSE
Insperity Inc
Comml Svcs-Outsourcing
|
$87.10
|
+0.50
0.58% |
$92.85
|
354,685
253.35% of 50 DAV
50 DAV is 140,000
|
$93.65
-6.99%
|
4/21/2017
|
$88.65
|
PP = $90.65
|
|
MB = $95.18
|
Most Recent Note - 5/2/2017 1:52:38 PM
G - Violated its 50 DMA line on the prior session then found prompt support and rebounded above that important short-term average. Reported earnings +13% on +10% sales revenues for the Mar '17 quarter, below the +25% minimum guideline (C criteria), raising fundamental concerns.
>>> FEATURED STOCK ARTICLE : New Base Formed Above 50-Day Moving Average Line - 4/21/2017 |
View all notes |
Set NEW NOTE alert |
Company Profile |
SEC
News |
Chart |
Request a new note
C
A
S
I |
HTHT
-
NASDAQ
China Lodging Group Ads
LEISURE - Lodging
|
$71.46
|
+0.99
1.40% |
$72.64
|
130,143
79.36% of 50 DAV
50 DAV is 164,000
|
$72.85
-1.91%
|
9/29/2016
|
$46.12
|
PP = $47.82
|
|
MB = $50.21
|
Most Recent Note - 4/28/2017 8:33:14 PM
G - Hit yet another new all-time high with today's 5th consecutive gain with lighter than average volume. Found prompt support near its 50 DMA line during its ongoing advance. Recent low ($57.89 on 4/11/17) defines near-term support to watch on pullbacks. Repeatedly noted with caution - "The 2 latest quarterly comparisons (Sep and Dec '16) were below the +25% minimum earnings guideline (C criteria), and its waning sales revenues growth rate was also noted recently as a fundamental concern.
>>> FEATURED STOCK ARTICLE : Support Shown Promptly After 50-Day Moving Average Violation - 4/19/2017 |
View all notes |
Set NEW NOTE alert |
Company Profile |
SEC
News |
Chart |
Request a new note
C
A
S
I |
SIRI
-
NASDAQ
Sirius X M Holdings Inc
MEDIA - Broadcasting - Radio
|
$4.84
|
-0.12
-2.42% |
$4.98
|
58,776,195
213.24% of 50 DAV
50 DAV is 27,563,500
|
$5.53
-12.48%
|
3/13/2017
|
$5.48
|
PP = $5.32
|
|
MB = $5.59
|
Most Recent Note - 5/2/2017 1:39:57 PM
G - Suffering another volume-driven loss today, raising more serious concerns. A rebound above the 50 DMA line ($5.13) is needed for its outlook to improve. It reported earnings +33% on +8% sales revenues for the Mar '17 quarter, a 3rd consecutive quarterly comparison above the +25% minimum guideline (C criteria).
>>> FEATURED STOCK ARTICLE : Consolidating Above Near-Term Support Level - 4/13/2017 |
View all notes |
Set NEW NOTE alert |
Company Profile |
SEC
News |
Chart |
Request a new note
C
A
S
I |
Symbol/Exchange
Company Name
Industry Group |
PRICE |
CHANGE
(%Change) |
Day High |
Volume
(% DAV)
(% 50 day avg vol) |
52 Wk Hi
% From Hi |
Featured
Date |
Price
Featured |
Pivot Featured |
|
Max Buy |
BEAT
-
NASDAQ
BioTelemetry Inc
Medical-Services
|
$33.90
|
+0.15
0.44% |
$34.00
|
591,799
129.21% of 50 DAV
50 DAV is 458,000
|
$33.95
-0.15%
|
2/14/2017
|
$25.10
|
PP = $24.55
|
|
MB = $25.78
|
Most Recent Note - 5/1/2017 4:47:57 PM
G - Hit another new all-time high today with its gain backed by volume slightly above average. It is extended from any sound base. Its 50 DMA line ($28.26) defines the nearest support level.
>>> FEATURED STOCK ARTICLE : Perched Near High, Extended From Prior Base - 4/3/2017 |
View all notes |
Set NEW NOTE alert |
Company Profile |
SEC
News |
Chart |
Request a new note
C
A
S
I |
ULTA
-
NASDAQ
Ulta Salon Cosm & Frag
SPECIALTY RETAIL - Specialty Retail, Other
|
$288.59
|
+5.37
1.90% |
$288.72
|
514,980
79.00% of 50 DAV
50 DAV is 651,900
|
$289.27
-0.24%
|
3/6/2017
|
$274.96
|
PP = $278.73
|
|
MB = $292.67
|
Most Recent Note - 5/1/2017 4:21:47 PM
G - Its current Relative Strength rank is 71, below the 80+ guideline for buy candidates. Tested prior highs in the $278 area defining important support along with its 50 DMA line ($280.94). More damaging losses would raise concerns and trigger technical sell signals.
>>> FEATURED STOCK ARTICLE : Volume Totals Cooling Following Technical Breakout - 4/7/2017 |
View all notes |
Set NEW NOTE alert |
Company Profile |
SEC
News |
Chart |
Request a new note
C
A
S
I |
ESNT
-
NYSE
Essent Group Ltd
Finance-MrtgandRel Svc
|
$36.65
|
-0.14
-0.38% |
$37.20
|
633,549
91.95% of 50 DAV
50 DAV is 689,000
|
$39.50
-7.22%
|
4/4/2017
|
$36.38
|
PP = $36.81
|
|
MB = $38.65
|
Most Recent Note - 5/2/2017 6:55:11 PM
Y - Suffered a 4th consecutive loss on near average volume today. Its 50 DMA line ($36.17) and recent lows define important near-term support where violations would trigger technical sell signals.
>>> FEATURED STOCK ARTICLE : Quiet Volume Behind Gain for New High Close - 4/10/2017 |
View all notes |
Set NEW NOTE alert |
Company Profile |
SEC
News |
Chart |
Request a new note
C
A
S
I |
MTSI
-
NASDAQ
Macom Tech Solution Hldg
Elec-Semiconductor Mfg
|
$46.95
|
-1.94
-3.97% |
$48.95
|
756,267
142.42% of 50 DAV
50 DAV is 531,000
|
$55.18
-14.91%
|
4/25/2017
|
$54.57
|
PP = $53.90
|
|
MB = $56.60
|
Most Recent Note - 5/2/2017 1:50:52 PM
G - Slumping below its 50 DMA line today, and more damaging losses would raise greater concerns. Had a "negative reversal" after highlighted in yellow in the 4/25/17 mid-day report with a pivot point cited based on its 12/07/16 high plus 10 cents. Reported +38% earnings on +39% sales revenues for the Mar '17 quarter after the close.
>>> FEATURED STOCK ARTICLE : Strong Earnings Report While Perched at All-Time High - 4/25/2017 |
View all notes |
Set NEW NOTE alert |
Company Profile |
SEC
News |
Chart |
Request a new note
C
A
S
I |
VEEV
-
NYSE
Veeva Systems Inc Cl A
Computer Sftwr-Medical
|
$54.01
|
-0.23
-0.42% |
$54.22
|
893,415
67.94% of 50 DAV
50 DAV is 1,315,000
|
$54.50
-0.90%
|
3/16/2017
|
$49.00
|
PP = $48.05
|
|
MB = $50.45
|
Most Recent Note - 5/2/2017 1:55:41 PM
G - Perched near its all-time high, extended from any sound base. Its 50 DMA line ($48.97) defines support above prior highs in the $47-48 area.
>>> FEATURED STOCK ARTICLE : Hovering Near High, Stubbornly Holding its Ground - 4/18/2017 |
View all notes |
Set NEW NOTE alert |
Company Profile |
SEC
News |
Chart |
Request a new note
C
A
S
I |
Symbol/Exchange
Company Name
Industry Group |
PRICE |
CHANGE
(%Change) |
Day High |
Volume
(% DAV)
(% 50 day avg vol) |
52 Wk Hi
% From Hi |
Featured
Date |
Price
Featured |
Pivot Featured |
|
Max Buy |
ANET
-
NYSE
Arista Networks Inc
TELECOMMUNICATIONS - Communication Equipment
|
$141.19
|
+0.09
0.06% |
$141.91
|
949,528
107.66% of 50 DAV
50 DAV is 882,000
|
$141.92
-0.51%
|
4/17/2017
|
$132.75
|
PP = $135.27
|
|
MB = $142.03
|
Most Recent Note - 5/1/2017 8:19:20 PM
Y - Hit yet another new all-time high with a gain on light volume. Gains with at least +40% above average volume while rising above the new pivot point cited would trigger a new (or add-on) technical buy signal.
>>> FEATURED STOCK ARTICLE : Extended From Any Sound Base After a Considerable Rally - 4/5/2017 |
View all notes |
Set NEW NOTE alert |
Company Profile |
SEC
News |
Chart |
Request a new note
C
A
S
I |
GRUB
-
NYSE
Grubhub Inc
COMPUTER SOFTWARE and SERVICES - Technical and System Software
|
$44.09
|
+1.20
2.80% |
$44.85
|
3,743,464
161.36% of 50 DAV
50 DAV is 2,320,000
|
$45.09
-2.22%
|
4/28/2017
|
$44.22
|
PP = $44.68
|
|
MB = $46.91
|
Most Recent Note - 5/2/2017 1:49:00 PM
Y - Challenging its 52-week high with volume running at an above average pace behind today's big gain. A gain and strong close above the pivot point may clinch a technical buy signal.
>>> FEATURED STOCK ARTICLE : Hit New 52-Week High But Ended Near Session Low - 4/28/2017 |
View all notes |
Set NEW NOTE alert |
Company Profile |
SEC
News |
Chart |
Request a new note
C
A
S
I |
IBP
-
NYSE
Installed Building Prod
DIVERSIFIED SERVICES - Business/Management Services
|
$52.60
|
-1.30
-2.41% |
$53.90
|
162,570
103.55% of 50 DAV
50 DAV is 157,000
|
$55.45
-5.14%
|
4/17/2017
|
$51.75
|
PP = $53.10
|
|
MB = $55.76
|
Most Recent Note - 5/2/2017 6:48:49 PM
Y - Pulled back below its pivot point with near average volume behind today's 3rd loss in the span of 4 sessions after reversing at its all-time high. Wedged higher with gains lacking great volume conviction after an advanced "3-weeks tight" base was noted. Subsequent volume-driven gains above the new pivot point cited may clinch a new (or add-on) technical buy signal. Its 50 DMA line ($50.51) and recent low define important near-term support to watch.
>>> FEATURED STOCK ARTICLE : Hovering Near All-Time High Following Volume-Driven Gains - 4/4/2017 |
View all notes |
Set NEW NOTE alert |
Company Profile |
SEC
News |
Chart |
Request a new note
C
A
S
I |
NCOM
-
NASDAQ
National Commerce Corp
BANKING - Regional - Southeast Banks
|
$39.00
|
+0.15
0.39% |
$39.10
|
23,685
74.02% of 50 DAV
50 DAV is 32,000
|
$40.00
-2.50%
|
4/25/2017
|
$38.95
|
PP = $40.09
|
|
MB = $42.09
|
Most Recent Note - 5/1/2017 8:17:25 PM
Y - Still perched near its 52-week high. A gain above the pivot point backed by a minimum of +40% above average volume may trigger a technical buy signal.
>>> FEATURED STOCK ARTICLE : Challenging 52-Week High With Volume-Driven Gains - 4/26/2017 |
View all notes |
Set NEW NOTE alert |
Company Profile |
SEC
News |
Chart |
Request a new note
C
A
S
I |
INGN
-
NASDAQ
Inogen Inc
HEALTH SERVICES - Medical Instruments and Supplies
|
$84.72
|
+0.21
0.25% |
$85.94
|
166,163
93.35% of 50 DAV
50 DAV is 178,000
|
$84.81
-0.11%
|
4/17/2017
|
$76.77
|
PP = $80.04
|
|
MB = $84.04
|
Most Recent Note - 5/1/2017 4:20:25 PM
G - Color code is changed to green after hitting a new all-time high and finishing the session above its "max buy" level with a gain on below average volume. Recent gains above the pivot point lacked the minimum +40% above average volume needed to trigger a proper new (or add-on) technical buy signal. Its 50 DMA line ($75.30) defines near-term support to watch.
>>> FEATURED STOCK ARTICLE : Wedging Higher With Recent Gains Lacking Great Volume - 5/1/2017 |
View all notes |
Set NEW NOTE alert |
Company Profile |
SEC
News |
Chart |
Request a new note
C
A
S
I |
Symbol/Exchange
Company Name
Industry Group |
PRICE |
CHANGE
(%Change) |
Day High |
Volume
(% DAV)
(% 50 day avg vol) |
52 Wk Hi
% From Hi |
Featured
Date |
Price
Featured |
Pivot Featured |
|
Max Buy |
PLAY
-
NASDAQ
Dave & Busters Ent Inc
Retail-Restaurants
|
$65.77
|
+1.51
2.35% |
$65.78
|
695,019
86.77% of 50 DAV
50 DAV is 801,000
|
$64.50
1.97%
|
2/23/2017
|
$55.41
|
PP = $58.35
|
|
MB = $61.27
|
Most Recent Note - 5/2/2017 6:44:42 PM
G - Finished at the session high with a gain on near average volume. Its 50 DMA line ($59.99) defines near-term support to watch on pullbacks. Latest quarter was below the +25% minimum guideline (C criteria), raising fundamental concerns. See the latest FSU analysis for more details and a new annotated graph.
>>> FEATURED STOCK ARTICLE : New Record High With Solid Gain on Near Average Volume - 5/2/2017 |
View all notes |
Set NEW NOTE alert |
Company Profile |
SEC
News |
Chart |
Request a new note
C
A
S
I |
OLLI
-
NASDAQ
Ollies Bargain Outlet
Retail-DiscountandVariety
|
$39.05
|
+1.05
2.76% |
$39.10
|
553,876
93.72% of 50 DAV
50 DAV is 591,000
|
$38.88
0.45%
|
3/27/2017
|
$32.80
|
PP = $33.55
|
|
MB = $35.23
|
Most Recent Note - 5/2/2017 6:49:44 PM
G - Hit yet another new high today, getting very extended from any sound base. Bullish action has continued since reporting earnings +22% on +16% sales revenues for the Jan '17 quarter, below the +25% minimum earnings guideline (C criteria). Its 50 DMA line and prior highs in the $33 area define near-term support.
>>> FEATURED STOCK ARTICLE : Winning Streak Continues for Discount Retailer - 4/24/2017 |
View all notes |
Set NEW NOTE alert |
Company Profile |
SEC
News |
Chart |
Request a new note
C
A
S
I |
MOMO
-
NASDAQ
Momo Inc Ads Cl A
INTERNET - Content
|
$39.54
|
+0.11
0.28% |
$40.43
|
2,649,207
50.24% of 50 DAV
50 DAV is 5,273,000
|
$39.95
-1.03%
|
3/7/2017
|
$29.71
|
PP = $27.83
|
|
MB = $29.22
|
Most Recent Note - 5/1/2017 4:49:54 PM
G - Hit a new all-time high with today's gain on average volume. Its 50 DMA line ($33.31) defines important support to watch.
>>> FEATURED STOCK ARTICLE : Extended From Prior Base and Perched Near High - 4/6/2017 |
View all notes |
Set NEW NOTE alert |
Company Profile |
SEC
News |
Chart |
Request a new note
C
A
S
I |
|
|
|
THESE ARE NOT BUY RECOMMENDATIONS!
Comments contained in the body of this report are technical
opinions only. The material herein has been obtained
from sources believed to be reliable and accurate, however,
its accuracy and completeness cannot be guaranteed.
This site is not an investment advisor, hence it does
not endorse or recommend any securities or other investments.
Any recommendation contained in this report may not
be suitable for all investors and it is not to be deemed
an offer or solicitation on our part with respect to
the purchase or sale of any securities. All trademarks,
service marks and trade names appearing in this report
are the property of their respective owners, and are
likewise used for identification purposes only.
This report is a service available
only to active Paid Premium Members.
You may opt-out of receiving report notifications
at any time. Questions or comments may be submitted
by writing to Premium Membership Services 665 S.E. 10 Street, Suite 201 Deerfield Beach, FL 33441-5634 or by calling 1-800-965-8307
or 954-785-1121.
|
|
|