You are not logged in.
This means you
CAN ONLY VIEW reports that were published prior to Thursday, March 20, 2025.
You
MUST UPGRADE YOUR MEMBERSHIP if you want to see any current reports.
AFTER MARKET UPDATE - THURSDAY, APRIL 27TH, 2017
Previous After Market Report Next After Market Report >>>
|
|
|
|
DOW |
+6.24 |
20,981.33 |
+0.03% |
|
Volume |
1,230,858,660 |
+10% |
|
Volume |
1,699,296,960 |
-0% |
|
NASDAQ |
+23.71 |
6,048.94 |
+0.39% |
|
Advancers |
1,430 |
49% |
|
Advancers |
1,307 |
47% |
|
S&P 500 |
+1.32 |
2,388.77 |
+0.06% |
|
Decliners |
1,476 |
51% |
|
Decliners |
1,497 |
53% |
|
Russell 2000 |
-2.30 |
1,417.13 |
-0.16% |
|
52 Wk Highs |
264 |
|
|
52 Wk Highs |
241 |
|
|
S&P 600 |
-1.24 |
861.84 |
-0.14% |
|
52 Wk Lows |
25 |
|
|
52 Wk Lows |
44 |
|
|
 |
Leadership Strong as Major Averages Inch Higher
Kenneth J. Gruneisen - Passed the CAN SLIM® Master's Exam
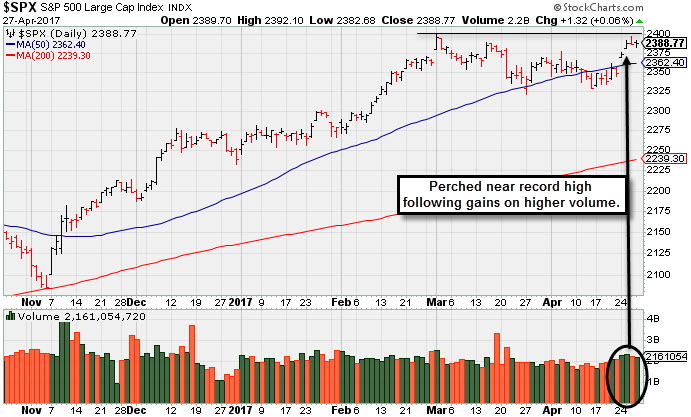
Stocks finished modestly higher on Thursday. The Dow was up 6 points to 20981. The S&P 500 ticked up a point to 2388 and the Nasdaq Composite gained 23 points to 6048. The volume totals reported were mixed, higher than the prior session total on the NYSE and lighter on the Nasdaq exchange. Decliners narrowly led advancers on the NYSE and on the Nasdaq exchange. There were 102 high-ranked companies from the Leaders List that made new 52-week highs and were listed on the BreakOuts Page, versus the total of 95 on the prior session. New 52-week highs totals contracted slightly yet solidly outnumbered new 52-week lows on the NYSE and on the Nasdaq exchange. PICTURED: The S&P 500 Index recently rebounded above its 50-day moving average (DMA) with gains on higher volume while rallying toward its record high.
The major averages' (M criteria) are in a confirmed uptrend, and there has been a reassuring expansion in leadership (number of high-ranked stocks hitting new highs). New buying efforts should be made only in stocks matching all of the fundamental and technical criteria of the fact-based investment system. The Featured Stocks Page lists noteworthy high-ranked leaders.
The major averages advanced in choppy session as investors digested a flurry of corporate earnings reports and economic releases. Comcast gained 2.1% to $39.59 after reporting revenue growth in high-speed internet and business services units. On the data front, initial jobless claims came in at 257,000, above the expected 245,000. In separate releases, pending home sales slipped 0.8% while durable goods orders increased 0.7% in March. Overseas, the European Central Bank concluded its April policy meeting leaving interest rates unchanged on Thursday.
Six of 11 sectors in the S&P 500 ended in negative territory. Technology stocks outperformed with Intuit (INTU +8.5%) rising. PayPal (PYPL +6.2%) rose as the company posted better-than-expected quarterly results. In the consumer space, Under Armour (UA +9.9%) after apparel sales were up 7% in the quarter. Shares of Ford Motor (F -1.1%) edged lower as the automaker posted lower profit compared to a year earlier. In Industrials, American Airlines (AAL -5.2%) after being the subject of negative analyst commentary.
Treasuries finished mostly higher with the benchmark 10-year note up 2/32 to yield 2.29%. In commodities, NYMEX WTI crude lost 0.9% to $49.20/barrel. In FOREX, the Dollar Index gained 0.1%. |
 Kenneth J. Gruneisen started out as a licensed stockbroker in August 1987, a couple of months prior to the historic stock market crash that took the Dow Jones Industrial Average down -22.6% in a single day. He has published daily fact-based fundamental and technical analysis on high-ranked stocks online for two decades. Through FACTBASEDINVESTING.COM, Kenneth provides educational articles, news, market commentary, and other information regarding proven investment systems that work in good times and bad.
Comments contained in the body of this report are technical opinions only and are not necessarily those of Gruneisen Growth Corp. The material herein has been obtained from sources believed to be reliable and accurate, however, its accuracy and completeness cannot be guaranteed. Our firm, employees, and customers may effect transactions, including transactions contrary to any recommendation herein, or have positions in the securities mentioned herein or options with respect thereto. Any recommendation contained in this report may not be suitable for all investors and it is not to be deemed an offer or solicitation on our part with respect to the purchase or sale of any securities. |
|
 |
Commodity-Linked Groups Were Weakest Amid Mixed Group Action
Kenneth J. Gruneisen - Passed the CAN SLIM® Master's Exam
The Bank Index ($BKX -0.69%) and Broker/Dealer Index ($XBD -0.60%) created a drag while the Retail Index ($RLX +0.74%) rose on Thursday. The tech sector was mixed as the Semiconductor Index ($SOX +1.40%) outpaced the Biotechnology Index ($BTK +0.18%) but the Networking Index ($NWX -0.55%) fell. The Oil Services Index ($OSX -3.13%) and Gold & Silver index ($XAU -2.68%) were standout decliners and the Integrated Oil Index ($XOI -0.77%) also ended lower. Charts courtesy www.stockcharts.com
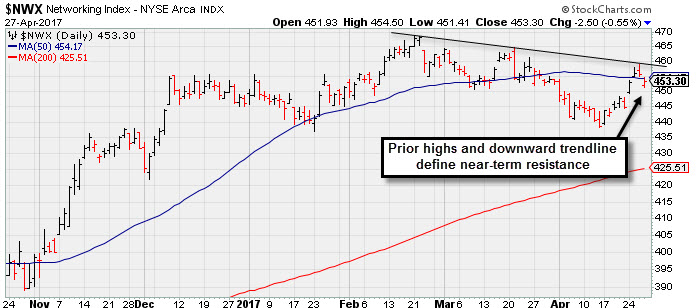 PICTURED: The Networking Index ($NWX -0.55%) slumped back below its 50-day moving average (DMA) line. Near term-resistance is at prior highs and a multi-month downward trendline.
| Oil Services |
$OSX |
154.07 |
-4.98 |
-3.13% |
-16.17% |
| Integrated Oil |
$XOI |
1,156.03 |
-8.95 |
-0.77% |
-8.83% |
| Semiconductor |
$SOX |
1,023.29 |
+14.13 |
+1.40% |
+12.89% |
| Networking |
$NWX |
453.30 |
-2.50 |
-0.55% |
+1.61% |
| Broker/Dealer |
$XBD |
214.58 |
-1.30 |
-0.60% |
+4.53% |
| Retail |
$RLX |
1,501.73 |
+11.09 |
+0.74% |
+11.82% |
| Gold & Silver |
$XAU |
81.08 |
-2.23 |
-2.68% |
+2.82% |
| Bank |
$BKX |
92.21 |
-0.64 |
-0.69% |
+0.46% |
| Biotech |
$BTK |
3,617.79 |
+6.50 |
+0.18% |
+17.65% |
|
|
|
 |
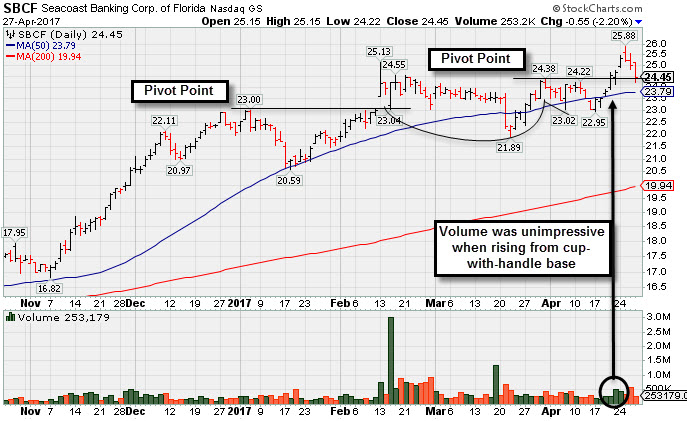
Pullback Following Recent Gains With Unimpressive Volume
Kenneth J. Gruneisen - Passed the CAN SLIM® Master's Exam
Seacoast Banking Corp Fl (SBCF -$0.55 or -2.20% to $24.45) suffered its 3rd consecutive loss. It had a "negative reversal" after hitting a new high on Tuesday. Volume was unimpressive when it recently rose above the new pivot point cited based on its 3/31/17 high after a cup with handle base. Gains above the pivot point should be backed by a minimum of +40% above average volume to trigger a proper new (or add-on) technical buy signal. Without fresh proof of institutional buying demand it is considered unlikely to see a meaningful price advance. Subsequent volume-driven gains for new highs may help to clinch a more convincing technical buy signal.
The Stuart, Florida based banking firm reported Mar '17 earnings +30% on +24% sales revenues versus the year-ago period, marking its 4th consecutive strong earnings increase above the +25% minimum guideline (C criteria) coupled with strong sales revenues increases. Annual earnings (A criteria) have improved since a downturn and loss in FY '12.
It was first highlighted in yellow with pivot point cited based on its 1/04/17 high plus 10 cents in the 2/13/17 mid-day report (read here). Its solid gain backed by +234% above average volume clinched a technical buy signal, however it then completed a new Public Offering and stalled thereafter.
It has earned a Timeliness Rating of A and a Sponsorship Rating of B. The number of top-rated funds owning its shares rose from 161 in Mar '16 to 211 in Mar '17, a reassuring sign concerning the I criteria. It current Up/Down Volume Ratio of 1.0 is an unbiased indication its shares have been neutral in terms of accumulation or distribution for the past 50 days. Its small supply of only 40.7 million shares outstanding (S criteria) can contribute to greater price volatility in the event of institutional buying or selling.
|
|
|
Color Codes Explained :
Y - Better candidates highlighted by our
staff of experts.
G - Previously featured
in past reports as yellow but may no longer be buyable under the
guidelines.
***Last / Change / Volume data in this table is the closing quote data***
Symbol/Exchange
Company Name
Industry Group |
PRICE |
CHANGE
(%Change) |
Day High |
Volume
(% DAV)
(% 50 day avg vol) |
52 Wk Hi
% From Hi |
Featured
Date |
Price
Featured |
Pivot Featured |
|
Max Buy |
SBCF
-
NASDAQ
Seacoast Banking Corp Fl
BANKING - Regional - Mid-Atlantic Banks
|
$24.45
|
-0.55
-2.20% |
$25.15
|
253,179
55.28% of 50 DAV
50 DAV is 458,000
|
$25.88
-5.53%
|
4/24/2017
|
$25.33
|
PP = $24.38
|
|
MB = $25.60
|
 Most Recent Note - 4/27/2017 9:41:25 PM
Y - Pulled back today with light volume, closing near the new pivot point cited based on its 3/31/17 high after a cup with handle base. Recent gains above the pivot point lacked the above average volume needed to trigger a proper new (or add-on) technical buy signal. The 50 DMA line ($23.79) and recent low ($21.89 on 3/22/17) define support where violations would raise more serious concerns and trigger worrisome technical sell signals.
>>> FEATURED STOCK ARTICLE : Pullback Following Recent Gains With Unimpressive Volume - 4/27/2017 |
View all notes |
Set NEW NOTE alert |
Company Profile |
SEC
News |
Chart |
Request a new note
C
A
S
I |
CSFL
-
NASDAQ
Centerstate Banks Inc
Banks-Southeast
|
$25.82
|
-0.34
-1.30% |
$26.20
|
917,453
308.91% of 50 DAV
50 DAV is 297,000
|
$26.94
-4.15%
|
3/13/2017
|
$25.54
|
PP = $26.40
|
|
MB = $27.72
|
Most Recent Note - 4/27/2017 9:53:26 PM
Y - Reported earnings +10% on +13% sales revenues for the Mar '17 quarter, below the +25% minimum earnings guideline. Pulled back toward its 50 DMA line ($25.26). Damaging losses below its recent low ($23.64 on 4/17/17) would raise more serious concerns.
>>> FEATURED STOCK ARTICLE : Positive Reversal After Intra-day Low Undercut Prior Lows - 4/17/2017 |
View all notes |
Set NEW NOTE alert |
Company Profile |
SEC
News |
Chart |
Request a new note
C
A
S
I |
NSP
-
NYSE
Insperity Inc
Comml Svcs-Outsourcing
|
$92.80
|
+0.55
0.60% |
$93.28
|
126,772
86.83% of 50 DAV
50 DAV is 146,000
|
$93.43
-0.67%
|
4/21/2017
|
$88.65
|
PP = $90.65
|
|
MB = $95.18
|
Most Recent Note - 4/25/2017 7:37:17 PM
Y - Hit a new high with today's gain on light volume. Color code was changed to yellow with new pivot point cited based on its 3/15/17 high plus 10 cents. Gains above the pivot point backed by at least +40% above average volume are needed to trigger a proper new (or add-on) technical buy signal. Found support while consolidating in an orderly fashion above its 50 DMA line. See the latest FSU analysis for more details and an annotated graph.
>>> FEATURED STOCK ARTICLE : New Base Formed Above 50-Day Moving Average Line - 4/21/2017 |
View all notes |
Set NEW NOTE alert |
Company Profile |
SEC
News |
Chart |
Request a new note
C
A
S
I |
HTHT
-
NASDAQ
China Lodging Group Ads
LEISURE - Lodging
|
$69.04
|
+0.40
0.58% |
$69.52
|
151,391
91.75% of 50 DAV
50 DAV is 165,000
|
$68.96
0.12%
|
9/29/2016
|
$46.12
|
PP = $47.82
|
|
MB = $50.21
|
Most Recent Note - 4/26/2017 5:04:56 PM
G - Touched another new all-time high with today's 3rd consecutive gain with light volume. Found prompt support after violating its 50 DMA line on 4/11/17. Recent low ($57.89 on 4/11/17) defines near-term support to watch on pullbacks. Repeatedly noted with caution - "The 2 latest quarterly comparisons (Sep and Dec '16) were below the +25% minimum earnings guideline (C criteria), and its waning sales revenues growth rate was also noted recently as a fundamental concern.
>>> FEATURED STOCK ARTICLE : Support Shown Promptly After 50-Day Moving Average Violation - 4/19/2017 |
View all notes |
Set NEW NOTE alert |
Company Profile |
SEC
News |
Chart |
Request a new note
C
A
S
I |
SIRI
-
NASDAQ
Sirius X M Holdings Inc
MEDIA - Broadcasting - Radio
|
$5.02
|
-0.09
-1.76% |
$5.05
|
60,646,136
226.43% of 50 DAV
50 DAV is 26,783,500
|
$5.53
-9.22%
|
3/13/2017
|
$5.48
|
PP = $5.32
|
|
MB = $5.59
|
Most Recent Note - 4/27/2017 9:45:12 PM
G - Reported earnings +33% on +8% sales revenues for the Mar '17 quarter. Finished near the session high after gapping down today, a reassuring sign it was finding prompt institutional support. A subsequent rebound above its 50 DMA line ($5.13) is needed for its outlook to improve. Damaging losses below today's low ($4.90) would raise greater concerns and trigger a more worrisome technical sell signal.
>>> FEATURED STOCK ARTICLE : Consolidating Above Near-Term Support Level - 4/13/2017 |
View all notes |
Set NEW NOTE alert |
Company Profile |
SEC
News |
Chart |
Request a new note
C
A
S
I |
Symbol/Exchange
Company Name
Industry Group |
PRICE |
CHANGE
(%Change) |
Day High |
Volume
(% DAV)
(% 50 day avg vol) |
52 Wk Hi
% From Hi |
Featured
Date |
Price
Featured |
Pivot Featured |
|
Max Buy |
BEAT
-
NASDAQ
BioTelemetry Inc
Medical-Services
|
$32.45
|
-0.75
-2.26% |
$33.45
|
455,578
98.82% of 50 DAV
50 DAV is 461,000
|
$33.45
-2.99%
|
2/14/2017
|
$25.10
|
PP = $24.55
|
|
MB = $25.78
|
Most Recent Note - 4/27/2017 9:50:00 PM
G - Pulled back from its all-time high today with lighter (near average) volume. It sis extended from any sound base. Its 50 DMA line ($27.92) defines the nearest support level.
>>> FEATURED STOCK ARTICLE : Perched Near High, Extended From Prior Base - 4/3/2017 |
View all notes |
Set NEW NOTE alert |
Company Profile |
SEC
News |
Chart |
Request a new note
C
A
S
I |
ULTA
-
NASDAQ
Ulta Salon Cosm & Frag
SPECIALTY RETAIL - Specialty Retail, Other
|
$281.68
|
+1.99
0.71% |
$283.67
|
679,207
104.38% of 50 DAV
50 DAV is 650,700
|
$289.27
-2.62%
|
3/6/2017
|
$274.96
|
PP = $278.73
|
|
MB = $292.67
|
Most Recent Note - 4/25/2017 11:27:40 AM
G - Color code is changed to green as its Relative Strength rank has slumped to 69, below the 80+ guideline for buy candidates. Testing prior highs in the $278 area defining important support along with its 50 DMA line ($280.12). More damaging losses would raise concerns and trigger technical sell signals.
>>> FEATURED STOCK ARTICLE : Volume Totals Cooling Following Technical Breakout - 4/7/2017 |
View all notes |
Set NEW NOTE alert |
Company Profile |
SEC
News |
Chart |
Request a new note
C
A
S
I |
ESNT
-
NYSE
Essent Group Ltd
Finance-MrtgandRel Svc
|
$37.55
|
-1.36
-3.50% |
$39.01
|
747,251
107.98% of 50 DAV
50 DAV is 692,000
|
$39.50
-4.94%
|
4/4/2017
|
$36.38
|
PP = $36.81
|
|
MB = $38.65
|
Most Recent Note - 4/27/2017 9:46:49 PM
Y - Color code is changed to yellow after again pulling back below its "max buy" level. Its 50 DMA line ($36.12) and recent lows define important near-term support.
>>> FEATURED STOCK ARTICLE : Quiet Volume Behind Gain for New High Close - 4/10/2017 |
View all notes |
Set NEW NOTE alert |
Company Profile |
SEC
News |
Chart |
Request a new note
C
A
S
I |
MTSI
-
NASDAQ
M/A-COM Technology Sltn
Elec-Semiconductor Mfg
|
$49.80
|
-0.52
-1.03% |
$50.55
|
955,514
182.94% of 50 DAV
50 DAV is 522,300
|
$55.18
-9.74%
|
4/25/2017
|
$54.57
|
PP = $53.90
|
|
MB = $56.60
|
Most Recent Note - 4/27/2017 9:55:13 PM
G - Pulled back for a 3rd consecutive loss with above average volume. Gapped down on the prior session and undercut its 50 DMA line then found prompt support. Its color code was changed to green. Had a "negative reversal" after highlighted in yellow in the 4/25/17 mid-day report with a pivot point cited based on its 12/07/16 high plus 10 cents. No resistance remains. Reported +38% earnings on +39% sales revenues for the Mar '17 quarter after the close. Volume and volatility often increase near earnings news. See the latest FSU analysis for more details and an annotated graph.
>>> FEATURED STOCK ARTICLE : Strong Earnings Report While Perched at All-Time High - 4/25/2017 |
View all notes |
Set NEW NOTE alert |
Company Profile |
SEC
News |
Chart |
Request a new note
C
A
S
I |
VEEV
-
NYSE
Veeva Systems Inc Cl A
Computer Sftwr-Medical
|
$53.53
|
+0.54
1.02% |
$53.88
|
616,900
46.84% of 50 DAV
50 DAV is 1,317,000
|
$53.37
0.30%
|
3/16/2017
|
$49.00
|
PP = $48.05
|
|
MB = $50.45
|
Most Recent Note - 4/26/2017 5:09:25 PM
G - Small gain backed by light volume today for a best-ever close. Its 50 DMA line defines support along with prior highs in the $47-48 area.
>>> FEATURED STOCK ARTICLE : Hovering Near High, Stubbornly Holding its Ground - 4/18/2017 |
View all notes |
Set NEW NOTE alert |
Company Profile |
SEC
News |
Chart |
Request a new note
C
A
S
I |
Symbol/Exchange
Company Name
Industry Group |
PRICE |
CHANGE
(%Change) |
Day High |
Volume
(% DAV)
(% 50 day avg vol) |
52 Wk Hi
% From Hi |
Featured
Date |
Price
Featured |
Pivot Featured |
|
Max Buy |
ANET
-
NYSE
Arista Networks Inc
TELECOMMUNICATIONS - Communication Equipment
|
$139.65
|
+0.29
0.21% |
$139.84
|
630,023
71.59% of 50 DAV
50 DAV is 880,000
|
$140.32
-0.48%
|
4/17/2017
|
$132.75
|
PP = $135.27
|
|
MB = $142.03
|
Most Recent Note - 4/27/2017 9:51:02 PM
Y - Perched at its all-time high following another small gain with light volume. Wedged higher with gains lacking great volume conviction since forming an advanced "3-weeks tight" base. Gains with at least +40% above average volume while rising above the new pivot point cited would trigger a new (or add-on) technical buy signal.
>>> FEATURED STOCK ARTICLE : Extended From Any Sound Base After a Considerable Rally - 4/5/2017 |
View all notes |
Set NEW NOTE alert |
Company Profile |
SEC
News |
Chart |
Request a new note
C
A
S
I |
IBP
-
NYSE
Installed Building Prod
DIVERSIFIED SERVICES - Business/Management Services
|
$54.40
|
-0.40
-0.73% |
$55.45
|
161,057
103.91% of 50 DAV
50 DAV is 155,000
|
$54.90
-0.91%
|
4/17/2017
|
$51.75
|
PP = $53.10
|
|
MB = $55.76
|
Most Recent Note - 4/26/2017 5:11:21 PM
Y - Hit a new all-time high today with another gain backed by light volume. Wedged higher with gains lacking great volume conviction after an advanced "3-weeks tight" base was noted. Subsequent volume-driven gains above the new pivot point cited may trigger a new (or add-on) technical buy signal. Its 50 DMA line ($49.53) defines important near-term support to watch.
>>> FEATURED STOCK ARTICLE : Hovering Near All-Time High Following Volume-Driven Gains - 4/4/2017 |
View all notes |
Set NEW NOTE alert |
Company Profile |
SEC
News |
Chart |
Request a new note
C
A
S
I |
NCOM
-
NASDAQ
National Commerce Corp
BANKING - Regional - Southeast Banks
|
$39.35
|
-0.30
-0.76% |
$39.90
|
27,681
86.50% of 50 DAV
50 DAV is 32,000
|
$40.00
-1.63%
|
4/25/2017
|
$38.95
|
PP = $40.09
|
|
MB = $42.09
|
Most Recent Note - 4/26/2017 5:00:53 PM
Y - Touched a new 52-week high with above average volume behind today's 3rd consecutive gain. It finished strong after highlighted in yellow in the 4/25/17 mid-day report with new pivot point cited based on its 1/27/17 high plus 10 cents. A gain above the pivot point backed by a minimum of +40% above average volume may trigger a technical buy signal. Up from its $20 IPO on 3/19/15. Reported Mar '17 earnings +32% on +42% sales revenues extending its streak to 9 consecutive quarterly comparisons with earnings increasing above the +25% minimum guideline (C criteria). See the latest FSU analysis for more details and an annotated graph.
>>> FEATURED STOCK ARTICLE : Challenging 52-Week High With Volume-Driven Gains - 4/26/2017 |
View all notes |
Set NEW NOTE alert |
Company Profile |
SEC
News |
Chart |
Request a new note
C
A
S
I |
INGN
-
NASDAQ
Inogen Inc
HEALTH SERVICES - Medical Instruments and Supplies
|
$83.60
|
+1.30
1.58% |
$84.25
|
113,750
63.90% of 50 DAV
50 DAV is 178,000
|
$82.52
1.31%
|
4/17/2017
|
$76.77
|
PP = $80.04
|
|
MB = $84.04
|
Most Recent Note - 4/25/2017 11:33:25 AM
Y - Hitting a new all-time high with today's 4th consecutive gain on higher volume. Gains above the pivot point backed by at least +40% above average volume are needed to trigger a proper new (or add-on) technical buy signal. Its 50 DMA line ($74.13) defines near-term support to watch.
>>> FEATURED STOCK ARTICLE : Best Ever Close For High-Ranked Medical Product Maker - 3/31/2017 |
View all notes |
Set NEW NOTE alert |
Company Profile |
SEC
News |
Chart |
Request a new note
C
A
S
I |
PLAY
-
NASDAQ
Dave & Buster's Ent Inc
Retail-Restaurants
|
$64.16
|
+0.13
0.20% |
$64.48
|
315,793
39.38% of 50 DAV
50 DAV is 802,000
|
$64.50
-0.53%
|
2/23/2017
|
$55.41
|
PP = $58.35
|
|
MB = $61.27
|
Most Recent Note - 4/26/2017 5:06:38 PM
G - Posted a small gain with light volume today for a new high close. Its 50 DMA line ($59.45) defines near-term support to watch on pullbacks. Latest quarter was below the +25% minimum guideline (C criteria), raising fundamental concerns.
>>> FEATURED STOCK ARTICLE : Retreated From All-Time High Following Earnings Report - 3/29/2017 |
View all notes |
Set NEW NOTE alert |
Company Profile |
SEC
News |
Chart |
Request a new note
C
A
S
I |
Symbol/Exchange
Company Name
Industry Group |
PRICE |
CHANGE
(%Change) |
Day High |
Volume
(% DAV)
(% 50 day avg vol) |
52 Wk Hi
% From Hi |
Featured
Date |
Price
Featured |
Pivot Featured |
|
Max Buy |
OLLI
-
NASDAQ
Ollie's Bargain Outlet
Retail-DiscountandVariety
|
$37.90
|
-0.55
-1.43% |
$38.60
|
414,978
69.98% of 50 DAV
50 DAV is 593,000
|
$38.88
-2.51%
|
3/27/2017
|
$32.80
|
PP = $33.55
|
|
MB = $35.23
|
Most Recent Note - 4/27/2017 9:59:46 PM
G - Paused today after a streak of 8 consecutive gains, getting very extended from any sound base. Bullish action has continued since reporting earnings +22% on +16% sales revenues for the Jan '17 quarter, below the +25% minimum earnings guideline (C criteria). Its 50 DMA line and prior highs in the $33 area define near-term support.
>>> FEATURED STOCK ARTICLE : Winning Streak Continues for Discount Retailer - 4/24/2017 |
View all notes |
Set NEW NOTE alert |
Company Profile |
SEC
News |
Chart |
Request a new note
C
A
S
I |
MOMO
-
NASDAQ
Momo Inc Ads Cl A
INTERNET - Content
|
$38.38
|
+0.95
2.54% |
$38.62
|
4,295,728
82.51% of 50 DAV
50 DAV is 5,206,000
|
$39.25
-2.22%
|
3/7/2017
|
$29.71
|
PP = $27.83
|
|
MB = $29.22
|
Most Recent Note - 4/27/2017 9:56:43 PM
G - Holding its ground stubbornly near its all-time high. Its 50 DMA line ($32.82) defines important support to watch.
>>> FEATURED STOCK ARTICLE : Extended From Prior Base and Perched Near High - 4/6/2017 |
View all notes |
Set NEW NOTE alert |
Company Profile |
SEC
News |
Chart |
Request a new note
C
A
S
I |
|
|
|
THESE ARE NOT BUY RECOMMENDATIONS!
Comments contained in the body of this report are technical
opinions only. The material herein has been obtained
from sources believed to be reliable and accurate, however,
its accuracy and completeness cannot be guaranteed.
This site is not an investment advisor, hence it does
not endorse or recommend any securities or other investments.
Any recommendation contained in this report may not
be suitable for all investors and it is not to be deemed
an offer or solicitation on our part with respect to
the purchase or sale of any securities. All trademarks,
service marks and trade names appearing in this report
are the property of their respective owners, and are
likewise used for identification purposes only.
This report is a service available
only to active Paid Premium Members.
You may opt-out of receiving report notifications
at any time. Questions or comments may be submitted
by writing to Premium Membership Services 665 S.E. 10 Street, Suite 201 Deerfield Beach, FL 33441-5634 or by calling 1-800-965-8307
or 954-785-1121.
|
|
|