You are not logged in.
This means you
CAN ONLY VIEW reports that were published prior to Tuesday, April 1, 2025.
You
MUST UPGRADE YOUR MEMBERSHIP if you want to see any current reports.
AFTER MARKET UPDATE - TUESDAY, MAY 23RD, 2017
Previous After Market Report Next After Market Report >>>
|
|
|
|
DOW |
+43.08 |
20,937.91 |
+0.21% |
|
Volume |
908,869,890 |
-5% |
|
Volume |
1,556,316,810 |
-1% |
|
NASDAQ |
+5.09 |
6,138.71 |
+0.08% |
|
Advancers |
1,738 |
60% |
|
Advancers |
1,490 |
53% |
|
S&P 500 |
+4.40 |
2,398.42 |
+0.18% |
|
Decliners |
1,170 |
40% |
|
Decliners |
1,334 |
47% |
|
Russell 2000 |
+3.84 |
1,380.98 |
+0.28% |
|
52 Wk Highs |
150 |
|
|
52 Wk Highs |
130 |
|
|
S&P 600 |
+2.21 |
836.52 |
+0.26% |
|
52 Wk Lows |
26 |
|
|
52 Wk Lows |
62 |
|
|
 |
Healthy Leadership Underpins Small Gains for Major Indices
Kenneth J. Gruneisen - Passed the CAN SLIM® Master's Exam
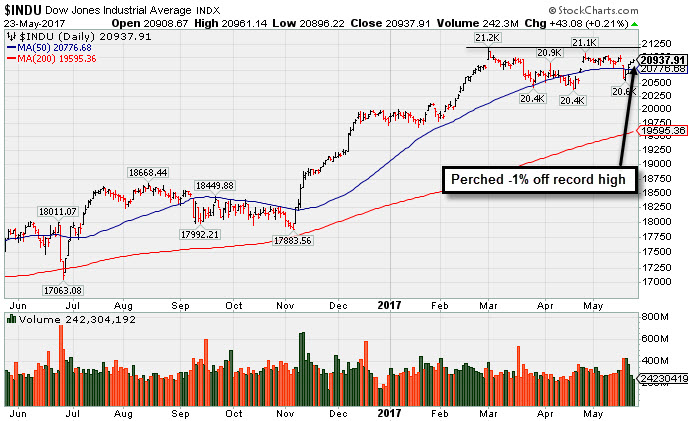
Stocks finished higher on Tuesday. The Dow was up 43 points to 20937. The S&P 500 added 4 points to 2398 and the Nasdaq Composite gained 5 points to 6138. The volume totals reported were lighter than the prior session totals on the NYSE and on the Nasdaq exchange. Advancers led decliners by a 3-2 margin on the NYSE and by a 7-6 margin on the Nasdaq exchange. There were 48 high-ranked companies from the Leaders List that made new 52-week highs and were listed on the BreakOuts Page, versus the total of 53 on the prior session. New 52-week highs totals solidly outnumbered new 52-week lows on the NYSE and on the Nasdaq exchange. PICTURED: The Dow Jones Industrial Average is consolidating above its 50-day moving average (DMA) line and only -1% off its record high.
The major averages (M criteria) saw their uptrend come under recent pressure, however there remains a healthy level of market leadership (a large number of high-ranked stocks hitting new highs). If market conditions deteriorate, disciplined investors will reduce exposure and raise cash levels in their portfolios by selling stocks showing signs of deterioration on a case-by-case basis. New buying efforts should only be made in stocks meeting all fundamental and technical criteria of the fact-based investment system. The Featured Stocks Page lists noteworthy high-ranked leaders.
The major averages advanced, extending gains for a fourth-straight session after the White House released the 2018 proposed budget. In the proposal, the Trump administration is seeking to cut federal spending by $3.6 trillion over the next 10 years. On the data front, research firm Markit revealed that U.S. manufacturing PMI came in at 52.5 in May, below expectations. Separately, new home sales tumbled 11.4% last month, the biggest drop in more than two years. Overseas, European shares advanced as economic activity in the Eurozone expanded in May at the fastest pace since 2011.
Ten of 11 sectors in the S&P 500 ended in positive territory. Financials paced the gains with Bank of America (BAC +1.52%) edging higher. Technology stocks outperformed with Nokia (NOK 5.31%) after announcing a settlement to an intellectual property dispute with Apple (AAPL -0.12%). Take-Two Interactive Software (TTWO +5.49%) rose as the company reported better-than-expected quarterly revenue. In earnings, AutoZone (AZO -11.84%) gapped down and traded near its January 2015 low after the auto parts retailer missed estimates on the top and bottom lines.
Treasuries declined with the benchmark 10-year note down 9/32 to yield 2.29%. In commodities, NYMEX WTI crude added 0.7% to $51.47/barrel, a five-week high. In FOREX, the Dollar Index gained 0.4%. |
 Kenneth J. Gruneisen started out as a licensed stockbroker in August 1987, a couple of months prior to the historic stock market crash that took the Dow Jones Industrial Average down -22.6% in a single day. He has published daily fact-based fundamental and technical analysis on high-ranked stocks online for two decades. Through FACTBASEDINVESTING.COM, Kenneth provides educational articles, news, market commentary, and other information regarding proven investment systems that work in good times and bad.
Comments contained in the body of this report are technical opinions only and are not necessarily those of Gruneisen Growth Corp. The material herein has been obtained from sources believed to be reliable and accurate, however, its accuracy and completeness cannot be guaranteed. Our firm, employees, and customers may effect transactions, including transactions contrary to any recommendation herein, or have positions in the securities mentioned herein or options with respect thereto. Any recommendation contained in this report may not be suitable for all investors and it is not to be deemed an offer or solicitation on our part with respect to the purchase or sale of any securities. |
|
 |
Retail, Gold & Silver, and Tech Indexes Fell
Kenneth J. Gruneisen - Passed the CAN SLIM® Master's Exam
The financial indexes posted additional gains on Tuesday as the Bank Index ($BKX +1.31%) set a strong pace and the Broker/Dealer Index ($XBD +0.23%) edged higher. The Retail Index ($RLX -0.84%) created a drag on the major averages. The tech sector had a negative bias as the Semiconductor Index ($SOX -0.41%), Networking Index ($NWX -0.56%), and the Biotechnology Index ($BTK -0.25%) each ended slightly lower. The Gold & Silver index ($XAU -2.69%) suffered a large loss, meanwhile the Oil Services Index ($OSX -0.31%) edged lower and the Integrated Oil Index ($XOI +0.05%) finished flat. Charts courtesy www.stockcharts.com
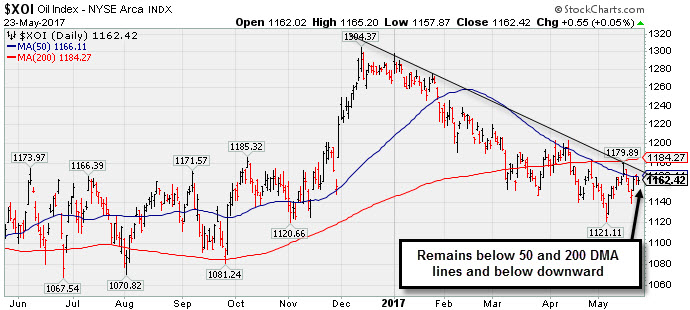 PICTURED: The Integrated Oil Index ($XOI +0.05%) remains below its 50-day and 200-day moving average (DMA) lines and below a multi-month downward trendline. Subsequent gains above those near term resistance areas would help the outlook for individual stocks in the group.
| Oil Services |
$OSX |
151.69 |
-0.48 |
-0.32% |
-17.47% |
| Integrated Oil |
$XOI |
1,162.42 |
+0.55 |
+0.05% |
-8.33% |
| Semiconductor |
$SOX |
1,067.94 |
-4.36 |
-0.41% |
+17.81% |
| Networking |
$NWX |
440.05 |
-2.47 |
-0.56% |
-1.36% |
| Broker/Dealer |
$XBD |
211.86 |
+0.48 |
+0.23% |
+3.21% |
| Retail |
$RLX |
1,498.67 |
-12.64 |
-0.84% |
+11.59% |
| Gold & Silver |
$XAU |
83.85 |
-2.31 |
-2.68% |
+6.33% |
| Bank |
$BKX |
91.41 |
+1.18 |
+1.31% |
-0.41% |
| Biotech |
$BTK |
3,622.40 |
-9.04 |
-0.25% |
+17.80% |
|
|
|
 |
In Tight Range Near All-Time High With Earnings News Due
Kenneth J. Gruneisen - Passed the CAN SLIM® Master's Exam
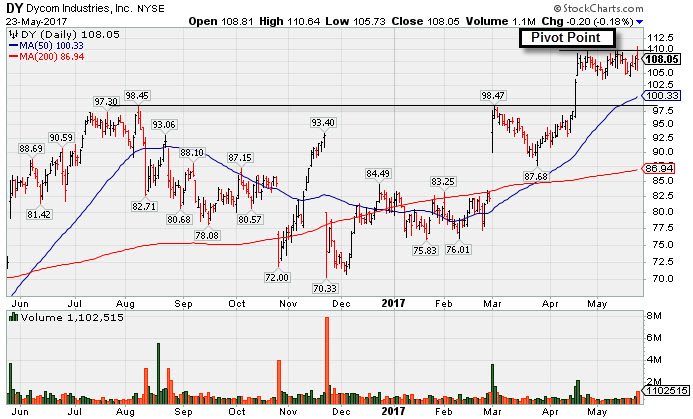
Dycom Inds Inc (DY -$0.20 or -0.18% to $108.05) was highlighted in yellow with pivot point based on its 5/10/17 high plus 10 cents in the earlier mid-day report (read here). It touched new 52-week and all-time highs today but ended the session little changed. It has formed an advanced three weeks tight base, holding its ground well above the prior base pattern. A convincing breakout with volume at least +40% above average may clinch a technical buy signal.
It is due to report Apr '17 quarterly earnings news prior to the open on Wednesday, 5/24/17. Volume and volatility often increase near earnings news. It reported earnings +52% on +25% sales revenues for Jan '17 quarter, well above the +25% minimum earnings guideline (C criteria) and prior growth has been strong. It has earned a 98 Earnings Per Share Rating, well above the 80+ minimum guideline for buy candidates, and the company has Return -On-Equity of 28%, well above the 17% minimum guideline.
The number of top-rated funds owning its shares rose from 430 in Jun '16 to 472 in Mar '17, and its current Up/Down Volume Ratio of 1.7 is an unbiased indication its shares have been under accumulation (I criteria) over the past 50 days. Its current Timeliness rating is A and Sponsorship rating is C.
Quarterly and annual earnings results include blue triangles beside the reported earnings figures on the datagraphs used in our analysis - the blue triangles are symbols indicating that pre-tax, non-recurring items were included (where possible, such items are normally removed to provide data better suited for comparison).
|
|
|
Color Codes Explained :
Y - Better candidates highlighted by our
staff of experts.
G - Previously featured
in past reports as yellow but may no longer be buyable under the
guidelines.
***Last / Change / Volume data in this table is the closing quote data***
Symbol/Exchange
Company Name
Industry Group |
PRICE |
CHANGE
(%Change) |
Day High |
Volume
(% DAV)
(% 50 day avg vol) |
52 Wk Hi
% From Hi |
Featured
Date |
Price
Featured |
Pivot Featured |
|
Max Buy |
SBCF
-
NASDAQ
Seacoast Banking Corp Fl
BANKING - Regional - Mid-Atlantic Banks
|
$23.23
|
+0.04
0.17% |
$23.35
|
225,717
68.19% of 50 DAV
50 DAV is 331,000
|
$25.88
-10.24%
|
4/24/2017
|
$25.33
|
PP = $24.38
|
|
MB = $25.60
|
Most Recent Note - 5/18/2017 1:13:20 PM
G - Managed a "positive reversal" after early losses undercutting the prior low ($21.89 on 3/22/17). A rebound above the 50 DMA line ($23.73) is needed for its outlook to improve.
>>> FEATURED STOCK ARTICLE : Pullback Following Recent Gains With Unimpressive Volume - 4/27/2017 |
View all notes |
Set NEW NOTE alert |
Company Profile |
SEC
News |
Chart |
Request a new note
C
A
S
I |
EW
-
NYSE
Edwards Lifesciences Cp
HEALTH SERVICES - Medical Appliances and Equipment
|
$113.54
|
-0.55
-0.48% |
$114.23
|
999,106
59.76% of 50 DAV
50 DAV is 1,672,000
|
$121.75
-6.74%
|
5/16/2017
|
$114.12
|
PP = $113.04
|
|
MB = $118.69
|
Most Recent Note - 5/22/2017 5:48:40 PM
Y - Posted a 3rd consecutive small gain with below average volume. Highlighted in yellow in the 5/16/17 mid-day report with a pivot point based on its 4/26/17 high after a cup-with-handle base.
>>> FEATURED STOCK ARTICLE : Some Overhead Supply Remains For High Ranked Medical Firm - 5/17/2017 |
View all notes |
Set NEW NOTE alert |
Company Profile |
SEC
News |
Chart |
Request a new note
C
A
S
I |
HTHT
-
NASDAQ
China Lodging Group Ads
LEISURE - Lodging
|
$75.84
|
+0.16
0.21% |
$76.42
|
117,806
54.29% of 50 DAV
50 DAV is 217,000
|
$81.01
-6.38%
|
9/29/2016
|
$46.12
|
PP = $47.82
|
|
MB = $50.21
|
Most Recent Note - 5/19/2017 12:44:17 PM
G - Extended from any sound base. Prior highs in the $64 area and its 50 DMA line define near-term support to watch.
>>> FEATURED STOCK ARTICLE : Traded Up 108% in 10 Months Since First Highlighted - 5/18/2017 |
View all notes |
Set NEW NOTE alert |
Company Profile |
SEC
News |
Chart |
Request a new note
C
A
S
I |
DY
-
NYSE
Dycom Inds Inc
MATERIALS and CONSTRUCTION - Heavy Construction
|
$108.05
|
-0.20
-0.18% |
$110.64
|
1,102,465
205.68% of 50 DAV
50 DAV is 536,000
|
$109.97
-1.75%
|
5/23/2017
|
$109.25
|
PP = $110.07
|
|
MB = $115.57
|
 Most Recent Note - 5/23/2017 6:53:30 PM
Y - Finished lower after highlighted in yellow with pivot point based on its 5/10/17 high plus 10 cents in the earlier mid-day report. A convincing breakout with volume may clinch a technical buy signal. Due to report Apr '17 quarterly earnings news before the open on Wednesday, 5/24/17. Volume and volatility often increase near earnings news. Reported earnings +52% on +25% sales revenues for Jan '17 quarter and prior growth has been strong. See the latest FSU analysis for more details and a new annotated graph.
>>> FEATURED STOCK ARTICLE : In Tight Range Near All-Time High With Earnings News Due - 5/23/2017 |
View all notes |
Set NEW NOTE alert |
Company Profile |
SEC
News |
Chart |
Request a new note
C
A
S
I |
BEAT
-
NASDAQ
BioTelemetry Inc
Medical-Services
|
$28.85
|
+0.50
1.76% |
$29.00
|
310,432
57.59% of 50 DAV
50 DAV is 539,000
|
$34.00
-15.15%
|
2/14/2017
|
$25.10
|
PP = $24.55
|
|
MB = $25.78
|
Most Recent Note - 5/19/2017 1:24:35 PM
G - Rebounding near its 50 DMA line ($29.23), and gains above that short-term average are needed for its outlook to improve. The 5/04/17 low $26.50 defines important near-term support to watch. Reported earnings -20% on +15% sales revenues for the Mar '17 quarter versus the year ago period, raising fundamental concerns.
>>> FEATURED STOCK ARTICLE : Extended From Sound Base and Earnings Below +25% Guideline - 5/3/2017 |
View all notes |
Set NEW NOTE alert |
Company Profile |
SEC
News |
Chart |
Request a new note
C
A
S
I |
Symbol/Exchange
Company Name
Industry Group |
PRICE |
CHANGE
(%Change) |
Day High |
Volume
(% DAV)
(% 50 day avg vol) |
52 Wk Hi
% From Hi |
Featured
Date |
Price
Featured |
Pivot Featured |
|
Max Buy |
ULTA
-
NASDAQ
Ulta Beauty Inc
SPECIALTY RETAIL - Specialty Retail, Other
|
$290.55
|
-4.39
-1.49% |
$296.40
|
921,542
173.22% of 50 DAV
50 DAV is 532,000
|
$301.40
-3.60%
|
5/5/2017
|
$293.17
|
PP = $289.37
|
|
MB = $303.84
|
Most Recent Note - 5/23/2017 6:58:51 PM
Y - Loss today on higher volume was action indicative of distributional pressure. Prior highs near the $289 area define important support above its 50 DMA line ($286).
>>> FEATURED STOCK ARTICLE : Holding Ground After Recent Gains Lacking Great Volume - 5/12/2017 |
View all notes |
Set NEW NOTE alert |
Company Profile |
SEC
News |
Chart |
Request a new note
C
A
S
I |
ESNT
-
NYSE
Essent Group Ltd
Finance-MrtgandRel Svc
|
$36.56
|
+0.56
1.56% |
$36.56
|
415,137
62.24% of 50 DAV
50 DAV is 667,000
|
$39.50
-7.44%
|
4/4/2017
|
$36.38
|
PP = $36.81
|
|
MB = $38.65
|
Most Recent Note - 5/22/2017 5:47:20 PM
G - Color code is changed to green while consolidating below its 50 DMA line ($36.59). Subsequent losses below the prior low ($34.08 on 5/05/17) would raise greater concerns and trigger a worrisome technical sell signal. A rebound above the 50 DMA line is needed fro its outlook to improve.
>>> FEATURED STOCK ARTICLE : Rebound Above 50-Day Moving Average Helped Outlook - 5/11/2017 |
View all notes |
Set NEW NOTE alert |
Company Profile |
SEC
News |
Chart |
Request a new note
C
A
S
I |
MTSI
-
NASDAQ
Macom Tech Solution Hldg
Elec-Semiconductor Mfg
|
$59.35
|
-1.49
-2.45% |
$60.99
|
1,313,418
181.41% of 50 DAV
50 DAV is 724,000
|
$61.45
-3.42%
|
5/16/2017
|
$52.52
|
PP = $53.89
|
|
MB = $56.58
|
Most Recent Note - 5/23/2017 6:55:24 PM
G - Pulled back today following considerable volume-driven gains. Extended after rallying above its "max buy" level. Prior highs in the $54-55 area define initial support to watch on pullbacks. Fundamentals remain strong through the Mar '17 quarter.
>>> FEATURED STOCK ARTICLE : Big Breakout Gain With More Than 5 Times Average Volume - 5/16/2017 |
View all notes |
Set NEW NOTE alert |
Company Profile |
SEC
News |
Chart |
Request a new note
C
A
S
I |
VEEV
-
NYSE
Veeva Systems Inc Cl A
Computer Sftwr-Medical
|
$60.49
|
-1.58
-2.55% |
$62.64
|
2,135,437
163.26% of 50 DAV
50 DAV is 1,308,000
|
$62.23
-2.80%
|
3/16/2017
|
$49.00
|
PP = $48.05
|
|
MB = $50.45
|
Most Recent Note - 5/22/2017 5:50:28 PM
G - Very extended from any sound base and hitting yet another new all-time high with above average volume behind today's 3rd consecutive gain. Its 50 DMA line ($52.54) defines support above prior highs in the $47-48 area.
>>> FEATURED STOCK ARTICLE : Wedging Into New High Territory, Extended From Sound Base - 5/15/2017 |
View all notes |
Set NEW NOTE alert |
Company Profile |
SEC
News |
Chart |
Request a new note
C
A
S
I |
ANET
-
NYSE
Arista Networks Inc
TELECOMMUNICATIONS - Communication Equipment
|
$143.20
|
+0.05
0.03% |
$144.03
|
814,410
104.01% of 50 DAV
50 DAV is 783,000
|
$148.60
-3.63%
|
4/17/2017
|
$132.75
|
PP = $135.27
|
|
MB = $142.03
|
Most Recent Note - 5/22/2017 5:45:30 PM
G - It remains extended from any sound base, consolidating above its 50 DMA line ($136.40) which defines near-term support to watch.
>>> FEATURED STOCK ARTICLE : Bullish Technical Action Following Recent Earnings - 5/8/2017 |
View all notes |
Set NEW NOTE alert |
Company Profile |
SEC
News |
Chart |
Request a new note
C
A
S
I |
Symbol/Exchange
Company Name
Industry Group |
PRICE |
CHANGE
(%Change) |
Day High |
Volume
(% DAV)
(% 50 day avg vol) |
52 Wk Hi
% From Hi |
Featured
Date |
Price
Featured |
Pivot Featured |
|
Max Buy |
GRUB
-
NYSE
Grubhub Inc
COMPUTER SOFTWARE and SERVICES - Technical and System Software
|
$42.73
|
-0.41
-0.95% |
$43.50
|
1,144,420
48.19% of 50 DAV
50 DAV is 2,375,000
|
$46.84
-8.76%
|
4/28/2017
|
$44.22
|
PP = $44.68
|
|
MB = $46.91
|
Most Recent Note - 5/22/2017 5:41:55 PM
Y - Recently stalled after hitting a new high and encountered mild distributional pressure. A confirming gain backed by at least +40% above average volume and strong close above the pivot point may clinch a technical buy signal. See the latest FSU analysis for more details and a new annotated graph.
>>> FEATURED STOCK ARTICLE : Stalled After Reaching New Highs and Encountered Mild Pressure - 5/22/2017 |
View all notes |
Set NEW NOTE alert |
Company Profile |
SEC
News |
Chart |
Request a new note
C
A
S
I |
IBP
-
NYSE
Installed Building Prod
DIVERSIFIED SERVICES - Business/Management Services
|
$48.50
|
-0.25
-0.51% |
$49.15
|
96,323
64.65% of 50 DAV
50 DAV is 149,000
|
$55.45
-12.53%
|
4/17/2017
|
$51.75
|
PP = $53.10
|
|
MB = $55.76
|
Most Recent Note - 5/19/2017 2:16:06 PM
G - Slumping near the recent low ($46.65 on 5/09/17). Prior highs in the $44 area define the next support level. A rebound above the 50 DMA line ($51.20) is needed for its outlook to improve.
>>> FEATURED STOCK ARTICLE : Due to Report Earnings Prior to Friday's Open - 5/4/2017 |
View all notes |
Set NEW NOTE alert |
Company Profile |
SEC
News |
Chart |
Request a new note
C
A
S
I |
NCOM
-
NASDAQ
National Commerce Corp
BANKING - Regional - Southeast Banks
|
$37.90
|
+0.15
0.40% |
$38.00
|
13,540
43.68% of 50 DAV
50 DAV is 31,000
|
$40.00
-5.25%
|
4/25/2017
|
$38.95
|
PP = $40.09
|
|
MB = $42.09
|
Most Recent Note - 5/18/2017 7:32:53 PM
G - Color code is changed to green after slumping to a close below its 50 DMA line ($37.37). Prior lows in the $35 area define the next important chart support level to watch. A subsequent rebound above the 50 DMA line gain and rally above the pivot point backed by a minimum of +40% above average volume may trigger a technical buy signal.
>>> FEATURED STOCK ARTICLE : Challenging 52-Week High With Volume-Driven Gains - 4/26/2017 |
View all notes |
Set NEW NOTE alert |
Company Profile |
SEC
News |
Chart |
Request a new note
C
A
S
I |
INGN
-
NASDAQ
Inogen Inc
HEALTH SERVICES - Medical Instruments and Supplies
|
$85.27
|
+1.24
1.48% |
$85.85
|
241,614
141.29% of 50 DAV
50 DAV is 171,000
|
$88.62
-3.77%
|
4/17/2017
|
$76.77
|
PP = $80.04
|
|
MB = $84.04
|
Most Recent Note - 5/23/2017 6:57:20 PM
Y - Posted a volume-driven gain today above its "max buy" level for a best-ever close and its color code is changed to green. Prior highs in the $79 area define support along with its 50 DMA line ($79.30). Fundamentals remain strong.
>>> FEATURED STOCK ARTICLE : Wedging Higher With Recent Gains Lacking Great Volume - 5/1/2017 |
View all notes |
Set NEW NOTE alert |
Company Profile |
SEC
News |
Chart |
Request a new note
C
A
S
I |
PLAY
-
NASDAQ
Dave & Buster's Ent Inc
Retail-Restaurants
|
$65.09
|
-1.16
-1.75% |
$66.28
|
875,675
117.54% of 50 DAV
50 DAV is 745,000
|
$67.83
-4.04%
|
2/23/2017
|
$55.41
|
PP = $58.35
|
|
MB = $61.27
|
Most Recent Note - 5/18/2017 7:35:30 PM
G - Perched near its all-time high, stubbornly holding its ground. Its 50 DMA line ($62.22) defines near-term support to watch on pullbacks. Latest quarter was below the +25% minimum guideline (C criteria), raising fundamental concerns.
>>> FEATURED STOCK ARTICLE : New Record High With Solid Gain on Near Average Volume - 5/2/2017 |
View all notes |
Set NEW NOTE alert |
Company Profile |
SEC
News |
Chart |
Request a new note
C
A
S
I |
Symbol/Exchange
Company Name
Industry Group |
PRICE |
CHANGE
(%Change) |
Day High |
Volume
(% DAV)
(% 50 day avg vol) |
52 Wk Hi
% From Hi |
Featured
Date |
Price
Featured |
Pivot Featured |
|
Max Buy |
OLLI
-
NASDAQ
Ollie's Bargain Outlet
Retail-DiscountandVariety
|
$41.10
|
+0.10
0.24% |
$41.35
|
363,799
56.84% of 50 DAV
50 DAV is 640,000
|
$41.30
-0.48%
|
3/27/2017
|
$32.80
|
PP = $33.55
|
|
MB = $35.23
|
Most Recent Note - 5/19/2017 5:30:10 PM
G - Challenged its all-time high today. Very extended from any sound base. Reported earnings +22% on +16% sales revenues for the Jan '17 quarter, below the +25% minimum earnings guideline (C criteria), raising fundamental concerns. Its 50 DMA line ($35.65) defines near-term support to watch. See the latest FSU analysis for more details and a new annotated graph.
>>> FEATURED STOCK ARTICLE : Retailer Rallied +25% in 2 Months Since Featured - 5/19/2017 |
View all notes |
Set NEW NOTE alert |
Company Profile |
SEC
News |
Chart |
Request a new note
C
A
S
I |
MOMO
-
NASDAQ
Momo Inc Ads Cl A
INTERNET - Content
|
$41.07
|
-1.76
-4.11% |
$45.20
|
27,409,633
509.38% of 50 DAV
50 DAV is 5,381,000
|
$45.95
-10.62%
|
3/7/2017
|
$29.71
|
PP = $27.83
|
|
MB = $29.22
|
Most Recent Note - 5/23/2017 1:15:32 PM
G - Pulling back with heavier volume today following a "negative reversal" on the prior session after hitting a new all-time high. Extended from any sound base. Its 50 DMA line ($36.98) defines important near-term support to watch.
>>> FEATURED STOCK ARTICLE : Hovering Near Record High, Extended From Prior Base - 5/9/2017 |
View all notes |
Set NEW NOTE alert |
Company Profile |
SEC
News |
Chart |
Request a new note
C
A
S
I |
HLI
-
NYSE
Houlihan Lokey Inc Cl A
Finance-Invest Bnk/Bkrs
|
$33.75
|
-0.53
-1.55% |
$34.43
|
137,418
58.73% of 50 DAV
50 DAV is 234,000
|
$36.65
-7.91%
|
5/10/2017
|
$35.85
|
PP = $35.05
|
|
MB = $36.80
|
Most Recent Note - 5/22/2017 5:43:50 PM
Y - Quietly consolidating above its 50 DMA line ($33.58) defining important near-term support. A subsequent violation would raise concerns and trigger a technical sell signal.
>>> FEATURED STOCK ARTICLE : Breakaway Gap Followed Strong Earnings News - 5/10/2017 |
View all notes |
Set NEW NOTE alert |
Company Profile |
SEC
News |
Chart |
Request a new note
C
A
S
I |
|
|
|
THESE ARE NOT BUY RECOMMENDATIONS!
Comments contained in the body of this report are technical
opinions only. The material herein has been obtained
from sources believed to be reliable and accurate, however,
its accuracy and completeness cannot be guaranteed.
This site is not an investment advisor, hence it does
not endorse or recommend any securities or other investments.
Any recommendation contained in this report may not
be suitable for all investors and it is not to be deemed
an offer or solicitation on our part with respect to
the purchase or sale of any securities. All trademarks,
service marks and trade names appearing in this report
are the property of their respective owners, and are
likewise used for identification purposes only.
This report is a service available
only to active Paid Premium Members.
You may opt-out of receiving report notifications
at any time. Questions or comments may be submitted
by writing to Premium Membership Services 665 S.E. 10 Street, Suite 201 Deerfield Beach, FL 33441-5634 or by calling 1-800-965-8307
or 954-785-1121.
|
|
|