You are not logged in.
This means you
CAN ONLY VIEW reports that were published prior to Monday, March 31, 2025.
You
MUST UPGRADE YOUR MEMBERSHIP if you want to see any current reports.
AFTER MARKET UPDATE - MONDAY, DECEMBER 20TH, 2021
Previous After Market Report Next After Market Report >>>
|
|
|
|
DOW |
-433.28 |
34,932.16 |
-1.23% |
|
Volume |
1,103,269,643 |
-68% |
|
Volume |
4,526,131,300 |
-40% |
|
NASDAQ |
-188.74 |
14,980.94 |
-1.24% |
|
Advancers |
636 |
20% |
|
Advancers |
1,287 |
29% |
|
S&P 500 |
-52.62 |
4,568.02 |
-1.14% |
|
Decliners |
2,572 |
80% |
|
Decliners |
3,226 |
71% |
|
Russell 2000 |
-34.06 |
2,139.87 |
-1.57% |
|
52 Wk Highs |
13 |
|
|
52 Wk Highs |
29 |
|
|
S&P 600 |
-20.27 |
1,324.88 |
-1.51% |
|
52 Wk Lows |
241 |
|
|
52 Wk Lows |
423 |
|
|
Leadership has been very thin as a notedly brief new rally has been followed by additional pressure. Great caution is advised until a new rally attempt and follow-through day establishes a confirmed uptrend again for the market (M criteria).
|
 |
More Weak Action Has Signaled a Continuing Market Correction
Kenneth J. Gruneisen - Passed the CAN SLIM® Master's Exam
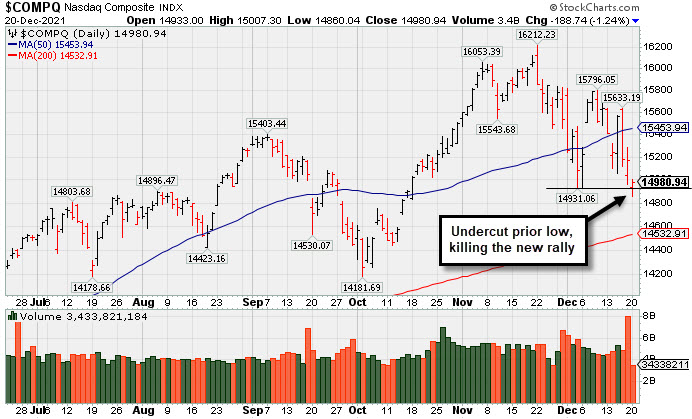
The S&P 500 slid 1.1%, closing below its 50-day moving average (a key technical level). The Nasdaq Composite fell 1.2%, and the Dow retreated 433 points. The volume totals reported were lighter than the prior session on the NYSE and on the Nasdaq exchange, as Friday's totals had been inflated by options expirations. Breadth was clearly negative as decliners led advancers by a 4-1 margin on the NYSE and by an 8-3 margin on the Nasdaq exchange. Leadership remained very thin as there were only 3 high-ranked companies from the Leaders List that hit new 52-week highs and were listed on the BreakOuts Page, versus the total of 9 on the prior session. New 52-week highs contracted and were solidly outnumbered by new 52-week lows on the NYSE and on the Nasdaq exchange. More weak action has signaled a continuing correction for the market averages (M criteria) after just a brief rally. New buying efforts are discouraged under the fact-based investment system until a new rally and follow-through day is noted.
 PICTURED: The Nasdaq Composite suffered another loss on Monday with lighter volume after heavy volume on Friday. The weak action undercut the Day 1 low (12/06/21 low) effectively killing the latest rally and continuing the prior market correction. Caution may be advised as the weak action does not bode well for the nascent rally.
U.S. stocks finished firmly lower on Monday as a number of factors incited a perceived risk off tone. The prospect of monetary policy tightening has recently sparked a rout in growth-related shares. On Capitol Hill, Senator Joe Manchin (who holds a pivotal vote in Congress) said he would not support the Biden administration’s $1.75 trillion social spending package. The headline dampened optimism about the likelihood of additional fiscal support, denting some analysts’ U.S. growth forecasts. Also souring the mood, a spike in global Omicron COVID-19 infections has caused more countries, particularly in Europe, to re-impose restrictions.
Treasuries were mixed, with the yield curve steepening. The benchmark 10-year note yield rose one basis point (0.01%) to 1.42%. On the data front, the leading index of economic indicators climbed a better-than-expected 1.1% in November. Later this week, updates on personal spending and the core PCE deflator (the Federal Reserve’s preferred proxy for inflation) will likely garner attention. In commodities, WTI crude fell 3.7% to $66.23/barrel, paring an intraday slump of more than 6% but still posting its biggest one-day decline of the month.
Nine of 11 S&P 500 sectors closed in negative territory, with the more cyclical groups lagging. In corporate news, Carnival Corp (CCL + 3.39%) rose as upbeat profitability forecasts overshadowed worries about the new coronavirus variant. Meanwhile, Oracle (ORCL -5.15%) slid after confirming it would purchase healthcare information technology company Cerner (CERN +0.80%) for $28.3 billion. |
 Kenneth J. Gruneisen started out as a licensed stockbroker in August 1987, a couple of months prior to the historic stock market crash that took the Dow Jones Industrial Average down -22.6% in a single day. He has published daily fact-based fundamental and technical analysis on high-ranked stocks online for two decades. Through FACTBASEDINVESTING.COM, Kenneth provides educational articles, news, market commentary, and other information regarding proven investment systems that work in good times and bad.
Comments contained in the body of this report are technical opinions only and are not necessarily those of Gruneisen Growth Corp. The material herein has been obtained from sources believed to be reliable and accurate, however, its accuracy and completeness cannot be guaranteed. Our firm, employees, and customers may effect transactions, including transactions contrary to any recommendation herein, or have positions in the securities mentioned herein or options with respect thereto. Any recommendation contained in this report may not be suitable for all investors and it is not to be deemed an offer or solicitation on our part with respect to the purchase or sale of any securities. |
|
 |
Financial, Retail, Tech, and Energy-Linked Groups Fell
Kenneth J. Gruneisen - Passed the CAN SLIM® Master's Exam
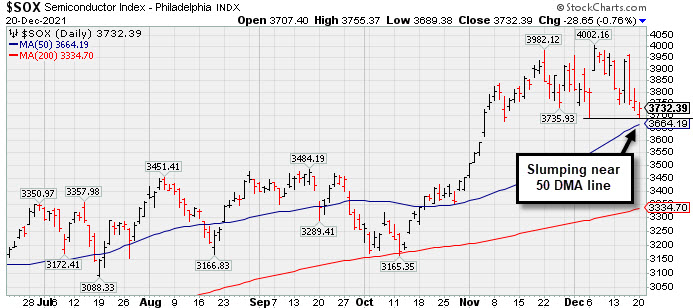
The Broker/Dealer Index ($XBD -2.39%) and Bank Index ($BKX -2.16%) both lost ground and weighed on the major averages. The Retail Index ($RLX -1.33%) also slumped. The Oil Services Index ($OSX -2.10%) and Integrated Oil Index ($XOI -1.25%) both lost ground while the Gold & Silver Index ($XAU -0.16%) did a better job of holding its ground. The tech sector was led lower by the Semiconductor Index ($SOX -0.76%) and Networking Index ($NWX -0.83%) while the Biotech Index ($BTK +0.19%) eked out a small gain.
PICTURED: The Semiconductor Index ($SOX -0.76%) has been slumping again toward its 50-day moving average (DMA) line.
| Oil Services |
$OSX |
50.23 |
-1.08 |
-2.10% |
+13.31% |
| Integrated Oil |
$XOI |
1,120.65 |
-14.22 |
-1.25% |
+41.41% |
| Semiconductor |
$SOX |
3,732.39 |
-28.65 |
-0.76% |
+33.51% |
| Networking |
$NWX |
922.10 |
-7.76 |
-0.83% |
+28.58% |
| Broker/Dealer |
$XBD |
467.15 |
-11.45 |
-2.39% |
+23.71% |
| Retail |
$RLX |
4,123.50 |
-55.70 |
-1.33% |
+15.72% |
| Gold & Silver |
$XAU |
126.38 |
-0.20 |
-0.16% |
-12.35% |
| Bank |
$BKX |
126.70 |
-2.80 |
-2.16% |
+29.40% |
| Biotech |
$BTK |
5,585.20 |
+10.57 |
+0.19% |
-2.68% |
|
|
|
 |
Quietly Slumping Into Prior Base and Below 50-Day Moving Average
Kenneth J. Gruneisen - Passed the CAN SLIM® Master's Exam
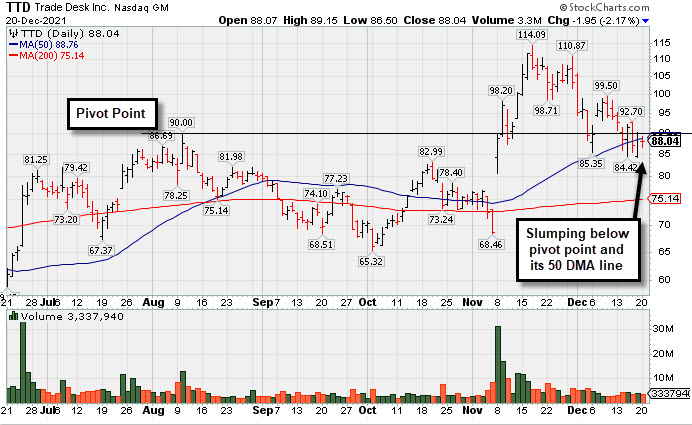
The Trade Desk Inc Cl A (TTD -$1.95 or -2.17% to $88.04) slumped today with below average volume. Weakness has been raising concerns, as it first undercut the prior high ($90), and it has recently sputtered below its 50 DMA line ($88.76). Those were noted as technically important support levels to watch. Only a prompt rebound above the 50 DMA line would help its outlook improve.
The Comml Svcs-Advertising firm was last shown in this FSU section on 11/09/21 with an annotated graph under the headline, "Powerful Volume-Driven Gains for New Highs". TTD was highlighted in yellow in the 11/09/21 mid-day report (read here) with new pivot point cited based on its 8/10/21 high after a 9-month cup-with-handle shaped base. Do not be confused as a 10:1 split impacted the share price as of 6/17/21. There are now 480.6 million shares outstanding (S criteria).
Its Earnings Per Share Rating is 99, the highest possible rating. Recently it reported Sep '21 quarterly earnings +38% on +39% sales revenues versus the year ago period, and prior quarterly comparisons showed very strong sales revenues and earnings increases well above the +25% minimum earnings guideline (C criteria). Annual earnings history has been strong.
The number of top-rated funds owning its shares rose from 280 in Mar '18 to 1,092 in Sep '21, a reassuring sign concerning the I criteria. Its current Up/Down Volume Ratio of 1.5 is an unbiased indication its shares have been under accumulation over the past 50 days. It has a Timeliness Rating of C and a Sponsorship Rating of A. |
|
|
Color Codes Explained :
Y - Better candidates highlighted by our
staff of experts.
G - Previously featured
in past reports as yellow but may no longer be buyable under the
guidelines.
***Last / Change / Volume data in this table is the closing quote data***
Symbol/Exchange
Company Name
Industry Group |
PRICE |
CHANGE
(%Change) |
Day High |
Volume
(% DAV)
(% 50 day avg vol) |
52 Wk Hi
% From Hi |
Featured
Date |
Price
Featured |
Pivot Featured |
|
Max Buy |
 BLDR
-
NYSE
BLDR
-
NYSE
Builders Firstsource Inc
Bldg-Constr Prds/Misc
|
$75.13
|
-1.70
-2.21% |
$75.61
|
2,946,942
120.04% of 50 DAV
50 DAV is 2,455,000
|
$80.95
-7.19%
|
8/12/2021
|
$52.38
|
PP = $54.09
|
|
MB = $56.79
|
Most Recent Note - 12/16/2021 5:36:45 PM
G - Stubbornly holding its ground near its all-time high after noted volume-driven gains, very extended from any sound base. Reported Sep '21 quarterly earnings +308% on +140% sales revenues versus the year ago period. It is well above its 50 DMA line ($66.13) which defines near-term support to watch.
>>> FEATURED STOCK ARTICLE : Perched at Record High After +52% Rally in 4 Months - 12/10/2021 |
View all notes |
Set NEW NOTE alert |
Company Profile |
SEC
News |
Chart |
Request a new note
C
A
S
I |
KFRC
-
NASDAQ
Kforce Inc
Comml Svcs-Staffing
|
$73.63
|
+0.45
0.61% |
$73.63
|
97,194
87.56% of 50 DAV
50 DAV is 111,000
|
$81.47
-9.62%
|
9/10/2021
|
$59.53
|
PP = $64.48
|
|
MB = $67.70
|
Most Recent Note - 12/15/2021 5:43:11 PM
G - Posted a solid gain today with average volume, finding prompt support at its 50 DMA line ($71.67). Recently reported Sep '21 quarterly earnings +8% on +10% sales revenues versus the year ago period, below the +25% minimum earnings guideline (C criteria), raising fundamental concerns.
>>> FEATURED STOCK ARTICLE : Extended From Base and Latest Quarter Earnings Growth Sub Par - 11/19/2021 |
View all notes |
Set NEW NOTE alert |
Company Profile |
SEC
News |
Chart |
Request a new note
C
A
S
I |
REGN
-
NASDAQ
Regeneron Pharmaceutical
DRUGS - Biotechnology
|
$603.14
|
-16.14
-2.61% |
$625.35
|
907,176
114.53% of 50 DAV
50 DAV is 792,100
|
$686.62
-12.16%
|
12/13/2021
|
$647.95
|
PP = $686.72
|
|
MB = $721.06
|
Most Recent Note - 12/16/2021 5:40:30 PM
Y - Suffered a big loss today with +61% above average volume raising concerns. Color code was recently changed to yellow with new pivot point cited based on its 9/01/21 high plus 10 cents. Subsequent gains above the pivot point backed by at least +40% above average volume may trigger a technical buy signal. Its Relative Strength rating has slumped to 84, but it is still above the 80+ minimum guideline for buy candidates.
>>> FEATURED STOCK ARTICLE : Consolidating Near All-Time High With Little Resistance Remaining - 12/13/2021 |
View all notes |
Set NEW NOTE alert |
Company Profile |
SEC
News |
Chart |
Request a new note
C
A
S
I |
LLY
-
NYSE
Eli Lilly & Co
Medical-Diversified
|
$263.48
|
-3.94
-1.47% |
$270.01
|
3,364,482
107.15% of 50 DAV
50 DAV is 3,140,000
|
$283.91
-7.20%
|
12/16/2021
|
$279.28
|
PP = $275.97
|
|
MB = $289.77
|
Most Recent Note - 12/17/2021 1:02:38 PM
Y - Retreating from its all-time high with today's loss after a streak of gains. Finished strong after highlighted in yellow in the prior mid-day report with pivot point cited based on its 8/17/21 high plus 10 cents. This giant Medical - Diversified firm triggered a technical buy signal as it powered to new all-time highs with +78% above average volume behind its 5th consecutive gain after a choppy 17-week consolidation. Reported Sep '21 quarterly earnings +38% on +18% sales revenues versus the year ago period, and 3 of the past 4 quarterly comparisons were above the +25% minimum earnings guideline (C criteria). Annual earnings (A criteria) improved steadily since a downturn in FY '14. See the latest FSU analysis for more details and an annotated graph.
>>> FEATURED STOCK ARTICLE : Eli Lilly & Co Powered to New Highs With Volume - 12/16/2021 |
View all notes |
Set NEW NOTE alert |
Company Profile |
SEC
News |
Chart |
Request a new note
C
A
S
I |
CAMT
-
NASDAQ
Camtek Ltd
ELECTRONICS - Scientific and Technical Instrum
|
$40.93
|
-0.92
-2.20% |
$41.51
|
142,379
54.97% of 50 DAV
50 DAV is 259,000
|
$49.60
-17.48%
|
11/9/2021
|
$45.43
|
PP = $46.11
|
|
MB = $48.42
|
Most Recent Note - 12/16/2021 5:46:54 PM
G - Reversed abruptly and slumped back below its DMA line ($42.57) today with lighter volume. Faces resistance due to overhead supply up to the $49 level. Fundamentals remain strong.
>>> FEATURED STOCK ARTICLE : Closed Above 50-Day Average After Big Gain With Light Volume - 12/15/2021 |
View all notes |
Set NEW NOTE alert |
Company Profile |
SEC
News |
Chart |
Request a new note
C
A
S
I |
Symbol/Exchange
Company Name
Industry Group |
PRICE |
CHANGE
(%Change) |
Day High |
Volume
(% DAV)
(% 50 day avg vol) |
52 Wk Hi
% From Hi |
Featured
Date |
Price
Featured |
Pivot Featured |
|
Max Buy |
AMD
-
NASDAQ
Advanced Micro Devices
ELECTRONICS - Semiconductor - Broad Line
|
$135.80
|
-1.95
-1.42% |
$138.26
|
37,946,832
66.92% of 50 DAV
50 DAV is 56,706,000
|
$164.46
-17.43%
|
10/27/2021
|
$124.91
|
PP = $122.59
|
|
MB = $128.72
|
Most Recent Note - 12/16/2021 5:34:54 PM
G - Erased much of the prior session's big gain as it reversed and suffered another big loss. Its 50 DMA line ($134.84) and prior low ($130.60 on 12/14/21) define important near term support where violations may trigger technical sell signals. Fundamentals remain strong after it reported Sep '21 quarterly earnings +78% on +54% sales revenues versus the year ago period.
>>> FEATURED STOCK ARTICLE : AMD Pulling Back After Considerable Rally - 12/1/2021 |
View all notes |
Set NEW NOTE alert |
Company Profile |
SEC
News |
Chart |
Request a new note
C
A
S
I |
UMC
-
NYSE
United Microelectrnc Adr
ELECTRONICS - Semiconductor - Integrated Cir
|
$10.93
|
-0.14
-1.26% |
$11.07
|
6,586,960
81.26% of 50 DAV
50 DAV is 8,106,000
|
$12.68
-13.80%
|
12/1/2021
|
$12.60
|
PP = $12.72
|
|
MB = $13.36
|
Most Recent Note - 12/16/2021 5:51:22 PM
Y - Pulled back today with higher volume retesting support near its 50 DMA line ($11.07). More damaging losses would raise concerns. A gain and solid close above the pivot point may help clinch a proper new (or add-on) technical buy signal. Reported Sep '21 quarterly earnings +100% on +30% sales revenues versus the year ago period.
>>> FEATURED STOCK ARTICLE : Rebound Above 50-Day Moving Average Showed Resilience - 11/30/2021 |
View all notes |
Set NEW NOTE alert |
Company Profile |
SEC
News |
Chart |
Request a new note
C
A
S
I |
ENTG
-
NASDAQ
Entegris Inc
ELECTRONICS - Semiconductor Equipment and Mate
|
$129.84
|
-3.12
-2.35% |
$133.43
|
1,140,150
99.40% of 50 DAV
50 DAV is 1,147,000
|
$158.00
-17.82%
|
8/4/2021
|
$125.33
|
PP = $126.51
|
|
MB = $132.84
|
Most Recent Note - 12/16/2021 5:45:11 PM
G - Suffered another damaging loss today with above average volume and finished weak, violating its 50 DMA line ($142) and triggering a technical sell signal. A rebound above the 50 DMA line is needed for its outlook to improve. Fundamentals remain strong after it recently reported Sep '21 quarterly earnings +37% on +20% sales revenues versus the year ago period.
>>> FEATURED STOCK ARTICLE : Best Ever Close After Volume-Driven Gain - 11/29/2021 |
View all notes |
Set NEW NOTE alert |
Company Profile |
SEC
News |
Chart |
Request a new note
C
A
S
I |
DHR
-
NYSE
Danaher Corp
Medical-Diversified
|
$314.29
|
+0.88
0.28% |
$315.74
|
2,899,837
109.63% of 50 DAV
50 DAV is 2,645,000
|
$333.96
-5.89%
|
12/16/2021
|
$321.36
|
PP = $334.06
|
|
MB = $350.76
|
Most Recent Note - 12/17/2021 5:34:56 PM
Y - Pulled back today with heavy volume, consolidating above its 50 DMA line and perched within striking distance of its 52-week high. Highlighted in yellow with pivot point cited base on its 9/10/21 high plus 10 cents in the 12/16/21 mid-day report. Subsequent gains above the pivot point with at least +40% above average volume may trigger a technical buy signal. Reported Sep '21 quarterly earnings +39% on +23% sales revenues versus the year ago period, its 6th strong comparison above the +25% minimum guideline (C criteria) and sales revenues growth has been strong. Annual earnings (A criteria) history has shown slow steady growth. Has a new CEO as of 9/01/20. See the latest FSU analysis for more details and a new annotated graph.
>>> FEATURED STOCK ARTICLE : Consolidating Near Prior Highs Above 50-Day Moving Average - 12/17/2021 |
View all notes |
Set NEW NOTE alert |
Company Profile |
SEC
News |
Chart |
Request a new note
C
A
S
I |
SKY
-
NYSE
Skyline Champion Corp
Bldg-Mobile/Mfg andamp; RV
|
$70.04
|
-1.82
-2.53% |
$70.84
|
778,892
170.44% of 50 DAV
50 DAV is 457,000
|
$85.92
-18.48%
|
11/3/2021
|
$72.19
|
PP = $66.92
|
|
MB = $70.27
|
 Most Recent Note - 12/20/2021 12:59:18 PM
G - Violated its 50 DMA line ($72.69) during a streak of 6 consecutive volume-driven losses. A prompt rebound above the 50 DMA line is needed for its outlook to improve. The next important near-term support to watch is prior highs in the $66 area. Fundamentals remain strong.
>>> FEATURED STOCK ARTICLE : Pulling Back From All-Time High After Recent Rally - 12/14/2021 |
View all notes |
Set NEW NOTE alert |
Company Profile |
SEC
News |
Chart |
Request a new note
C
A
S
I |
Symbol/Exchange
Company Name
Industry Group |
PRICE |
CHANGE
(%Change) |
Day High |
Volume
(% DAV)
(% 50 day avg vol) |
52 Wk Hi
% From Hi |
Featured
Date |
Price
Featured |
Pivot Featured |
|
Max Buy |
DHI
-
NYSE
D R Horton Inc
MATERIALS and CONSTRUCTION - Residential Construction
|
$101.38
|
-1.64
-1.59% |
$101.93
|
2,699,424
97.45% of 50 DAV
50 DAV is 2,770,000
|
$110.45
-8.21%
|
12/6/2021
|
$104.40
|
PP = $106.99
|
|
MB = $112.34
|
Most Recent Note - 12/16/2021 12:35:58 PM
Y - Posted a solid gain with +156% above average volume and closed above its pivot point on the prior session clinching a technical buy signal. Highlighted in yellow with pivot point cited based on its 5/10/21 high plus 10 cents in the 12/06/21 mid-day report. Reported Sep '21 earnings +68% on +27% sales revenues versus the year-ago period, its 8th strong quarterly comparison above the +25% minimum guideline (C criteria). Annual earnings growth (A criteria) has been strong. The market is in an uptrend (M criteria) and allows for new buying after Wednesday's bullish action confirmed the rally with a follow-through day.
>>> FEATURED STOCK ARTICLE : Builder Built a Solid Base And Challenged Prior High - 12/6/2021 |
View all notes |
Set NEW NOTE alert |
Company Profile |
SEC
News |
Chart |
Request a new note
C
A
S
I |
TITN
-
NASDAQ
Titan Machinery Inc
SPECIALTY RETAIL
|
$31.20
|
-0.71
-2.23% |
$31.48
|
196,402
113.53% of 50 DAV
50 DAV is 173,000
|
$38.58
-19.13%
|
11/23/2021
|
$36.22
|
PP = $35.34
|
|
MB = $37.11
|
Most Recent Note - 12/20/2021 12:01:21 PM
G - Gapped down today violating its 50 DMA line ($31.25) with a 3rd consecutive volume-driven loss triggering a technical sell signal. Only a prompt rebound above the 50 DMA line would help its outlook improve. Reported Oct '21 quarterly earnings +81% on +26% sales revenues over the year ago period, its 4th strong quarterly comparison.
>>> FEATURED STOCK ARTICLE : Strong Close With Gain Backed by +467% Above Average Volume - 11/23/2021 |
View all notes |
Set NEW NOTE alert |
Company Profile |
SEC
News |
Chart |
Request a new note
C
A
S
I |
CLFD
-
NASDAQ
Clearfield Inc
TELECOMMUNICATIONS - Cables / Satalite Equipment
|
$70.76
|
+0.93
1.33% |
$71.68
|
167,171
129.59% of 50 DAV
50 DAV is 129,000
|
$75.87
-6.74%
|
12/16/2021
|
$72.76
|
PP = $72.10
|
|
MB = $75.71
|
Most Recent Note - 12/17/2021 12:45:05 PM
Y - There was a "negative reversal" on the prior session after hitting a new all-time high and recently trading in a wider range intra-day. Color code was changed to yellow with new pivot point cited based on its 11/15/21 high plus 10 cents. Recently formed a "square box" base as it found support well above its 50 DMA line ($61) when consolidating. A gain and close above the pivot point backed by at least +40% above average volume may trigger a new (or add-on) technical buy signal. Reported Sep '21 quarterly earnings +141% on +66% sales revenues above the year ago period.
>>> FEATURED STOCK ARTICLE : Perched Near High Extended From Any Sound Base - 11/22/2021 |
View all notes |
Set NEW NOTE alert |
Company Profile |
SEC
News |
Chart |
Request a new note
C
A
S
I |
ODFL
-
NASDAQ
Old Dominion Fght Line
TRANSPORTATION - Trucking
|
$333.85
|
-6.77
-1.99% |
$338.50
|
762,053
125.54% of 50 DAV
50 DAV is 607,000
|
$373.58
-10.63%
|
12/7/2021
|
$365.61
|
PP = $364.17
|
|
MB = $382.38
|
Most Recent Note - 12/20/2021 12:04:24 PM
G - Violated its 50 DMA line ($340) with today's loss triggering a technical sell signal and its color code is changed to green. Only a prompt rebound above the 50 DMA line would help its outlook improve.
>>> FEATURED STOCK ARTICLE : Perched at All Time High After Tight Consolidation Several Weeks - 12/7/2021 |
View all notes |
Set NEW NOTE alert |
Company Profile |
SEC
News |
Chart |
Request a new note
C
A
S
I |
SMPL
-
NASDAQ
Simply Good Foods Co
Food-Confectionery
|
$38.57
|
-0.34
-0.87% |
$39.36
|
438,397
105.13% of 50 DAV
50 DAV is 417,000
|
$41.35
-6.72%
|
10/25/2021
|
$38.30
|
PP = $38.60
|
|
MB = $40.53
|
Most Recent Note - 12/20/2021 1:01:10 PM
G - Consolidating above its 50 DMA line ($38.04). The prior low and 200 DMA line ($35.54) define the next important support.
>>> FEATURED STOCK ARTICLE : Consolidating Above Prior High Following Recent Technical Breakout - 11/15/2021 |
View all notes |
Set NEW NOTE alert |
Company Profile |
SEC
News |
Chart |
Request a new note
C
A
S
I |
Symbol/Exchange
Company Name
Industry Group |
PRICE |
CHANGE
(%Change) |
Day High |
Volume
(% DAV)
(% 50 day avg vol) |
52 Wk Hi
% From Hi |
Featured
Date |
Price
Featured |
Pivot Featured |
|
Max Buy |
WDAY
-
NYSE
Workday Inc Cl A
Computer Sftwr-Enterprse
|
$269.70
|
-4.18
-1.53% |
$272.56
|
925,701
56.71% of 50 DAV
50 DAV is 1,632,300
|
$307.81
-12.38%
|
9/7/2021
|
$275.69
|
PP = $282.87
|
|
MB = $297.01
|
Most Recent Note - 12/16/2021 5:54:36 PM
G - Its Relative Strength Rating has fallen to 74, below the 80+ minimum guideline for buy candidates while now sputtering below its 50 DMA line ($280). A rebound above the 50 DMA line is needed for its outlook to improve. Prior low ($258.22 on 12/06/21) and 200 DMA line ($253.70) define the next important support to watch. Reported Oct '21 quarterly earnings +28% on +20% sales revenues versus the year ago period. Fundamentals remain strong.
>>> FEATURED STOCK ARTICLE : Getting Extended From Previously Noted Base - 11/16/2021 |
View all notes |
Set NEW NOTE alert |
Company Profile |
SEC
News |
Chart |
Request a new note
C
A
S
I |
CTLT
-
NYSE
"Catalent, Inc"
DRUGS - Biotechnology
|
$119.57
|
-5.80
-4.63% |
$124.91
|
2,465,877
255.56% of 50 DAV
50 DAV is 964,900
|
$142.64
-16.17%
|
8/25/2021
|
$128.72
|
PP = $127.78
|
|
MB = $134.17
|
Most Recent Note - 12/20/2021 11:56:55 AM
Violating the prior low ($119) and its 200 DMA line with today's damaging loss raising greater concerns and triggering technical sell signals. Its Relative Strength Rating is 72, below the 80+ minimum guideline for buy candidates. It will be dropped from the Featured Stocks list tonight.
>>> FEATURED STOCK ARTICLE : Recent Violation of 50-Day Moving Average Triggered Sell Signal - 11/11/2021 |
View all notes |
Set NEW NOTE alert |
Company Profile |
SEC
News |
Chart |
Request a new note
C
A
S
I |
TTD
-
NASDAQ
The Trade Desk Inc Cl A
Comml Svcs-Advertising
|
$88.04
|
-1.95
-2.17% |
$89.15
|
3,337,990
62.15% of 50 DAV
50 DAV is 5,371,000
|
$114.09
-22.83%
|
11/9/2021
|
$95.16
|
PP = $90.00
|
|
MB = $94.50
|
Most Recent Note - 12/20/2021 5:51:22 PM
G - It has quietly slumped below the prior high ($90) and below its 50 DMA line ($88.76) both which were noted as important support to watch. Only a prompt rebound above the 50 DMA line would help its outlook improve. See the latest FSU analysis for more details and a new annotated graph.
>>> FEATURED STOCK ARTICLE : Quietly Slumping Into Prior Base and Below 50-Day Moving Average - 12/20/2021 |
View all notes |
Set NEW NOTE alert |
Company Profile |
SEC
News |
Chart |
Request a new note
C
A
S
I |
MEDP
-
NASDAQ
Medpace Holdings Inc
Medical-Research Eqp/Svc
|
$213.74
|
-1.13
-0.53% |
$215.21
|
191,215
114.50% of 50 DAV
50 DAV is 167,000
|
$231.00
-7.47%
|
9/10/2021
|
$196.32
|
PP = $196.22
|
|
MB = $206.03
|
Most Recent Note - 12/15/2021 5:44:54 PM
G - Posted a solid gain today and rebounded above its 50 DMA line ($208.34) helping its outlook improve. Prior highs in the $199 area define important near-term support to watch. More damaging losses may trigger a worrisome technical sell signal. Recently noted repeatedly - "Sep '21 earnings rose +18% on +28% sales revenues versus the year ago period, below the +25% minimum earnings guideline (C criteria), raising fundamental concerns.
>>> FEATURED STOCK ARTICLE : Medpace Hovering at High With Volume Totals Cooling - 11/17/2021 |
View all notes |
Set NEW NOTE alert |
Company Profile |
SEC
News |
Chart |
Request a new note
C
A
S
I |
JEF
-
NYSE
Jefferies Financial Grp
Finance-Invest Bnk/Bkrs
|
$36.19
|
-1.25
-3.34% |
$36.86
|
1,091,771
70.99% of 50 DAV
50 DAV is 1,538,000
|
$44.47
-18.62%
|
6/28/2021
|
$31.81
|
PP = $34.42
|
|
MB = $36.14
|
Most Recent Note - 12/20/2021 12:56:20 PM
Slumping near its 200 DMA line ($35.35) with today's big loss. A rebound above the 50 DMA line ($40.73) is needed for its outlook to improve. It will be dropped from the Featured Stocks list tonight. Reported Aug '21 quarterly earnings +40% on +20% sales revenues versus the year ago period.
>>> FEATURED STOCK ARTICLE : Volume Totals Cooling While Lingering Below 50-Day Moving Average - 12/9/2021 |
View all notes |
Set NEW NOTE alert |
Company Profile |
SEC
News |
Chart |
Request a new note
C
A
S
I |
Symbol/Exchange
Company Name
Industry Group |
PRICE |
CHANGE
(%Change) |
Day High |
Volume
(% DAV)
(% 50 day avg vol) |
52 Wk Hi
% From Hi |
Featured
Date |
Price
Featured |
Pivot Featured |
|
Max Buy |
AVTR
-
NYSE
Avantor Inc
Medical-Research Eqp/Svc
|
$39.50
|
-0.40
-1.00% |
$39.97
|
5,315,745
136.58% of 50 DAV
50 DAV is 3,892,000
|
$44.37
-10.98%
|
6/10/2021
|
$32.94
|
PP = $34.09
|
|
MB = $35.79
|
Most Recent Note - 12/15/2021 5:46:34 PM
G - Posted a solid volume-driven gain today rebounding above its 50 DMA line ($39) helping its technical stance improve. Faces overhead supply up to the $44 level. Prior lows in the high $36 area define important near-term support. Reported Sep '21 quarterly earnings +46% above the year ago period. Completed a Secondary Offering on 9/13/21.
>>> FEATURED STOCK ARTICLE : Faces Resistance While Sputtering Below 50 DMA Line - 11/12/2021 |
View all notes |
Set NEW NOTE alert |
Company Profile |
SEC
News |
Chart |
Request a new note
C
A
S
I |
MIME
-
NASDAQ
Mimecast Limited
Computer Sftwr-Security
|
$78.93
|
-0.03
-0.04% |
$79.11
|
3,513,061
261.58% of 50 DAV
50 DAV is 1,343,000
|
$85.48
-7.66%
|
10/18/2021
|
$68.17
|
PP = $71.55
|
|
MB = $75.13
|
Most Recent Note - 12/20/2021 12:33:48 PM
G - Holding its ground after a gap up on 12/07/21 M&A news. Found prompt support at its 50 DMA line. More damaging losses would raise concerns and trigger technical sell signals.
>>> FEATURED STOCK ARTICLE : Extended From Latest Base While Fundamentals Remain Strong - 11/26/2021 |
View all notes |
Set NEW NOTE alert |
Company Profile |
SEC
News |
Chart |
Request a new note
C
A
S
I |
|
|
|
THESE ARE NOT BUY RECOMMENDATIONS!
Comments contained in the body of this report are technical
opinions only. The material herein has been obtained
from sources believed to be reliable and accurate, however,
its accuracy and completeness cannot be guaranteed.
This site is not an investment advisor, hence it does
not endorse or recommend any securities or other investments.
Any recommendation contained in this report may not
be suitable for all investors and it is not to be deemed
an offer or solicitation on our part with respect to
the purchase or sale of any securities. All trademarks,
service marks and trade names appearing in this report
are the property of their respective owners, and are
likewise used for identification purposes only.
This report is a service available
only to active Paid Premium Members.
You may opt-out of receiving report notifications
at any time. Questions or comments may be submitted
by writing to Premium Membership Services 665 S.E. 10 Street, Suite 201 Deerfield Beach, FL 33441-5634 or by calling 1-800-965-8307
or 954-785-1121.
|
|
|