You are not logged in.
This means you
CAN ONLY VIEW reports that were published prior to Sunday, March 30, 2025.
You
MUST UPGRADE YOUR MEMBERSHIP if you want to see any current reports.
AFTER MARKET UPDATE - TUESDAY, DECEMBER 14TH, 2021
Previous After Market Report Next After Market Report >>>
|
|
|
|
DOW |
-106.77 |
35,544.18 |
-0.30% |
|
Volume |
1,046,105,286 |
+2% |
|
Volume |
4,766,491,600 |
+6% |
|
NASDAQ |
-175.64 |
15,237.64 |
-1.14% |
|
Advancers |
962 |
29% |
|
Advancers |
1,318 |
29% |
|
S&P 500 |
-34.88 |
4,634.09 |
-0.75% |
|
Decliners |
2,332 |
71% |
|
Decliners |
3,261 |
71% |
|
Russell 2000 |
-20.85 |
2,159.65 |
-0.96% |
|
52 Wk Highs |
36 |
|
|
52 Wk Highs |
34 |
|
|
S&P 600 |
-7.92 |
1,346.07 |
-0.58% |
|
52 Wk Lows |
176 |
|
|
52 Wk Lows |
478 |
|
|
Concerns have grown as the major indices are now in a market correction (M criteria). Disciplined investors know to preserve capital by following sell rules designed to lock in gains and limit losses. New buying efforts should be avoided until a new confirmed rally is noted marked by a solid follow-through day.
|
 |
Indices' Losses on Higher Volume Indicate Distributional Pressure
Kenneth J. Gruneisen - Passed the CAN SLIM® Master's Exam
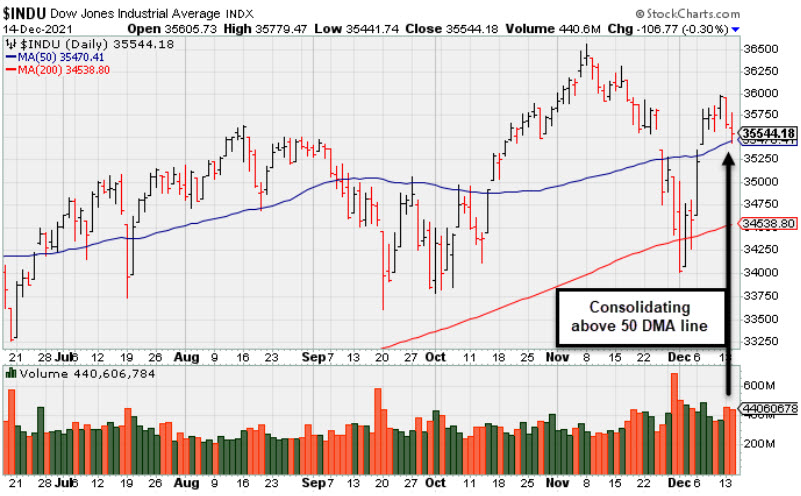
The S&P 500 fell 0.8%, while the tech-heavy Nasdaq Composite slumped 1.1%. The Dow lost 106 points, while the small-cap Russell 2000 dipped nearly 1%. The volume totals reported were higher than the prior session on the NYSE and on the Nasdaq exchange, indicative of greater institutional selling pressure. Breadth was negative as decliners led advancers by more than a 2-1 margin on the NYSE and by a 5-2 margin on the Nasdaq exchange. There were 7 high-ranked companies from the Leaders List that hit new 52-week highs and were listed on the BreakOuts Page versus 31 on the prior session. New 52-week lows totals expanded and outnumbered shrinking new 52-week highs totals on the NYSE and on the Nasdaq exchange. Recent weakness signaled a more worrisome market correction (M criteria). A proper follow-through day requires a solid gain from at least one of the major averages backed by higher volume coupled with an increase in the number of stocks hitting new 52-week highs over the prior session. Until then, investors are reminded to avoid new buying efforts and raise cash levels by selling stocks that weaken on a case-by-case basis as dictated by the rules of the fact-based investment system.
 PICTURED: The Dow Jones Industrial Average is consolidating above its 50-day moving average (DMA) line.
U.S. stocks finished lower on Tuesday as another hotter-than-expected inflation reading weighed on growth-oriented shares. On the data front, an update showed producer prices rose at the fastest pace since July last month (+0.8%), while the headline figure surged at a record 9.6% annual rate in November. Core PPI (excluding food and energy) also saw a higher-than-anticipated 7.7% increase from a year earlier. The elevated reading seemed to bolster the case for a faster tapering timeline from the Federal Reserve (Fed), which could open the door for interest rate hikes early next year. The U.S. central bank kicked off its two-day monetary policy meeting today, with Fed officials widely anticipated to announce plans to dial back their bond-buying program at a faster pace in light of ongoing price pressures. Treasuries weakened modestly, with the yield on the 10-year note up two basis points (0.02%) to 1.44%. In commodities, WTI crude declined 1.3% to $70.40/barrel.
Ten of 11 S&P 500 sectors closed in negative territory, with Technology shares leading decliners amid weakness in software names. Microsoft (MSFT -3.26%) suffered its worst day since September, while Adobe (ADBE -6.60%) fell after the latter was the subject of an analyst downgrade. Elsewhere, Tesla (TSLA -0.82%) fell following reports its CEO Elon Musk sold another $906.5 million worth of his stake in the electric car maker. Meanwhile, Financials bucked the downtrend, with the S&P 500 banks sub-index jumping 0.9%. |
 Kenneth J. Gruneisen started out as a licensed stockbroker in August 1987, a couple of months prior to the historic stock market crash that took the Dow Jones Industrial Average down -22.6% in a single day. He has published daily fact-based fundamental and technical analysis on high-ranked stocks online for two decades. Through FACTBASEDINVESTING.COM, Kenneth provides educational articles, news, market commentary, and other information regarding proven investment systems that work in good times and bad.
Comments contained in the body of this report are technical opinions only and are not necessarily those of Gruneisen Growth Corp. The material herein has been obtained from sources believed to be reliable and accurate, however, its accuracy and completeness cannot be guaranteed. Our firm, employees, and customers may effect transactions, including transactions contrary to any recommendation herein, or have positions in the securities mentioned herein or options with respect thereto. Any recommendation contained in this report may not be suitable for all investors and it is not to be deemed an offer or solicitation on our part with respect to the purchase or sale of any securities. |
|
 |
Financial Groups Rose on Widely Negative Session
Kenneth J. Gruneisen - Passed the CAN SLIM® Master's Exam
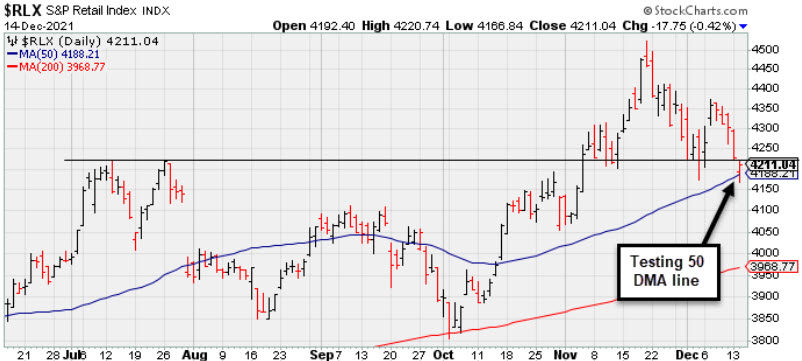
The Bank Index ($BKX +1.00%) and Broker/Dealer Index ($XBD +0.67%) both posted gains but the Retail Index ($RLX -0.42%) lost ground. The tech sector was led lower by the Networking Index ($NWX -1.31%) while the Semiconductor Index ($SOX -0.52%) also edged lower and the Biotech Index ($BTK -0.03%) finished flat. Commodity-linked groups had a negative bias as the Gold & Silver Index ($XAU -1.51%), Oil Services Index ($OSX -1.62%), and Integrated Oil Index ($XOI -0.36%) suffered unanimous losses.
PICTURED: The Retail Index ($RLX -0.42%) suffered a 5th consecutive loss testing its 50-day moving average (DMA) line.
| Oil Services |
$OSX |
51.83 |
-0.85 |
-1.62% |
+16.93% |
| Integrated Oil |
$XOI |
1,149.18 |
-4.13 |
-0.36% |
+45.01% |
| Semiconductor |
$SOX |
3,794.41 |
-20.02 |
-0.52% |
+35.73% |
| Networking |
$NWX |
906.83 |
-12.04 |
-1.31% |
+26.45% |
| Broker/Dealer |
$XBD |
477.19 |
+3.19 |
+0.67% |
+26.37% |
| Retail |
$RLX |
4,211.04 |
-17.75 |
-0.42% |
+18.18% |
| Gold & Silver |
$XAU |
122.28 |
-1.87 |
-1.51% |
-15.19% |
| Bank |
$BKX |
131.56 |
+1.30 |
+1.00% |
+34.37% |
| Biotech |
$BTK |
5,343.74 |
-1.64 |
-0.03% |
-6.89% |
|
|
|
 |
Pulling Back From All-Time High After Recent Rally
Kenneth J. Gruneisen - Passed the CAN SLIM® Master's Exam
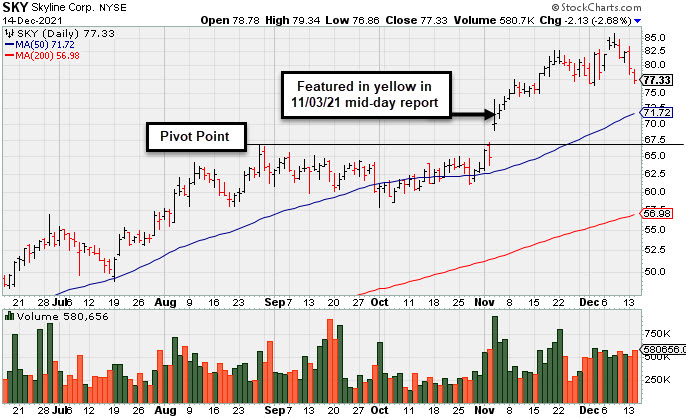
Skyline Corp (SKY -$2.13 or -2.68% to $77.33) suffered 2nd consecutive volume-driven loss today, encountering distributional pressure. Its 50-day moving average (DMA) line ($71.72) defines important near-term support to watch above prior highs in the $66 area.
SKY finished in the lower part of its intra-day range after highlighted in yellow with pivot point cited based on its 8/27/21 high plus 10 cents in the 11/03/21 mid-day report (read here). It was shown in greater detail that evening with an annotated graph under the headline, "Breakaway Gap After 10-Week Flat Base". Bullish action came after it reported Sep '21 quarterly earnings +187% on +63% sales revenues versus the year ago period. That marked its 3rd consecutive quarterly comparison well above the +25% minimum earnings guideline (C criteria). Its annual earnings (A criteria) history has been strong. It has the highest possible Earnings Per Share Rating of 99.
The number of top-rated funds owning its shares rose from 382 in Dec '20 to 434 in Sep '21,a reassuring sign concerning the I criteria. Its current Up/Down Volume Ratio of 2.0 is an unbiased indication its shares have been under accumulation over the past 50 days. It has a Timeliness Rating of A and a Sponsorship Rating of C.
|
|
|
Color Codes Explained :
Y - Better candidates highlighted by our
staff of experts.
G - Previously featured
in past reports as yellow but may no longer be buyable under the
guidelines.
***Last / Change / Volume data in this table is the closing quote data***
Symbol/Exchange
Company Name
Industry Group |
PRICE |
CHANGE
(%Change) |
Day High |
Volume
(% DAV)
(% 50 day avg vol) |
52 Wk Hi
% From Hi |
Featured
Date |
Price
Featured |
Pivot Featured |
|
Max Buy |
 BLDR
-
NYSE
BLDR
-
NYSE
Builders Firstsource Inc
Bldg-Constr Prds/Misc
|
$76.64
|
-0.80
-1.03% |
$77.63
|
2,879,690
127.99% of 50 DAV
50 DAV is 2,250,000
|
$80.95
-5.32%
|
8/12/2021
|
$52.38
|
PP = $54.09
|
|
MB = $56.79
|
Most Recent Note - 12/10/2021 5:00:43 PM
G - Perched at its all-time high after today's 5th consecutive volume-driven gain, very extended from any sound base. Reported Sep '21 quarterly earnings +308% on +140% sales revenues versus the year ago period. It is well above its 50 DMA line ($64.17). See the latest FSU analysis for more details and a new annotated graph.
>>> FEATURED STOCK ARTICLE : Perched at Record High After +52% Rally in 4 Months - 12/10/2021 |
View all notes |
Set NEW NOTE alert |
Company Profile |
SEC
News |
Chart |
Request a new note
C
A
S
I |
KFRC
-
NASDAQ
Kforce Inc
Comml Svcs-Staffing
|
$71.61
|
-0.34
-0.47% |
$72.76
|
257,135
242.58% of 50 DAV
50 DAV is 106,000
|
$81.47
-12.10%
|
9/10/2021
|
$59.53
|
PP = $64.48
|
|
MB = $67.70
|
Most Recent Note - 12/13/2021 5:16:11 PM
G - Consolidating above its 50 DMA line ($71.27) which defines important near-term support to watch. Recently reported Sep '21 quarterly earnings +8% on +10% sales revenues versus the year ago period, below the +25% minimum earnings guideline (C criteria), raising fundamental concerns.
>>> FEATURED STOCK ARTICLE : Extended From Base and Latest Quarter Earnings Growth Sub Par - 11/19/2021 |
View all notes |
Set NEW NOTE alert |
Company Profile |
SEC
News |
Chart |
Request a new note
C
A
S
I |
REGN
-
NASDAQ
Regeneron Pharmaceutical
DRUGS - Biotechnology
|
$670.97
|
+10.82
1.64% |
$673.86
|
711,353
91.79% of 50 DAV
50 DAV is 775,000
|
$686.62
-2.28%
|
12/13/2021
|
$647.95
|
PP = $686.72
|
|
MB = $721.06
|
Most Recent Note - 12/13/2021 1:00:05 PM
Y - Color code is changed to yellow with new pivot point cited based on its 9/01/21 high plus 10 cents. Gapped down today yet it remains perched within striking distance of its all-time high. Subsequent gains above the pivot point backed by at least +40% above average volume may trigger a technical buy signal. Its Relative Strength rating has improved to 90, well above the 80+ minimum guideline for buy candidates. Found support at its 200 DMA line and rebounded since dropped from the Featured Stocks List on 10/01/21. The market direction (M criteria) remains a concern regarding any new buying until a new confirmed rally with a follow-through day."
>>> FEATURED STOCK ARTICLE : Consolidating Near All-Time High With Little Resistance Remaining - 12/13/2021 |
View all notes |
Set NEW NOTE alert |
Company Profile |
SEC
News |
Chart |
Request a new note
C
A
S
I |
CAMT
-
NASDAQ
Camtek Ltd
ELECTRONICS - Scientific and Technical Instrum
|
$41.05
|
-1.71
-4.00% |
$42.20
|
315,231
123.14% of 50 DAV
50 DAV is 256,000
|
$49.60
-17.24%
|
11/9/2021
|
$45.43
|
PP = $46.11
|
|
MB = $48.42
|
 Most Recent Note - 12/14/2021 1:43:30 PM
G - Color code is changed to green after violating its 50 DMA line ($42.45) as today's 4th consecutive loss backed by ever-increasing volume raises greater concerns. Only a prompt rebound above the 50 DMA line would help its outlook improve. Fundamentals remain strong.
>>> FEATURED STOCK ARTICLE : Rebound Above 50-Day Moving Average Helped Outlook - 11/5/2021 |
View all notes |
Set NEW NOTE alert |
Company Profile |
SEC
News |
Chart |
Request a new note
C
A
S
I |
AMD
-
NASDAQ
Advanced Micro Devices
ELECTRONICS - Semiconductor - Broad Line
|
$135.60
|
+1.80
1.35% |
$137.24
|
50,497,274
91.91% of 50 DAV
50 DAV is 54,942,000
|
$164.46
-17.55%
|
10/27/2021
|
$124.91
|
PP = $122.59
|
|
MB = $128.72
|
Most Recent Note - 12/13/2021 5:21:43 PM
G - Suffered another big loss today with below average volume, testing its 50 DMA line ($132.54) which defines important support to watch. Fundamentals remain strong after it reported Sep '21 quarterly earnings +78% on +54% sales revenues versus the year ago period.
>>> FEATURED STOCK ARTICLE : AMD Pulling Back After Considerable Rally - 12/1/2021 |
View all notes |
Set NEW NOTE alert |
Company Profile |
SEC
News |
Chart |
Request a new note
C
A
S
I |
Symbol/Exchange
Company Name
Industry Group |
PRICE |
CHANGE
(%Change) |
Day High |
Volume
(% DAV)
(% 50 day avg vol) |
52 Wk Hi
% From Hi |
Featured
Date |
Price
Featured |
Pivot Featured |
|
Max Buy |
UMC
-
NYSE
United Microelectrnc Adr
ELECTRONICS - Semiconductor - Integrated Cir
|
$11.08
|
+0.07
0.64% |
$11.10
|
6,197,008
74.86% of 50 DAV
50 DAV is 8,278,200
|
$12.68
-12.62%
|
12/1/2021
|
$12.60
|
PP = $12.72
|
|
MB = $13.36
|
Most Recent Note - 12/14/2021 5:30:43 PM
Y - New pivot point cited was based on its 9/03/21 high plus 10 cents. Recently pulled back near its 50 DMA line ($11.05) which defines near-term support. More damaging losses would raise concerns. A gain and solid close above the pivot point may clinch a new (or add-on) technical buy signal. Reported Sep '21 quarterly earnings +100% on +30% sales revenues versus the year ago period. Recently found support above its 200 DMA line ($10.16).
>>> FEATURED STOCK ARTICLE : Rebound Above 50-Day Moving Average Showed Resilience - 11/30/2021 |
View all notes |
Set NEW NOTE alert |
Company Profile |
SEC
News |
Chart |
Request a new note
C
A
S
I |
ENTG
-
NASDAQ
Entegris Inc
ELECTRONICS - Semiconductor Equipment and Mate
|
$143.22
|
+0.94
0.66% |
$144.13
|
757,004
72.79% of 50 DAV
50 DAV is 1,040,000
|
$158.00
-9.35%
|
8/4/2021
|
$125.33
|
PP = $126.51
|
|
MB = $132.84
|
Most Recent Note - 12/9/2021 6:10:38 PM
G - Extended from any sound base, consolidating above its 50 DMA line ($140) which defines important near-term support to watch. Fundamentals remain strong after it recently reported Sep '21 quarterly earnings +37% on +20% sales revenues versus the year ago period.
>>> FEATURED STOCK ARTICLE : Best Ever Close After Volume-Driven Gain - 11/29/2021 |
View all notes |
Set NEW NOTE alert |
Company Profile |
SEC
News |
Chart |
Request a new note
C
A
S
I |
SKY
-
NYSE
Skyline Champion Corp
Bldg-Mobile/Mfg andamp; RV
|
$77.33
|
-2.13
-2.68% |
$79.34
|
589,866
144.93% of 50 DAV
50 DAV is 407,000
|
$85.92
-10.00%
|
11/3/2021
|
$72.19
|
PP = $66.92
|
|
MB = $70.27
|
Most Recent Note - 12/14/2021 5:26:51 PM
G - Suffered a 2nd consecutive volume-driven loss today, encountering distributional pressure. Its 50 DMA line ($71.72) defines important near-term support to watch above prior highs in the $66 area. Fundamentals remain strong. See the latest FSU analysis for more details and a new annotated graph.
>>> FEATURED STOCK ARTICLE : Pulling Back From All-Time High After Recent Rally - 12/14/2021 |
View all notes |
Set NEW NOTE alert |
Company Profile |
SEC
News |
Chart |
Request a new note
C
A
S
I |
DHI
-
NYSE
D R Horton Inc
MATERIALS and CONSTRUCTION - Residential Construction
|
$104.74
|
-3.28
-3.04% |
$106.80
|
4,155,684
164.97% of 50 DAV
50 DAV is 2,519,000
|
$110.45
-5.17%
|
12/6/2021
|
$104.40
|
PP = $106.99
|
|
MB = $112.34
|
Most Recent Note - 12/14/2021 1:03:39 PM
Y - Pulling back with higher volume after reaching a new all-time high with its 12/10/21 gain backed by +31% above average volume. Highlighted in yellow with pivot point cited based on its 5/10/21 high plus 10 cents in the 12/06/21 mid-day report. Reported Sep '21 earnings +68% on +27% sales revenues versus the year-ago period, its 8th strong quarterly comparison above the +25% minimum guideline (C criteria). Annual earnings growth (A criteria) has been strong. The market direction (M criteria) remains a concern regarding any new buying until a new confirmed rally with a follow-through day.
>>> FEATURED STOCK ARTICLE : Builder Built a Solid Base And Challenged Prior High - 12/6/2021 |
View all notes |
Set NEW NOTE alert |
Company Profile |
SEC
News |
Chart |
Request a new note
C
A
S
I |
TITN
-
NASDAQ
Titan Machinery Inc
SPECIALTY RETAIL
|
$32.91
|
+0.23
0.70% |
$33.38
|
217,931
135.36% of 50 DAV
50 DAV is 161,000
|
$38.58
-14.70%
|
11/23/2021
|
$36.22
|
PP = $35.34
|
|
MB = $37.11
|
Most Recent Note - 12/13/2021 5:23:25 PM
G - Suffered another loss today on higher (near average) volume, still slumping back into the prior base. Reported Oct '21 quarterly earnings +81% on +26% sales revenues over the year ago period, its 4th strong quarterly comparison.
>>> FEATURED STOCK ARTICLE : Strong Close With Gain Backed by +467% Above Average Volume - 11/23/2021 |
View all notes |
Set NEW NOTE alert |
Company Profile |
SEC
News |
Chart |
Request a new note
C
A
S
I |
Symbol/Exchange
Company Name
Industry Group |
PRICE |
CHANGE
(%Change) |
Day High |
Volume
(% DAV)
(% 50 day avg vol) |
52 Wk Hi
% From Hi |
Featured
Date |
Price
Featured |
Pivot Featured |
|
Max Buy |
CLFD
-
NASDAQ
Clearfield Inc
TELECOMMUNICATIONS - Cables / Satalite Equipment
|
$66.06
|
+2.85
4.51% |
$66.58
|
139,333
109.71% of 50 DAV
50 DAV is 127,000
|
$72.00
-8.25%
|
7/23/2021
|
$40.23
|
PP = $43.74
|
|
MB = $45.93
|
Most Recent Note - 12/14/2021 5:36:05 PM
G - Posted a big gain today with higher (near average) volume. Recently consolidating above its 50 DMA line ($60) which defines near-term support to watch. Reported Sep '21 quarterly earnings +141% on +66% sales revenues above the year ago period.
>>> FEATURED STOCK ARTICLE : Perched Near High Extended From Any Sound Base - 11/22/2021 |
View all notes |
Set NEW NOTE alert |
Company Profile |
SEC
News |
Chart |
Request a new note
C
A
S
I |
ODFL
-
NASDAQ
Old Dominion Fght Line
TRANSPORTATION - Trucking
|
$352.08
|
-6.84
-1.91% |
$358.01
|
540,287
91.73% of 50 DAV
50 DAV is 589,000
|
$373.58
-5.76%
|
12/7/2021
|
$365.61
|
PP = $364.17
|
|
MB = $382.38
|
Most Recent Note - 12/13/2021 5:17:35 PM
Y - Hovering in a tight range near its all-time high. Subsequent volume-driven gains are needed to clinch a buy signal, and the broader market direction (M criteria) remains a concern until a follow-through day. Reported earnings +44% on +32% sales revenues for the Sep '21 quarter, its 5th consecutive comparison above the +25% minimum guideline (C criteria).
>>> FEATURED STOCK ARTICLE : Perched at All Time High After Tight Consolidation Several Weeks - 12/7/2021 |
View all notes |
Set NEW NOTE alert |
Company Profile |
SEC
News |
Chart |
Request a new note
C
A
S
I |
ENPH
-
NASDAQ
Enphase Energy Inc
Energy-Solar
|
$202.32
|
-11.20
-5.25% |
$206.19
|
3,415,276
140.72% of 50 DAV
50 DAV is 2,427,000
|
$282.46
-28.37%
|
10/28/2021
|
$218.00
|
PP = $229.14
|
|
MB = $240.60
|
Most Recent Note - 12/14/2021 1:35:08 PM
Gapped down today violating its 50 DMA line ($215.84) and undercutting the prior low, raising serious concerns and triggering a technical sell signal. Only a prompt rebound above the 50 DMA line would help its outlook improve. It will be dropped from the Featured Stocks list tonight.
>>> FEATURED STOCK ARTICLE : Pullback Testing Near Prior High - 12/2/2021 |
View all notes |
Set NEW NOTE alert |
Company Profile |
SEC
News |
Chart |
Request a new note
C
A
S
I |
SMPL
-
NASDAQ
Simply Good Foods Co
Food-Confectionery
|
$37.92
|
+0.24
0.64% |
$38.04
|
225,764
61.02% of 50 DAV
50 DAV is 370,000
|
$41.35
-8.30%
|
10/25/2021
|
$38.30
|
PP = $38.60
|
|
MB = $40.53
|
Most Recent Note - 12/14/2021 5:28:42 PM
G - Still sputtering near its 50 DMA line ($37.83). The prior low and 200 DMA line ($35.37) define the next important support.
>>> FEATURED STOCK ARTICLE : Consolidating Above Prior High Following Recent Technical Breakout - 11/15/2021 |
View all notes |
Set NEW NOTE alert |
Company Profile |
SEC
News |
Chart |
Request a new note
C
A
S
I |
WDAY
-
NASDAQ
Workday Inc Cl A
Computer Sftwr-Enterprse
|
$273.35
|
-7.57
-2.69% |
$277.91
|
1,633,821
102.89% of 50 DAV
50 DAV is 1,588,000
|
$307.81
-11.20%
|
9/7/2021
|
$275.69
|
PP = $282.87
|
|
MB = $297.01
|
Most Recent Note - 12/14/2021 1:46:25 PM
G - Color code is changed to green after slumping below its 50 DMA line ($279) with today's big loss. Prior low ($258.22 on 12/06/21) and 200 DMA line ($253.25) define the next important support to watch. Reported Oct '21 quarterly earnings +28% on +20% sales revenues versus the year ago period. Fundamentals remain strong.
>>> FEATURED STOCK ARTICLE : Getting Extended From Previously Noted Base - 11/16/2021 |
View all notes |
Set NEW NOTE alert |
Company Profile |
SEC
News |
Chart |
Request a new note
C
A
S
I |
Symbol/Exchange
Company Name
Industry Group |
PRICE |
CHANGE
(%Change) |
Day High |
Volume
(% DAV)
(% 50 day avg vol) |
52 Wk Hi
% From Hi |
Featured
Date |
Price
Featured |
Pivot Featured |
|
Max Buy |
CTLT
-
NYSE
"Catalent, Inc"
DRUGS - Biotechnology
|
$122.38
|
-2.50
-2.00% |
$123.76
|
716,659
77.95% of 50 DAV
50 DAV is 919,400
|
$142.64
-14.20%
|
8/25/2021
|
$128.72
|
PP = $127.78
|
|
MB = $134.17
|
Most Recent Note - 12/14/2021 5:36:45 PM
G - A rebound above its 50 DMA line ($129) is needed for its outlook to improve. Tested near the prior low ($119) and 200 DMA line ($118) which define important near-term support to watch. More damaging losses would raise greater concerns. Its Relative Strength Rating is 72, above the 80+ minimum guideline for buy candidates. Fundamentals remain strong after it reported Sep '21 quarterly earnings +65% on +21% sales revenues versus the year ago period, continuing its strong earnings track record.
>>> FEATURED STOCK ARTICLE : Recent Violation of 50-Day Moving Average Triggered Sell Signal - 11/11/2021 |
View all notes |
Set NEW NOTE alert |
Company Profile |
SEC
News |
Chart |
Request a new note
C
A
S
I |
TTD
-
NASDAQ
The Trade Desk Inc Cl A
Comml Svcs-Advertising
|
$88.33
|
-4.17
-4.51% |
$91.40
|
4,132,637
77.77% of 50 DAV
50 DAV is 5,314,000
|
$114.09
-22.58%
|
11/9/2021
|
$95.16
|
PP = $90.00
|
|
MB = $94.50
|
Most Recent Note - 12/14/2021 1:37:24 PM
G - Undercut the prior high ($90) and today's 4th consecutive loss with light volume is testing its 50 DMA line ($87.14) which defines important support to watch.
>>> FEATURED STOCK ARTICLE : Powerful Volume-Driven Gains for New Highs - 11/9/2021 |
View all notes |
Set NEW NOTE alert |
Company Profile |
SEC
News |
Chart |
Request a new note
C
A
S
I |
MEDP
-
NASDAQ
Medpace Holdings Inc
Medical-Research Eqp/Svc
|
$202.50
|
-3.76
-1.82% |
$204.81
|
136,810
86.04% of 50 DAV
50 DAV is 159,000
|
$231.00
-12.34%
|
9/10/2021
|
$196.32
|
PP = $196.22
|
|
MB = $206.03
|
Most Recent Note - 12/14/2021 5:33:14 PM
G - Prior highs in the $199 area define important near-term support to watch. Pulled back further below its 50 DMA line ($208) with today's loss on below average volume. More damaging losses may trigger a worrisome technical sell signal. Recently noted repeatedly - "Sep '21 earnings rose +18% on +28% sales revenues versus the year ago period, below the +25% minimum earnings guideline (C criteria), raising fundamental concerns.
>>> FEATURED STOCK ARTICLE : Medpace Hovering at High With Volume Totals Cooling - 11/17/2021 |
View all notes |
Set NEW NOTE alert |
Company Profile |
SEC
News |
Chart |
Request a new note
C
A
S
I |
JEF
-
NYSE
Jefferies Financial Grp
Finance-Invest Bnk/Bkrs
|
$38.50
|
+0.97
2.58% |
$38.89
|
1,507,678
97.58% of 50 DAV
50 DAV is 1,545,000
|
$44.47
-13.42%
|
6/28/2021
|
$31.81
|
PP = $34.42
|
|
MB = $36.14
|
Most Recent Note - 12/9/2021 5:56:09 PM
G - Still sputtering with volume totals cooling, meanwhile, a rebound above the 50 DMA line ($40.83) is needed for its outlook to improve. Reported Aug '21 quarterly earnings +40% on +20% sales revenues versus the year ago period. See the latest FSU analysis for more details and a new annotated graph.
>>> FEATURED STOCK ARTICLE : Volume Totals Cooling While Lingering Below 50-Day Moving Average - 12/9/2021 |
View all notes |
Set NEW NOTE alert |
Company Profile |
SEC
News |
Chart |
Request a new note
C
A
S
I |
AVTR
-
NYSE
Avantor Inc
Medical-Research Eqp/Svc
|
$38.33
|
-0.86
-2.19% |
$39.07
|
3,701,265
101.60% of 50 DAV
50 DAV is 3,643,000
|
$44.37
-13.61%
|
6/10/2021
|
$32.94
|
PP = $34.09
|
|
MB = $35.79
|
Most Recent Note - 12/14/2021 5:34:44 PM
G - Suffered a 4th consecutive loss today with higher volume, slumping below its 50 DMA line ($39). Faces overhead supply up to the $44 level. Prior lows in the high $36 area define important near-term support. Reported Sep '21 quarterly earnings +46% above the year ago period. Completed a Secondary Offering on 9/13/21.
>>> FEATURED STOCK ARTICLE : Faces Resistance While Sputtering Below 50 DMA Line - 11/12/2021 |
View all notes |
Set NEW NOTE alert |
Company Profile |
SEC
News |
Chart |
Request a new note
C
A
S
I |
Symbol/Exchange
Company Name
Industry Group |
PRICE |
CHANGE
(%Change) |
Day High |
Volume
(% DAV)
(% 50 day avg vol) |
52 Wk Hi
% From Hi |
Featured
Date |
Price
Featured |
Pivot Featured |
|
Max Buy |
MIME
-
NASDAQ
Mimecast Limited
Computer Sftwr-Security
|
$79.46
|
+0.22
0.28% |
$79.49
|
4,544,745
475.39% of 50 DAV
50 DAV is 956,000
|
$85.48
-7.04%
|
10/18/2021
|
$68.17
|
PP = $71.55
|
|
MB = $75.13
|
Most Recent Note - 12/14/2021 1:20:28 PM
G - Holding its ground after gapping up on 12/07/21 M&A news. Found prompt support at its 50 DMA line ($74.82). More damaging losses would raise concerns and trigger technical sell signals.
>>> FEATURED STOCK ARTICLE : Extended From Latest Base While Fundamentals Remain Strong - 11/26/2021 |
View all notes |
Set NEW NOTE alert |
Company Profile |
SEC
News |
Chart |
Request a new note
C
A
S
I |
AZTA
-
NASDAQ
"Azenta, Inc."
ELECTRONICS - Semiconductor Equipment
|
$96.90
|
-3.61
-3.59% |
$100.00
|
752,240
138.99% of 50 DAV
50 DAV is 541,200
|
$124.79
-22.35%
|
9/20/2021
|
$101.21
|
PP = $108.82
|
|
MB = $114.26
|
Most Recent Note - 12/14/2021 1:40:32 PM
Testing its 200 DMA line ($96.52) with today's 4th consecutive loss after meeting resistance near its 50 DMA line ($110.76). A rebound above the 50 DMA line is needed for its outlook to improve. It will be dropped from the Featured Stocks list tonight.
>>> FEATURED STOCK ARTICLE : Recently Undercut Prior High and 50-Day Moving Average - 12/8/2021 |
View all notes |
Set NEW NOTE alert |
Company Profile |
SEC
News |
Chart |
Request a new note
C
A
S
I |
|
|
|
THESE ARE NOT BUY RECOMMENDATIONS!
Comments contained in the body of this report are technical
opinions only. The material herein has been obtained
from sources believed to be reliable and accurate, however,
its accuracy and completeness cannot be guaranteed.
This site is not an investment advisor, hence it does
not endorse or recommend any securities or other investments.
Any recommendation contained in this report may not
be suitable for all investors and it is not to be deemed
an offer or solicitation on our part with respect to
the purchase or sale of any securities. All trademarks,
service marks and trade names appearing in this report
are the property of their respective owners, and are
likewise used for identification purposes only.
This report is a service available
only to active Paid Premium Members.
You may opt-out of receiving report notifications
at any time. Questions or comments may be submitted
by writing to Premium Membership Services 665 S.E. 10 Street, Suite 201 Deerfield Beach, FL 33441-5634 or by calling 1-800-965-8307
or 954-785-1121.
|
|
|